
Abstract
BACKGROUND:
The Therapeutic Patient Education (TPE) aims to help patients to understand diseases and treatments, and collaborate in healthcare by taking an active role in the management of a chronic disease. This transition from the classical patient compliance to empowerment is a revolutionary concept in medicine. However, this consensual idea is not easy to implement because of the complexity of medical records, which are designed for health professionals only.
OBJECTIVE:
In order to enhance the TPE, an intuitive tool based on a visuo-dynamic interface was developed to facilitate the self-evaluation of disability situations.
METHODS:
The paper describes the whole implementation process to implement such a user interface, from the development of an innovative low cost markerless motion capture to the 3D modeling of everyday life activities.
RESULTS:
A usability test carried out on twenty disabled people shows that participants are more at ease to perform a self-assessment of their motor disabilities through an animated stickman-based interface than a classical static interface.
CONCLUSIONS:
Considering the promising results of this study, the next step of this project will consist of integrating the visuo-dynamic interface into an existing platform (e-ESPOIRS-Handi) dedicated to information sharing between health professional and disabled people.
Keywords
Introduction
The development of a personal health record system (PHR) becomes more and more necessary owing to population ageing and the healthcare of disabling pathologies. Statistics show that one-half of older adults need personal assistance in the last month with daily activities [1]. In the US alone, a fifth of the population have some sort of disability and one in ten have a severe disability [2]. PHR promotes a centralization of the healthcare information regarding each specific patient [3]. Several advantages are expected from the use of such a system and, in particular, an improvement of the communication between patient and health professionals through an active involvement of the patient. However, PHRs are still marginally used across the world. There are several explanations for this situation. It has been identified that the main issue is caused by the fact that the RPHs are considered as a low relevance tool by patients, because of their bad usability [4]. This observation justifies the emergency of a scientific study regarding the necessary means to get an appropriate health information in an efficient and, above all, intuitive way.
A consensual organization of the medical assistance for disabled people can be represented by a system in which the patient is located at the centre to receive healthcare from a collection of health specialists [5] and family caregivers [6]. Thus, an ideal architecture for an PHR system should be patient centred. In the field, the healthcare system has to contend with one major limitation. This problem is the fact that the disabled person does not have an active participation in her/his own evaluation. However, no one has a better practical knowledge of her/his impairment than the individual that deals with the deficiency in everyday life. So, a research on an active involvement process of the patients themselves in order to carry out a strategic and customized analysis of the physical disability, seems necessary at a medico-social level (multidisciplinary health network), economic level (rationality of the financial costs) and ethic level (assertion of the position of the patient in the healthcare system) [7]. This is the purpose of this paper, which proposes to enable patients to carry out a self-evaluation of their motor deficiencies through an intuitive and user-friendly visuo-dyamic interface.
Related work
The Therapeutic Patient Education (TPE) helps patients develop and maintain the skills and competencies needed to manage their chronic disease in a collaborative healthcare treatment, taking an active role in the recovery along with relatives, health professionals and every social intervenient [8]. This concept ensures the patient can access and comprehend easily the information related to his/her state of health, with the objective of transforming him/her into a fundamental caregiver that will work in partnership with the health professionals [9]. According to this model, patient learns to adapt to behaviours leading to an improvement of his/her quality of life. The TPE covers the social aspects commonly overlooked in health treatments, namely in situations in which the patient does not fully comprehend the disease, the risks and the treatment [10]. As in any form of education, individuals are involved in a long-term learning process, in which they have to acquire knowledge, competencies and develop behavioural skills to deal with their disease and become as autonomous as possible.
A key aspect of the TPE, which is tackled by this study, is to provide patients with valid and accessible self-assessment instruments [11]. Here, the self-evaluation of motor performance and functionality is considered as a first and fundamental step in the empowerment of the disabled people. Thus, designing an intuitive and comprehensible interactive system for the patients will directly enable them to take an active participation in their own health management [12].
Although TPE thrives at equipping the patient with the knowledge and ability to understand every step of his/her recovery, this paradigm blocks at the language barrier between health professionals and average patients, the latter unable to absorb a technical and potentially complex dialect [13]. In addition, the current tools in TPE are mostly limited to a rigid paper format and non-customizable template that does not consider the self-evaluation by the patients themselves [14]. Nevertheless, the next paragraphs present three prototype tools that aim to consider the opinion of the disabled people by providing them with a self-assessment of their health situation. These examples describe instruments designed for a very specific neuromuscular disease and a global evaluation of the patient condition, respectively.
OSE (Outil Simple d’Evaluation) questionnaire is an example of pictogram based form used for the evaluation of the symptoms of the multiple sclerosis [15]. It is a francophone adaptation of the United Kingdom Neurologic Disability Scale (UKNDS – ex GNDS) [16]. It is composed with a selection of thirty items associated to the main symptoms of the disease, which affect cognitive functions, motor and sensorial system, and the psychological state of the patient. The evaluation system is based on a five levels scale, in which the individuals have to select the pictograms that best match their skill level. The scale amplitude goes from “normal condition” to “full deficiency”, with three intermediate levels. Figure 1 shows a situation in which a medium disability was chosen by patient, for the visual perception item.
One of the items of the OSE form, which evaluates the symptoms of multiple sclerosis from a five levels scale questionnaire.
Topics that are considered by HOLE for the self-evaluation to perform daily activities.
HOLE (Handicap Outil Léger d’Evaluation) is another form that is used for an overall evaluation of the symptoms and socio-medical conditions of disabled people [17]. Its structure is an adaptation of the Functional Independence Measure (FIM), which is designed to be used at different reading levels according to the user’s profile (professional vs. patient) [18, 19]. HOLE was created to provide a survey of the health condition and functional capabilities of disabled people (Fig. 2). This tool was a first attempt to evaluate the patients through an information sharing between professionals and patients. This questionnaire uses a medical language accessible to everyone and illustrated topics that facilitate the understanding by the patients. In addition, HOLE contents provide a rich information for physicians, who can use it to improve their diagnostic. A computational implementation of HOLE was carried out in the context of the e-ESPOIRS-Handi project [20, 21].
e-ESPOIRS-Handi is a web-based application aimed at the evaluation of physically disabled people. The tool is designed for both caregivers and patients thanks to two distinct user interfaces, which allow for sharing medical information. The platform intends to ensure a customised evaluation according to the specific impairments and needs of each disabled person. The user interface is mainly composed by pictogram-based questionnaires and dynamic forms to enhance its usability even for non-specialist people. The objective of this project is to improve the management of the multidisciplinary health care cooperative network and promote an active involvement of the patient by allowing self-assessment.
Last, but not least, is GEVA (Guide d’EVAluation des besoins de compensation de la personne handicapée), a referential evaluation guideline that is used by the Maisons Departemental des Personnes Handicapées (French centres for the assistance to disabled people). This guide is composed with height chapters (social, home, work, health, psychology, functional skills, assistance roadmap, evaluation synthesis) that permit a storage of relevant information, in order to build a customized plan for the loss of autonomy in disabled people. On one hand, it is a really exhaustive tool for the evaluation of the medico-social state and needs of the individuals. On the other hand, this exhaustiveness brings a high complexity to fill in a very extensive document, which is not always accessible to everyone and that is limited to a rigid non-customizable paper-based template.
From the considerations exposed previously, it seems that an appropriate management of chronical deficiencies involves the plasticity of the digital supports. This characteristic makes them a great asset in the technological enhancement of the TPE [22]. This study proposes an intuitive interface to facilitate a customized self-evaluation of neuromuscular deficiencies. In this implementation, intuitiveness means that the different levels of motor performance are dynamically presented and tunable by the patients, which is a more ecological situation to carry out an assessment than a fixed self-rating scale. This tool will be next integrated into our Web platform e-ESPOIRS-Handi [19]. The main challenge of this platform is to be both usable by patients and useful for health professionals. Due to the fact that the patient has to self-evaluate motor activities, the design of the interface is based on an animated 3D avatar that may perform an action at different skill levels. An animated avatar is preferred to a video, because it allows the user to manually and precisely adjust the kinematics of the movement. Patient’s task is to select the skill level that matches his/her own skill to carry out the same action. The hypothesis is that it will be easier for a disabled person to complete a self-evaluation of an everyday life activity (such as, to eat, to dress, to seat, to walk…) that is based on a visual display of this activity than the static scale used in the typical questionnaires. Moreover, we argue that the assessment of a motor activity would be more accurately identified if it is based on a visuo-dynamic representation. Overall, this tool is intended to be a mediated system that will promote data sharing regarding the severity of the impairment between caregivers and from the patient’s point of view [23]. The most innovative aspect of this approach is to allow disabled people having a participation at a certain level of their PHR and, consequently, being directly involved in the evaluation and management of their disability.
This paper describes the whole implementation process of the visuo-dynamic interface for self-evaluation, which can be divided into the steps as follows: (i) motion capture of the everyday life activity, (ii) image processing, (iii) action modelling, and (iv) development of the interface per se. This computational work is complemented by a questionnaire applied to a patients’ sample, in order to compare the usability of the dynamic interface vs. a static interface.
Motion capture device
Motion capture is used in a wide range of areas, from the entertainment industry (e.g., tridimensional animation) [24, 25] to scientific studies, such as biological motion analysis [26, 27]. However, this is usually an expensive and complex technology, which is not affordable for all research groups. Moreover, the capture devices work only in very controlled conditions. In the case of entertainment, a popular tool used in gaming is the Kinect device from Microsoft [28]. Although this technology is relatively cheap, it does not provide high spatial and temporal resolutions, which limit its use for research purposes [29]. In addition, it is not suitable for the whole environmental conditions (e.g., outdoor) and user positions (e.g., lying down). Nowadays, a motion capture that enables a precise analysis of movements requires high cost professional tools, such as the Vicon system [30]. This kind of technology is based on markers positioned on the individual body, in order to increase the precision. In several cases the use of markers cannot be applied because of constraints regarding the subject (e.g., an animal) or the setting (e.g., recording the movement in a natural environment). So, we were looking for a technological alternative to carry out a tridimensional capture from low-cost materials (2 CCD webcams) and without any marker. These constraints are justified by the fact that we intend to propose a motion capture technique that could be easily replicated by other medical institutes, in order to record additional patients and, consequently, expand the movement database. The technique is based on the combination of two motion capture methods: (i) manual selection of key features in the image [31], and (ii) 3D reconstruction of motion from two bidimensional plans [32].
Configuration of the two CCD webcams (Rl and Rr). This design is based on the study carried out by [33].
Here, the video capture is carried out by two CCD webcams that permit a stereoscopic reconstruction of the scene through two different viewpoints (Fig. 3). In this configuration, a common feature on the two camera views has different coordinates in the camera images. From this disparity, the tridimensional coordinates of the feature can be calculated following three stages:
Feature extractions (e.g., the body joints). Matching of the similar points in the two images (
Here, the two camera device is designed in order to simplify the calculation of the 3D coordinates of the stereo-corresponding points, thanks to two properties:
The optical camera axes are parallels. The junction line between the two optical camera axes is horizontal. In this configuration, the disparity only exists following the horizontal axis of the camera images.
Five of the main frames of the example movement used to test the system: “sit-down/stand-up” action. In each picture, the left part corresponds to the image captured by the left camera (Rl) and the right part is captured by the right camera (Rr).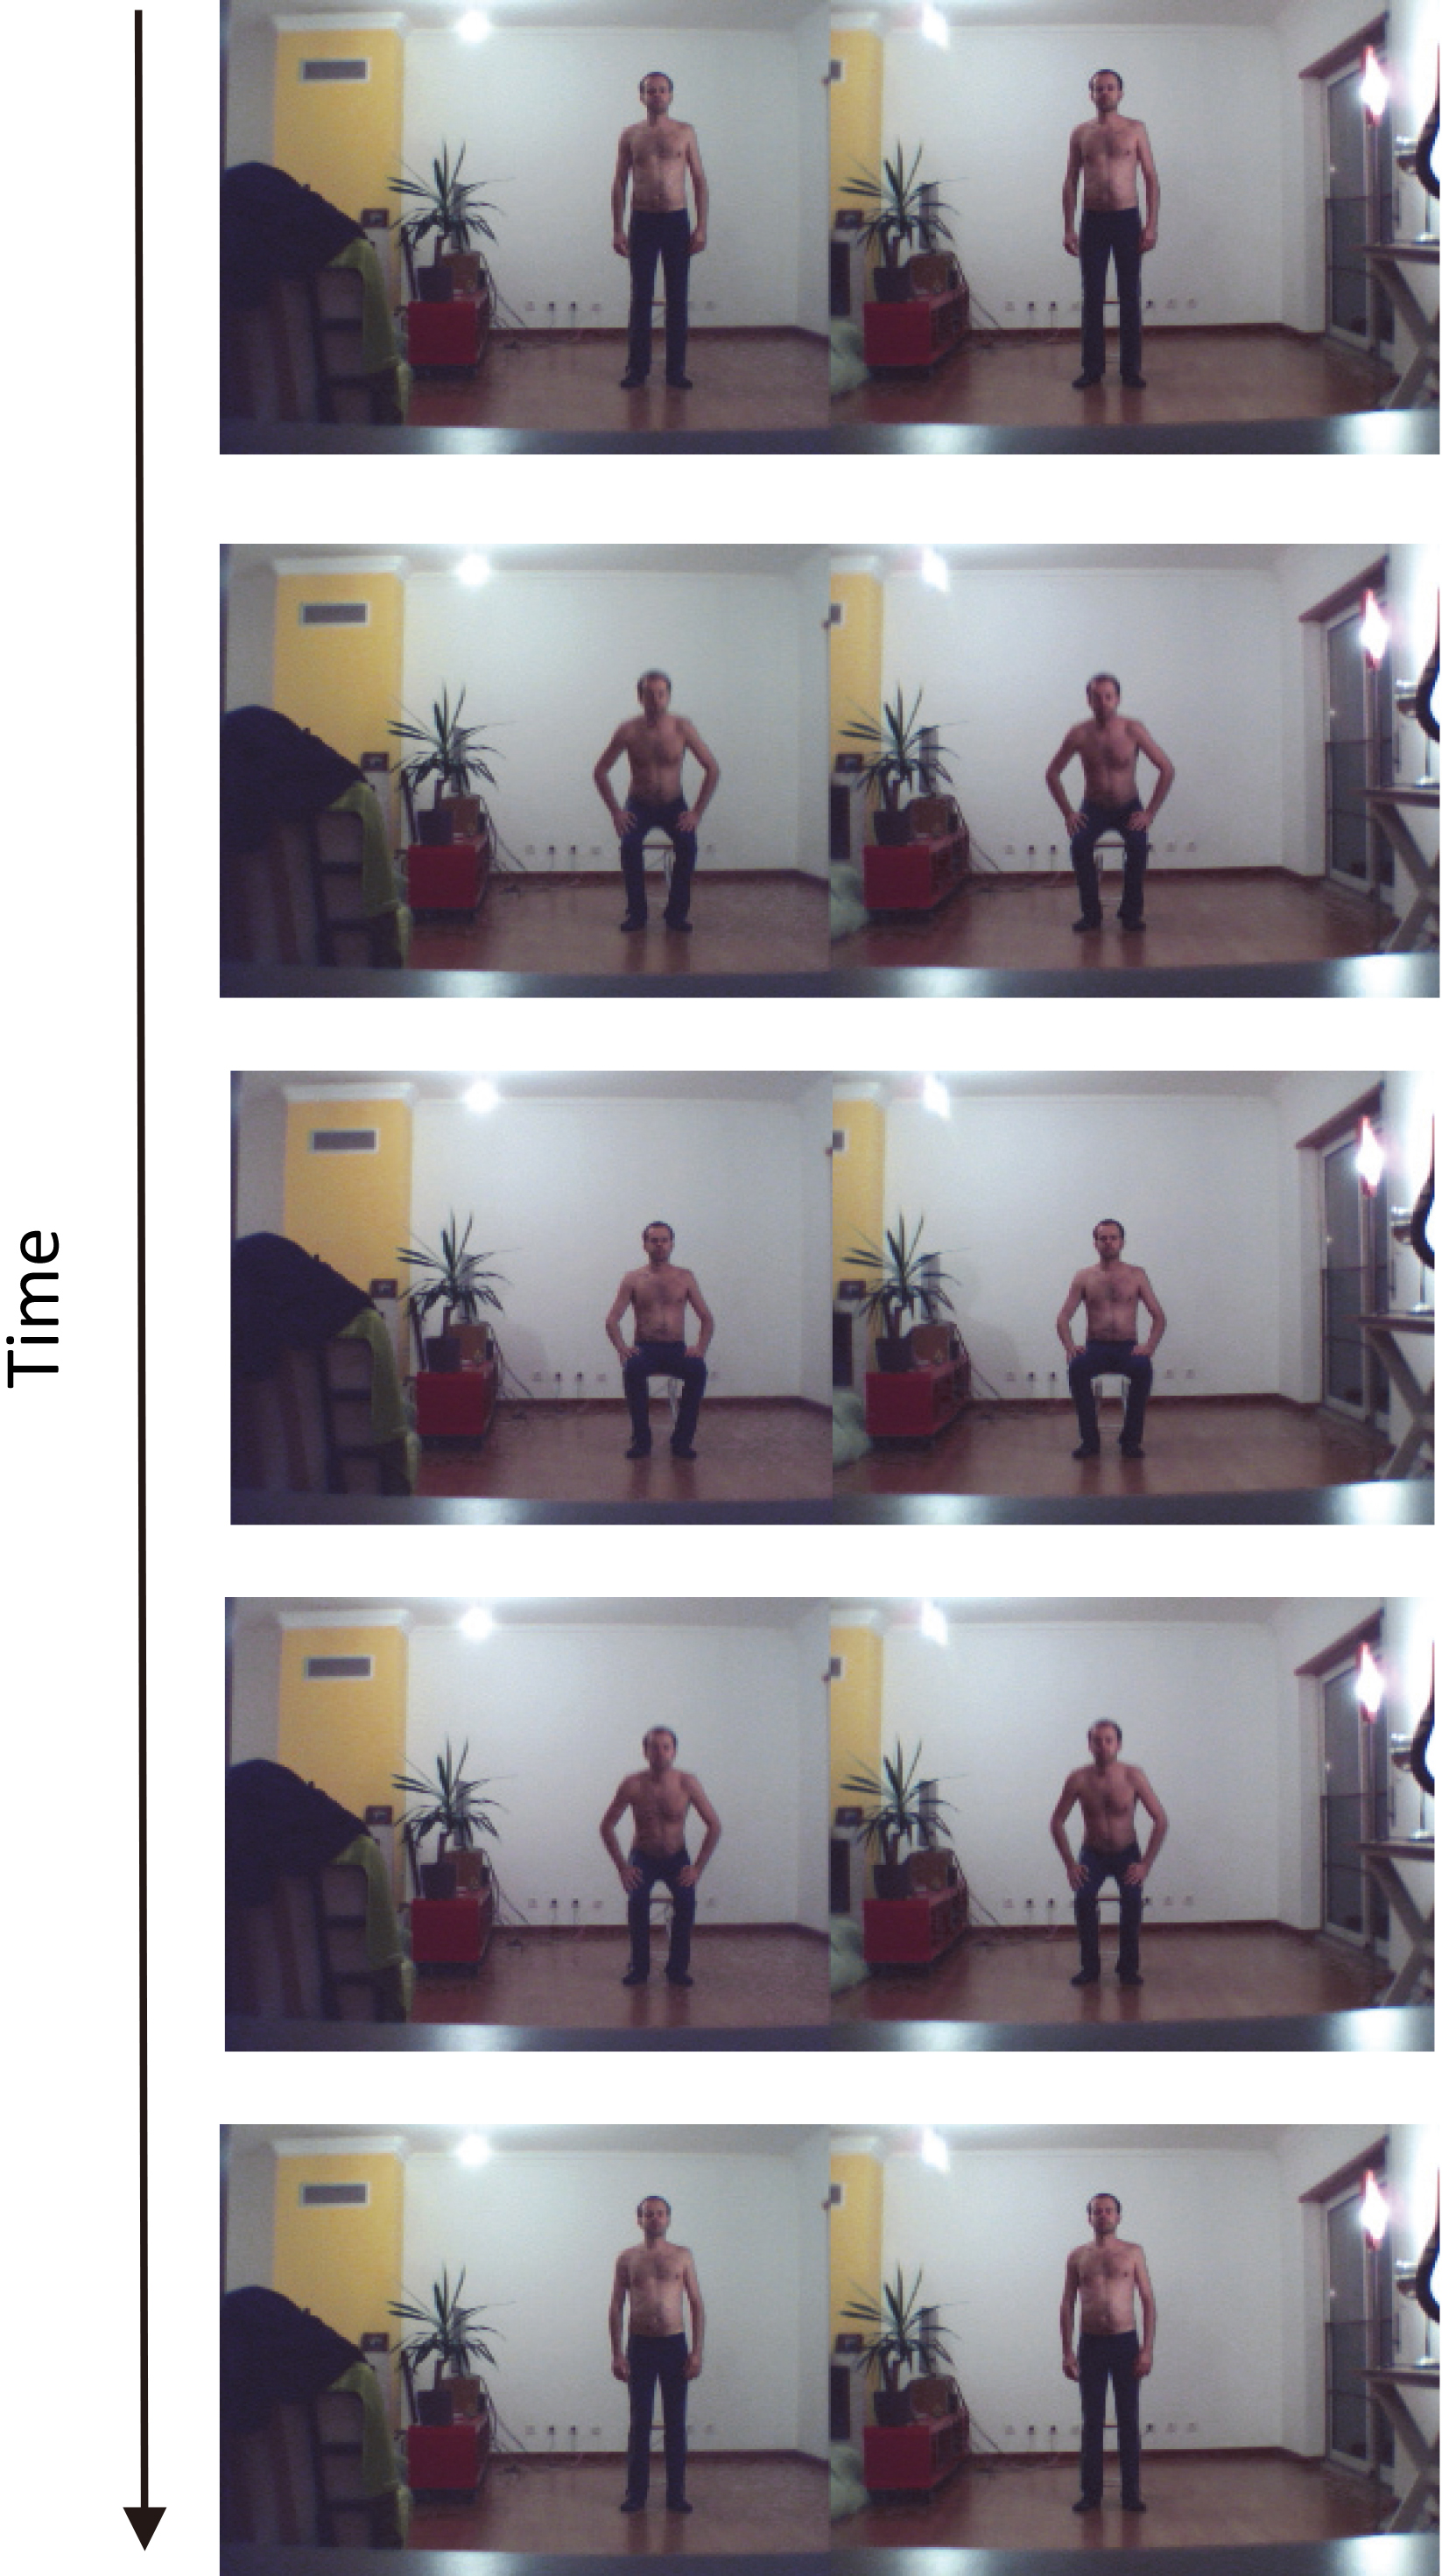
Description of the principle of background removal. The background image is subtracted from the image that includes the individual. The result is a picture with the individual only.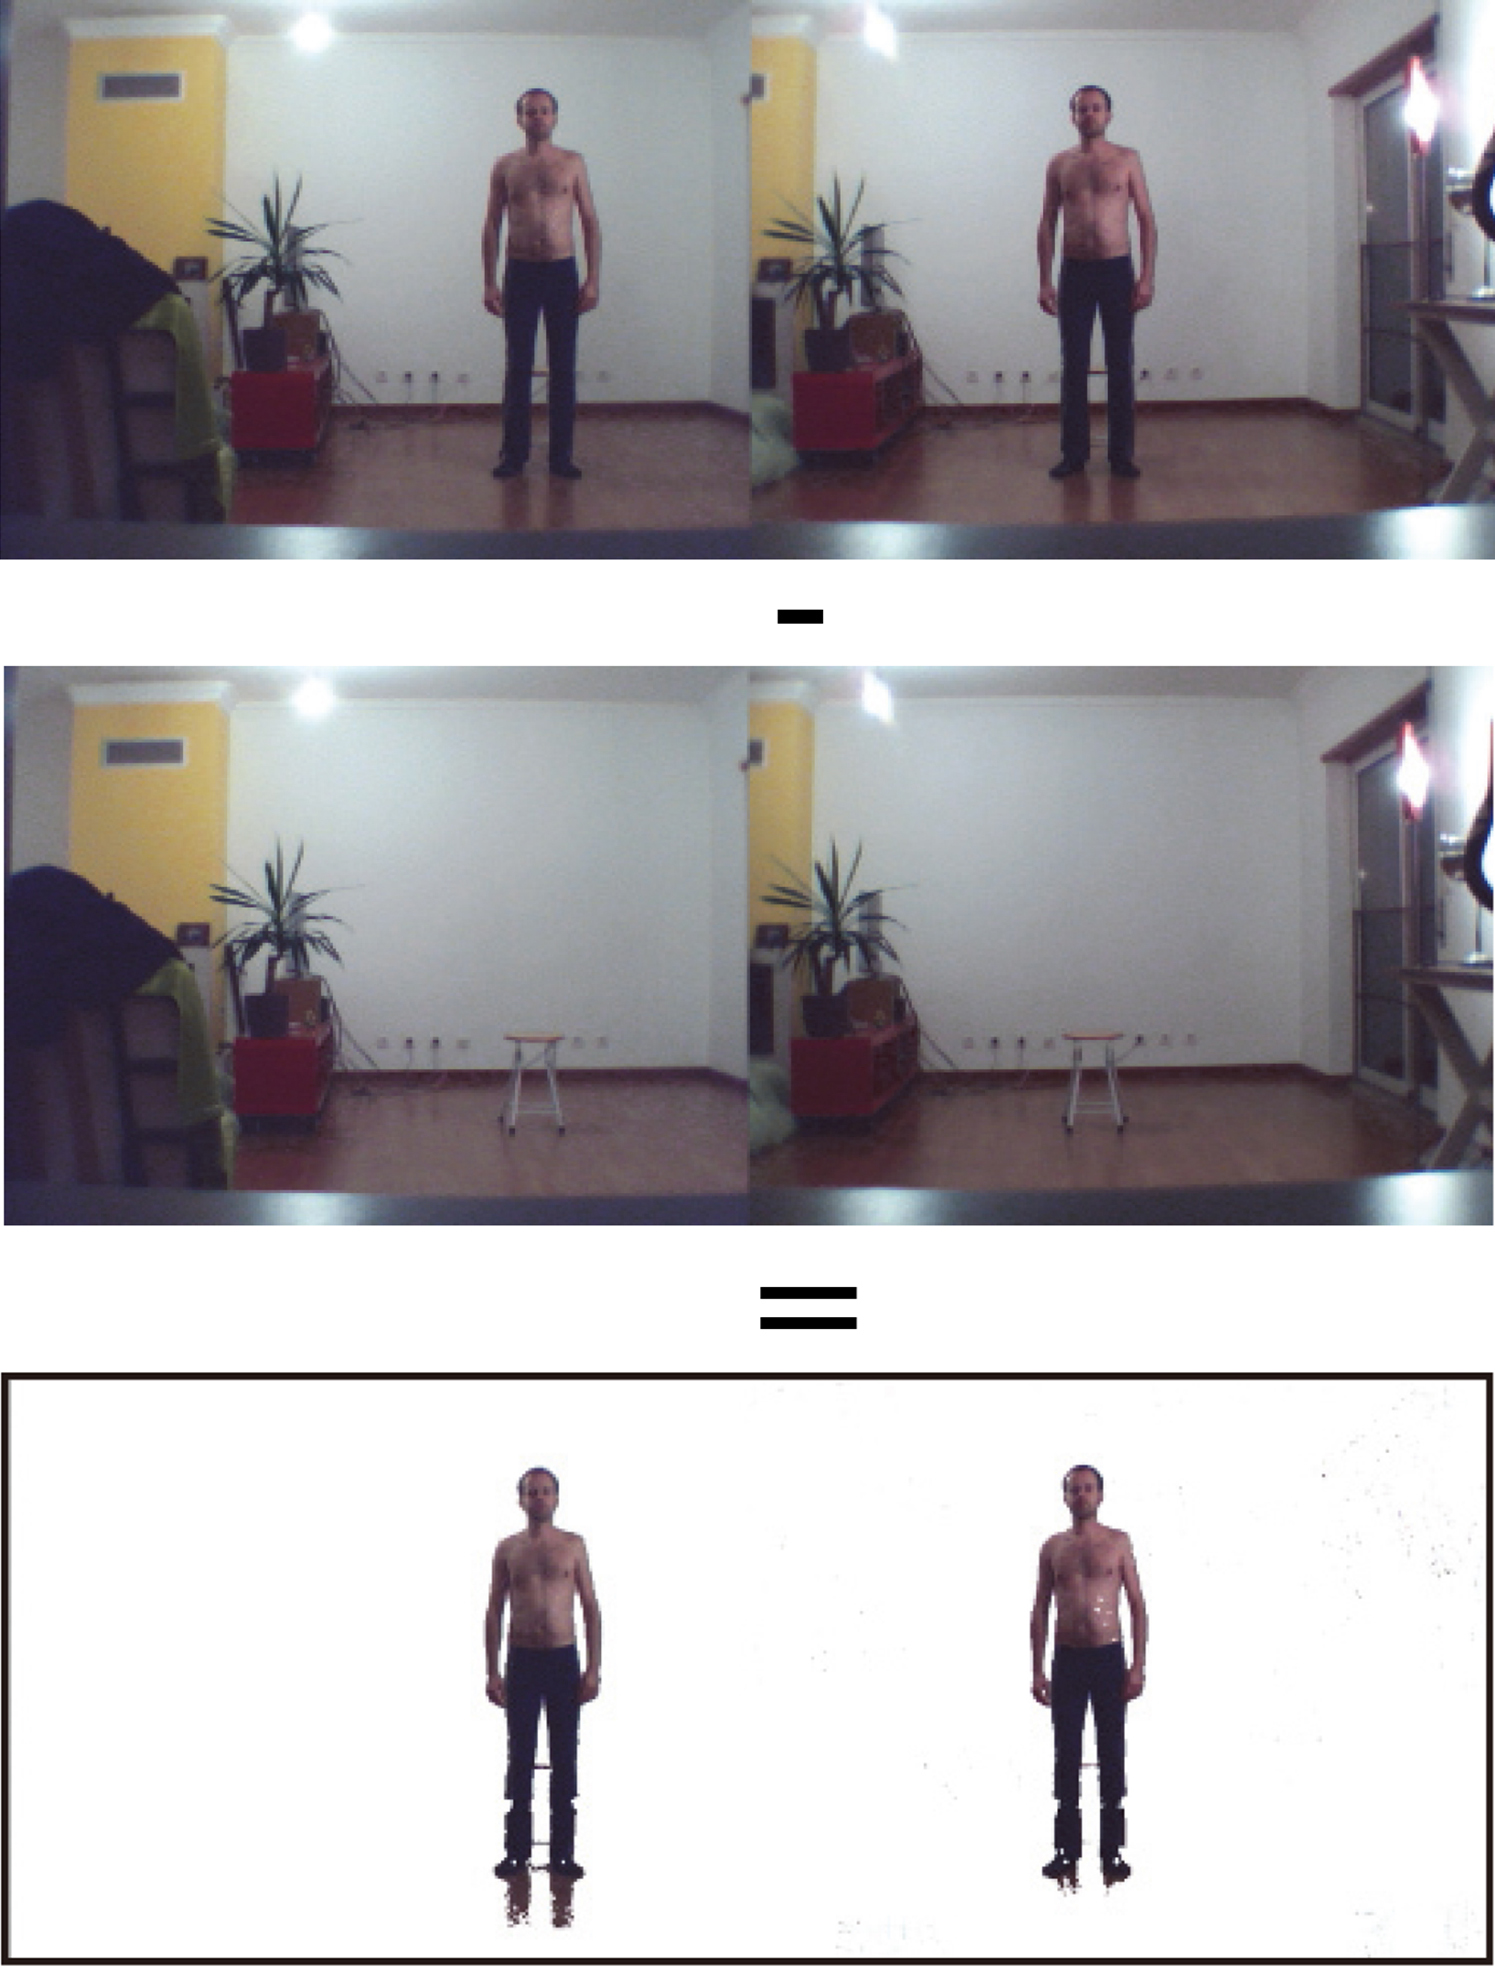
Video capture and frame-by-frame segmentation
The video capture is carried out at a frame rate of 60 frames per second. The image size is 640
Background subtraction
The first part of the processing consists in subtracting the background image from the complete image (individual
Memorize the background image. Check every pixel in the frame. If it is different from the corresponding pixel in the background image, it is a foreground pixel. If not, it is a background pixel.
Due to the fact that the background image and the images with the individual are not taken at the same time, the brightness of pixels with same coordinates is not necessary identical. Thus, it was indispensable to define a distance threshold of brightness when compared the background to the action images (see Algorithm 1). For every pixel, if the absolute difference of brightness between the image with the individual and the background image is lower than the threshold (empirically defined at 40), then the corresponding pixels are considered identical. In this case the pixels are colored white (lines 14 to 15 of Algorithm 1). On the other hand, if the brightness difference is higher than the threshold, the color of the pixel does not change (lines 16 to 17 of Algorithm 1). Thanks to this method, it is possible to segment the body of the individual. The calculation of the value of the difference is based on the computation of the distance between each color component of a pixel (RGB). In other words, colors are considered as points in a tridimensional space (line 13 of Algorithm 1).
[h] Generating the background subtraction[1] for(int i
for(int x
for(int y
int pos
color frameColor
color refColor
float rFrame
float gFrame
float bFrame
float rRef
float gRef
float bRef
float diff
rRef, gRef, bRef)
if (diff
image.pixels[pos]
else
image.pixels[pos]
frame[i].pixels[pos]
Selection of key locations
Manual process: Temporal tracking
To select a location, the user must click the mouse at each desired body joint in the left camera view. X-Y locations (in image coordinates) are recorded through a program in Java. The bidimensional coordinates of 13 (or 15) joints are listed into a file, in the following order: 1. head, 2. R shoulder, 3. R elbow, 4. R wrist, 5. R hip, 6. L shoulder, 7. L elbow, 8. L wrist, 9. L hip, 10. R knee, 11. R ankle, 12. L knee, 13. L ankle, 14. sternum, 15. navel. 40
In the first step of the image processing, the key features (here, the individual joints) from the left view are manually selected (numbered squares). Each joint is identified with a specific number.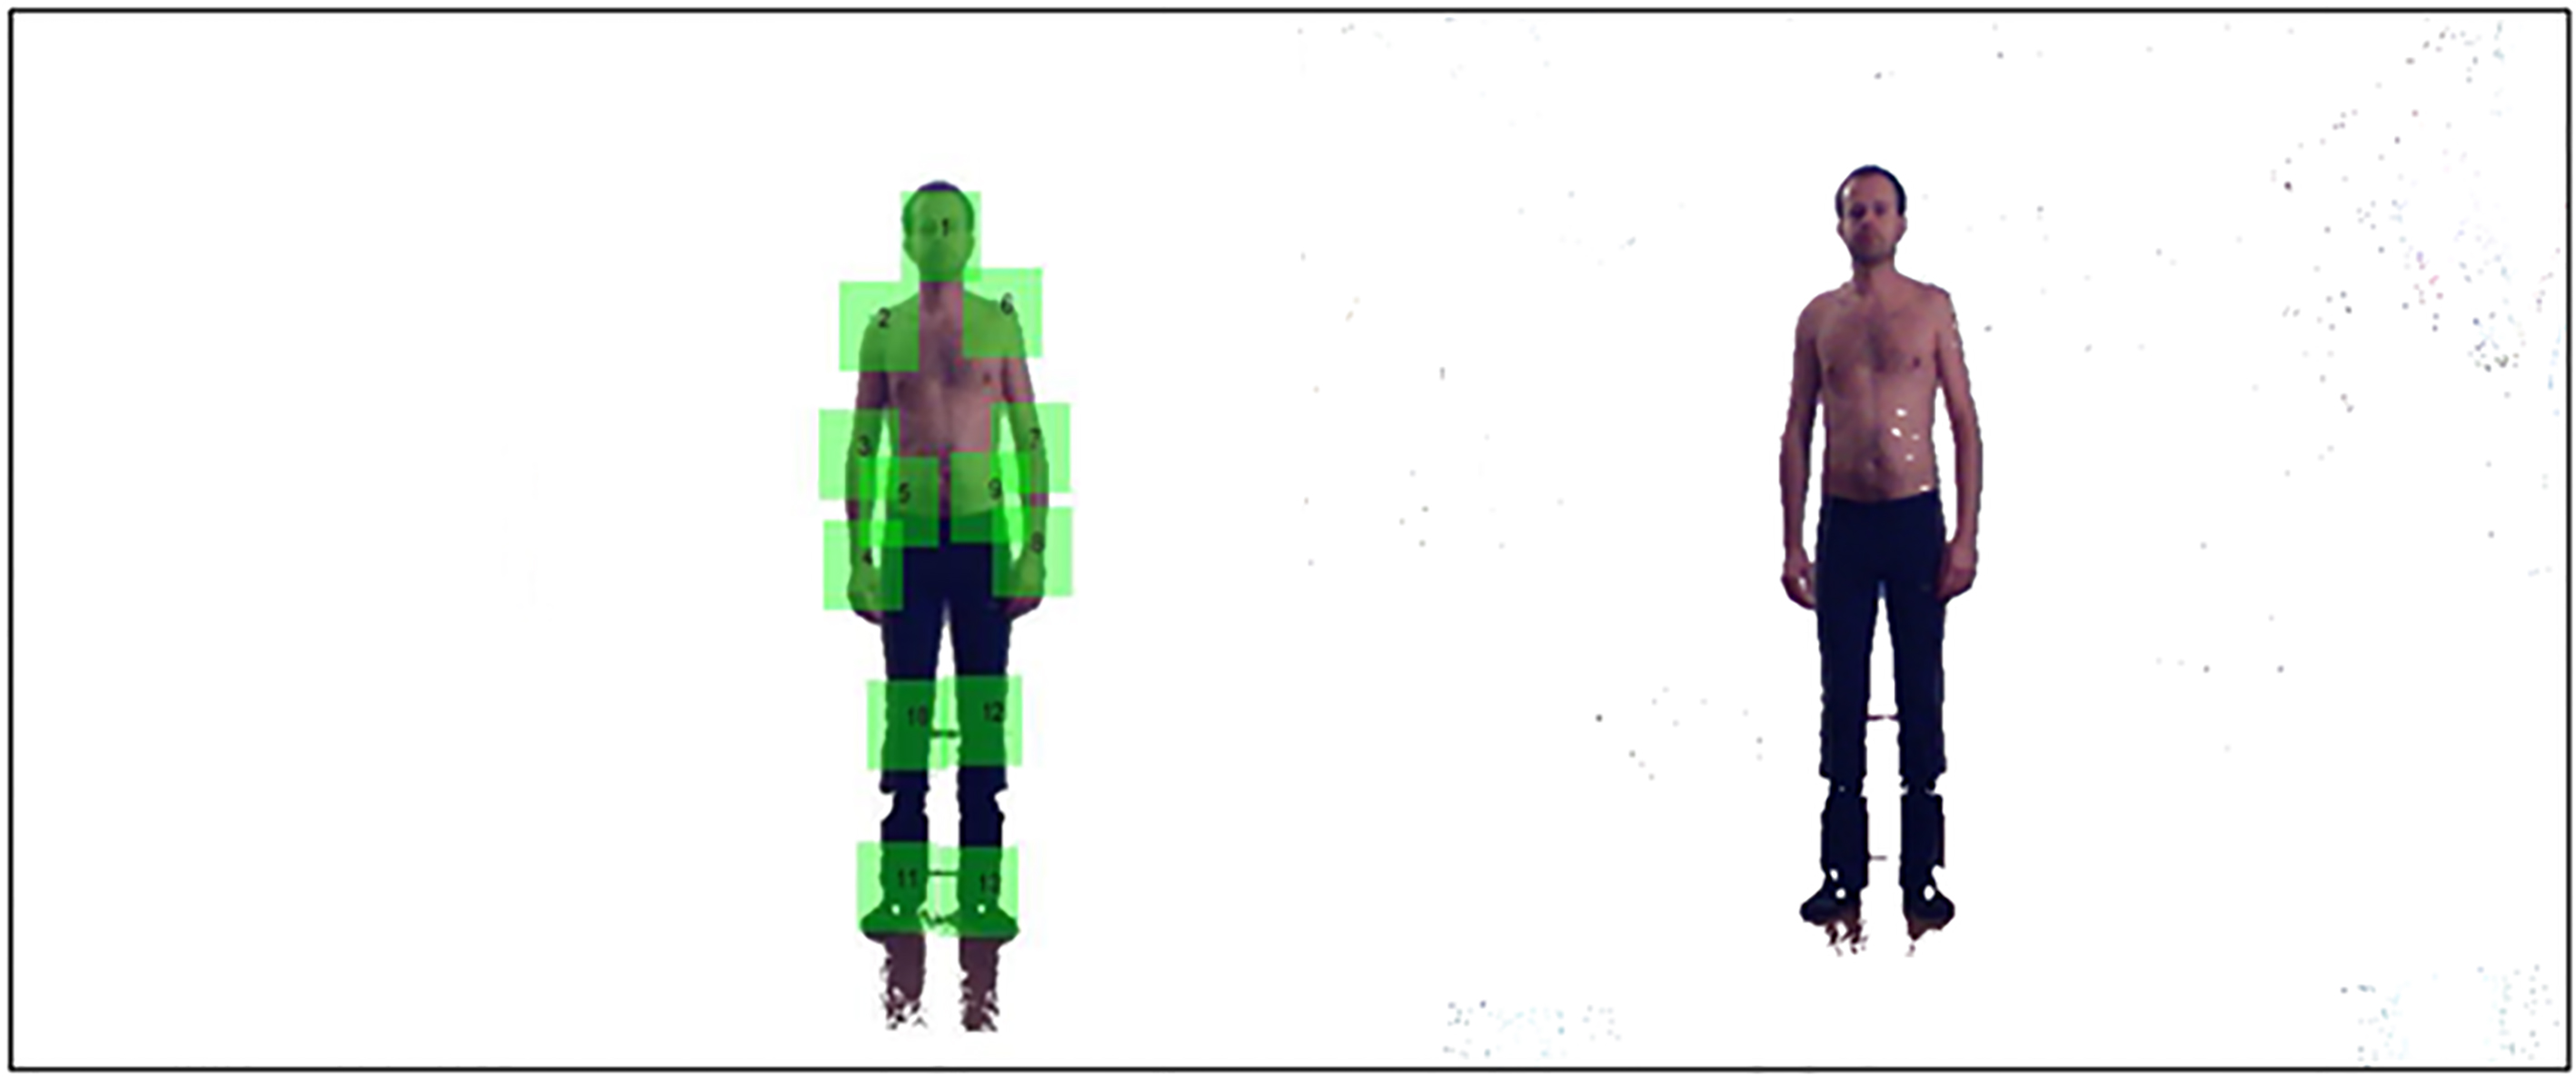
[b] Generating the black/white blob filter[1] float totalBright
for(int x
for(int y
int pos
totalBright
[pos])
float mediaBright
for(int x
for(int y
int pos
if(brightness(patch[i].pixels[pos])
mediaBright)
patch[i].pixels[pos]
else
patch[i].pixels[pos]
Contrary to the previous stage, this one is based on an autonomous algorithm of image processing. First, a black and white filter is applied on each extracted blob to facilitate the blob matching (see Algorithm 2). All the pixels of a blob are read in order to calculate the average brightness for each blob (lines 2 to 6 of Algorithm 2). Then, the pixels are read a second time in order to update their color to black or white according to their brightness value regarding the average brightness of the blob (lines 7 to 13 of Algorithm 2). If the pixel brightness is higher than the average brightness, the pixel will be white, otherwise the pixel will be black.
Then, the program searches for the 40
In the second step, each joint from the left view is automatically matched with its pair on the right view. A same ID number, for right and left images, is applied for a determined joint (e.g., 1 for the head, 2 for the right shoulder…) in order to facilitate the calculation of the 3D coordinates from the two 2D coordinates.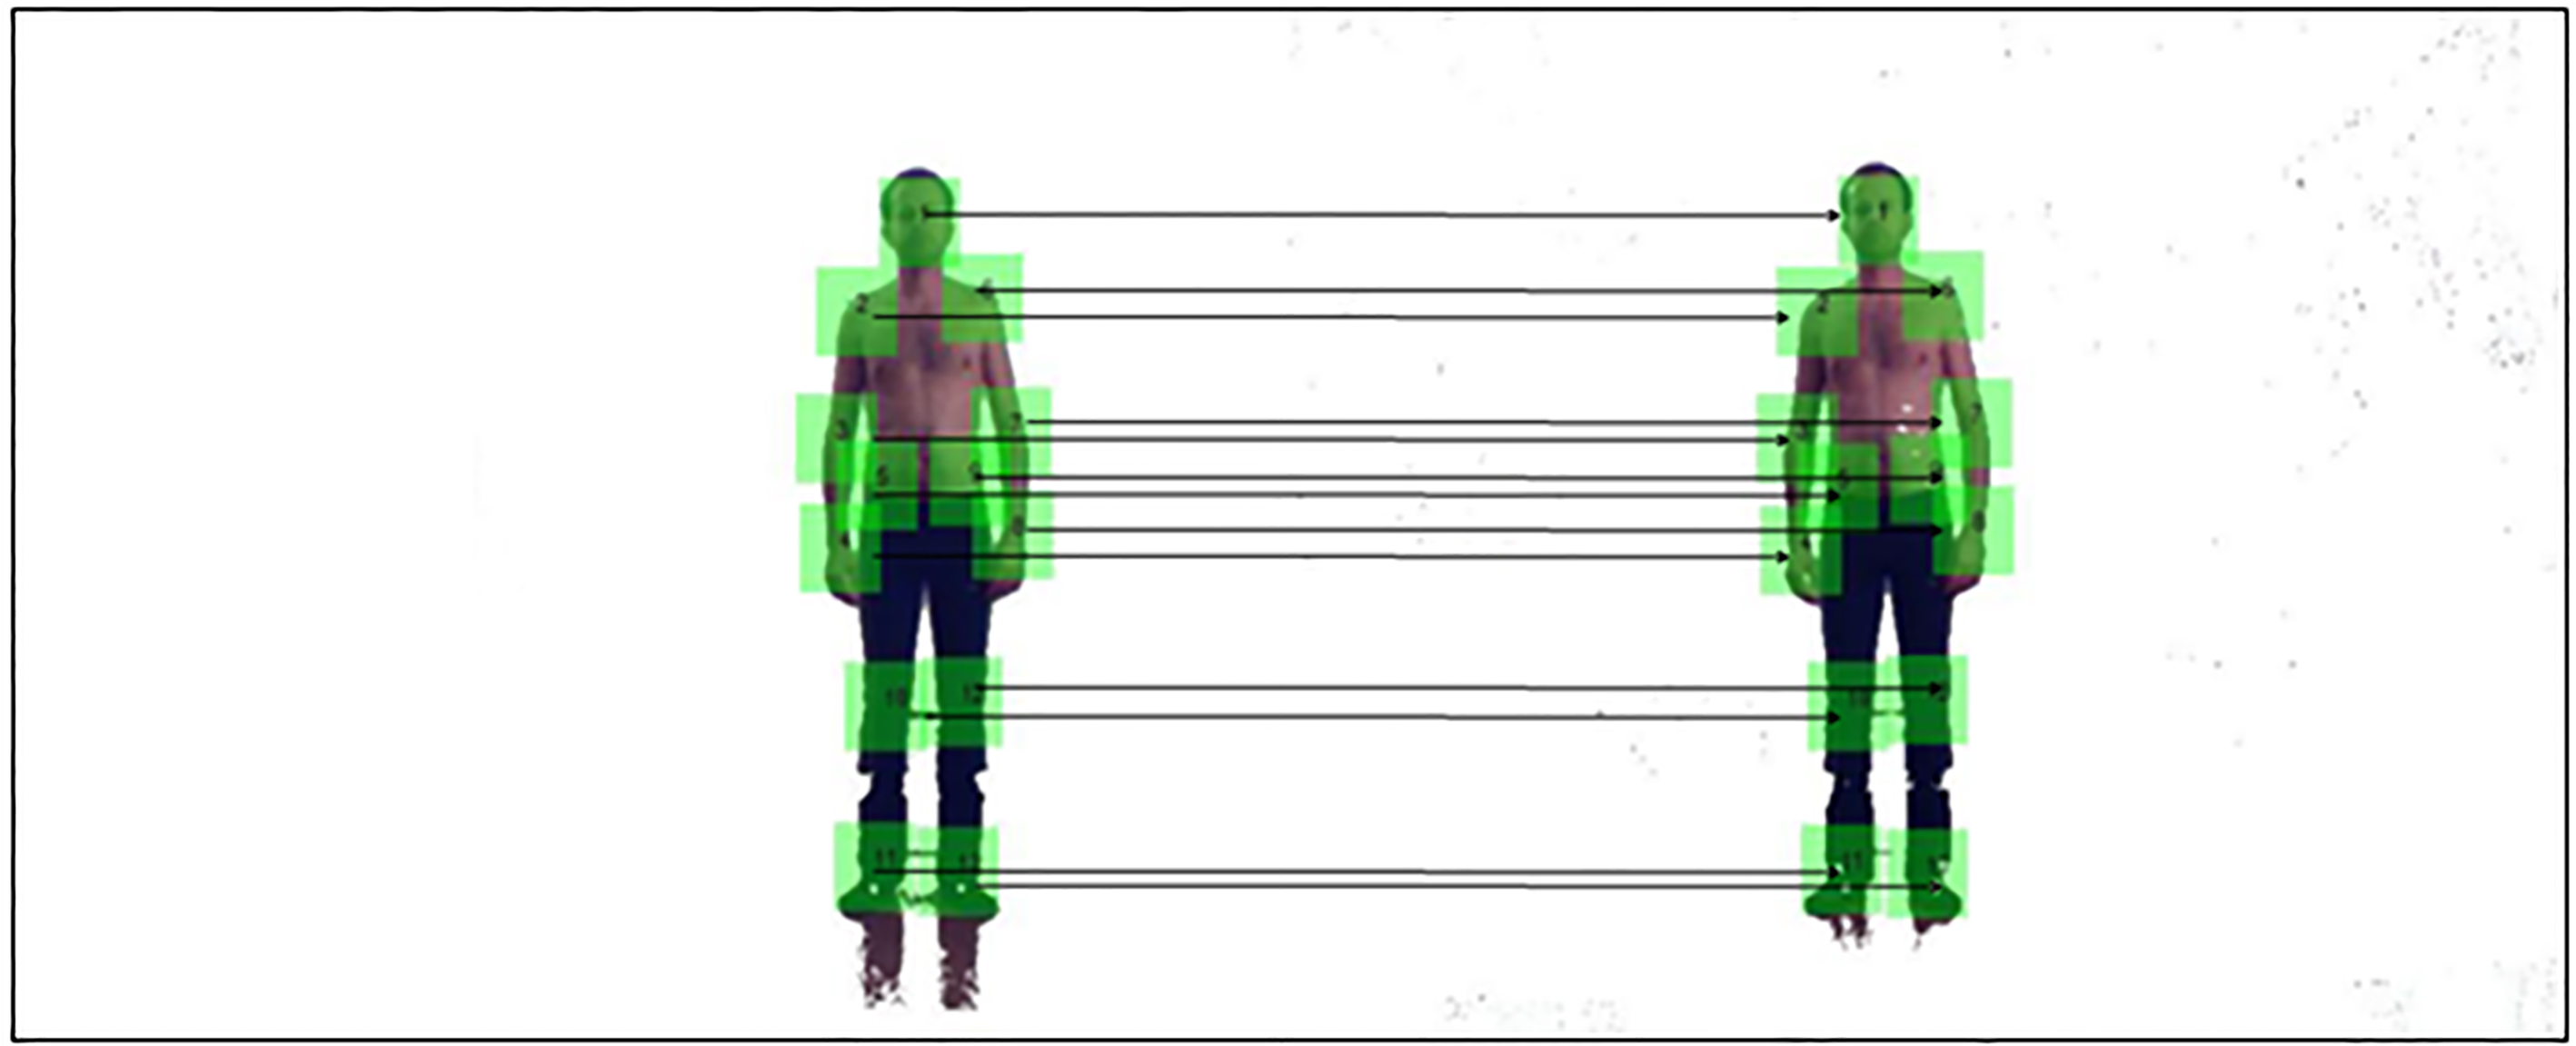
[b] Generating the horizontal matching[1] for(int x
for(int y
int pos
if(patch[i].pixels[pos]
[pos])
patchFound[i][pos]
else
patchFound[i][pos]
for(int j
if(patchFound[i][j]
matchRate++
if(matchRate
bestMatchRate[i]
bestMatching_X[i]
Hori[i]
bestMatching_Y[i]
Hori[i]
if(posX_patch[i]
end_searching[i]
print(bestMatching_X[i]
The method to carry out blob comparison between right and left images is described in the Algorithm 3. An array records the number of identical pixel colors between two blobs. If the color is the same, the program puts “one” in the array, otherwise it puts “zero” (lines 1 to 7 of Algorithm 3). The best matching blob is selected on the base of the highest percentage of one digits (lines 8 to 14 of Algorithm 3). The research of the pair of blobs stops when the horizontal scan exceeds a certain value on the X-axis of the image (lines 15 to 17 of Algorithm 3).
The calculation of tridimensional coordinates of each key point in the image is carried out from the two 2D coordinates of a same joint in the bidimensional video frames. The equations used for the computation are as follows:
Here is the description of each parameter of the equations presented above:
(Xp, Yp, Zp)
Stick-based display of the video resulting from the 3D calculation of the individual joints for the “sit-down/stand-up” action. As it can be noticed the outcome is perfectly similar to the movement recorded with the two low-cost cameras.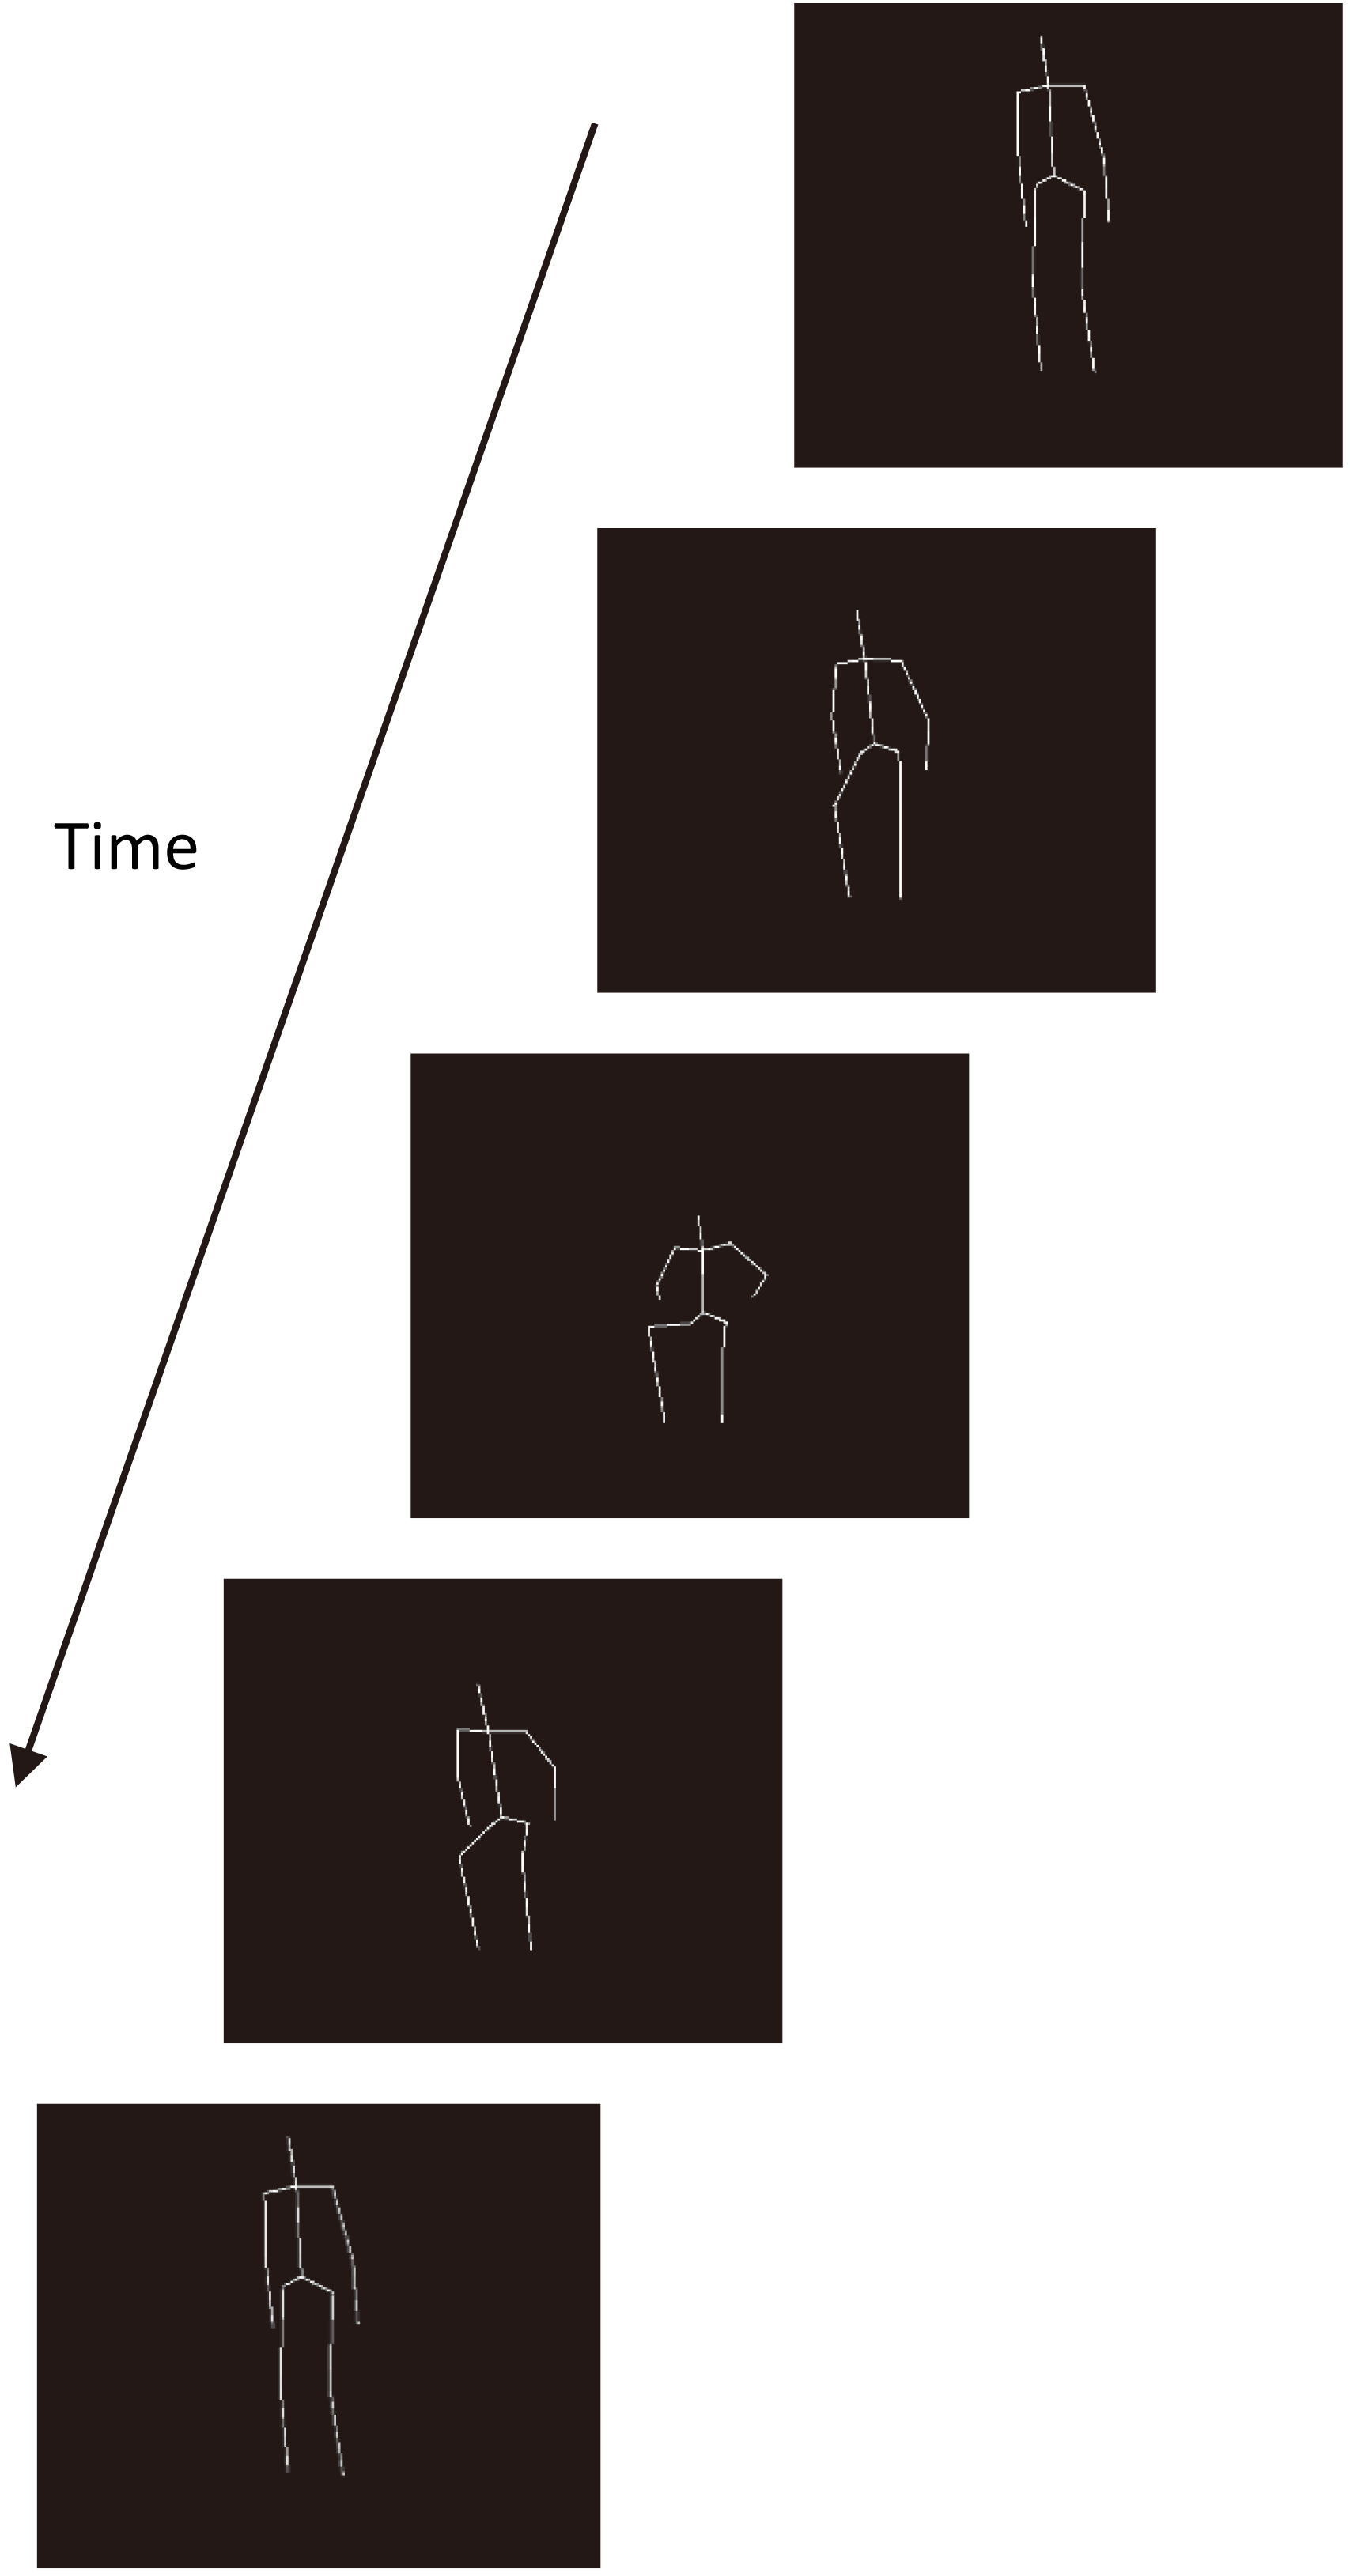
Normalization
The data normalization consists of moving the body’s barycenter to the origin of the 3D axes. It permits a control of the effects applied to the avatar, such as: a linear translation, to place the avatar at the center of the display window, and a Y-rotation, to facilitate the tridimensional visualization of the movement.
Filtering
The data are filtered to make the movement smoother. The process consists of calculating the average of the coordinates of a same joint in two successive frames. A significant increase in the quality of the animation is obtained after these successive operations on the raw data.
Results
The method used to select and match each identical feature between the two different viewpoints lead to a 100% of correct identifications. It means that the algorithm implemented enables us to match perfectly each joint in the two different camera views.
After computation of the Eqs (1)–(3) to calculate the tridimensional coordinates of each joint, a program was implemented to display the final result. Figure 8 shows the outcome in the form of a stick-based representation of the “sit-down/stand-up” action.
Movement modelling
Sinusoidal regression
In order to get a mathematical model of the human movement, we assume that the motion of each body joint follows a sinusoidal function [35]. To find out the sinusoidal equation for each joint, we search for the sinusoidal regression that best fits the recorded data. The sinusoidal regression used is as follows:
Here is the description of each parameter of the equation presented above:
This regression equation is applied to each 3D-axis-coordinate (X, Y and Z) for each body joint. Thus, at the end, we get a file that contents the values a, b, k and c for each joint and their respective tridimensional measuring.
Data computed in the previous stage are read by a program in order to calculate the coordinates (X, Y, Z) of each joint, by using the variables (a, b, k, c) of the sinusoidal regression. Algorithm 4 explains the way the calculation of the coordinates is carried out. Each joint is identified by an id (i
[h] Generating the sinusoidal model[1] for(int i
for(int axis
String line
String[] values
switch(axis)
case 0:
X[i]
float(values[1]) * (time
float(values[2])))
float(values[3])
case 1:
Y[i]
float(values[1]) * (time
float(values[2])))
float(values[3])
case 2:
Z[i]
float(values[1]) * (time
float(values[2])))
float(values[3])
GUI based on a slider with a five levels scale to enable the user to select the motion skill that matches patient’s capabilities.
A classical difference between a highly disabled person and a moderately disabled one is the velocity to execute an action. Thus, in order to test the previous model, we implemented a graphic user interface (GUI) that enables the user to display the sit-down/stand-up action at different speeds. A five levels scale (from 0 to 4) allows patients to select the movement’s velocity that matches their own skill (Fig. 9).
[h] Generating the movement interpolation[1] normalFile
slowFile
String[] normalValues
String[] slowValues
float a
float(slowValues[0]))
float b
float(slowValues[1]))
float k
float(slowValues[2]))
float c
float(slowValues[3]))
switch(axis)
case 0:
X[i]
case 1:
Y[i]
case 2:
Z[i]
At first the program loads two files, slow and normal motion, which content the values a, b, k and c for the action recorded at slow and normal speed respectively (line 1 to 2 of Algorithm 5). Then, an interpolation is implemented in order to get the values for movements performed at intermediate levels of disability (lines 5 to 8 of Algorithm 5). For these last levels, the velocity of the movement is proportional to the point-scale selected by the user.
Representation of a classical questionnaire based on a five levels Likert scale. Here, pictograms are used to symbolize the different skill levels to complete a given action.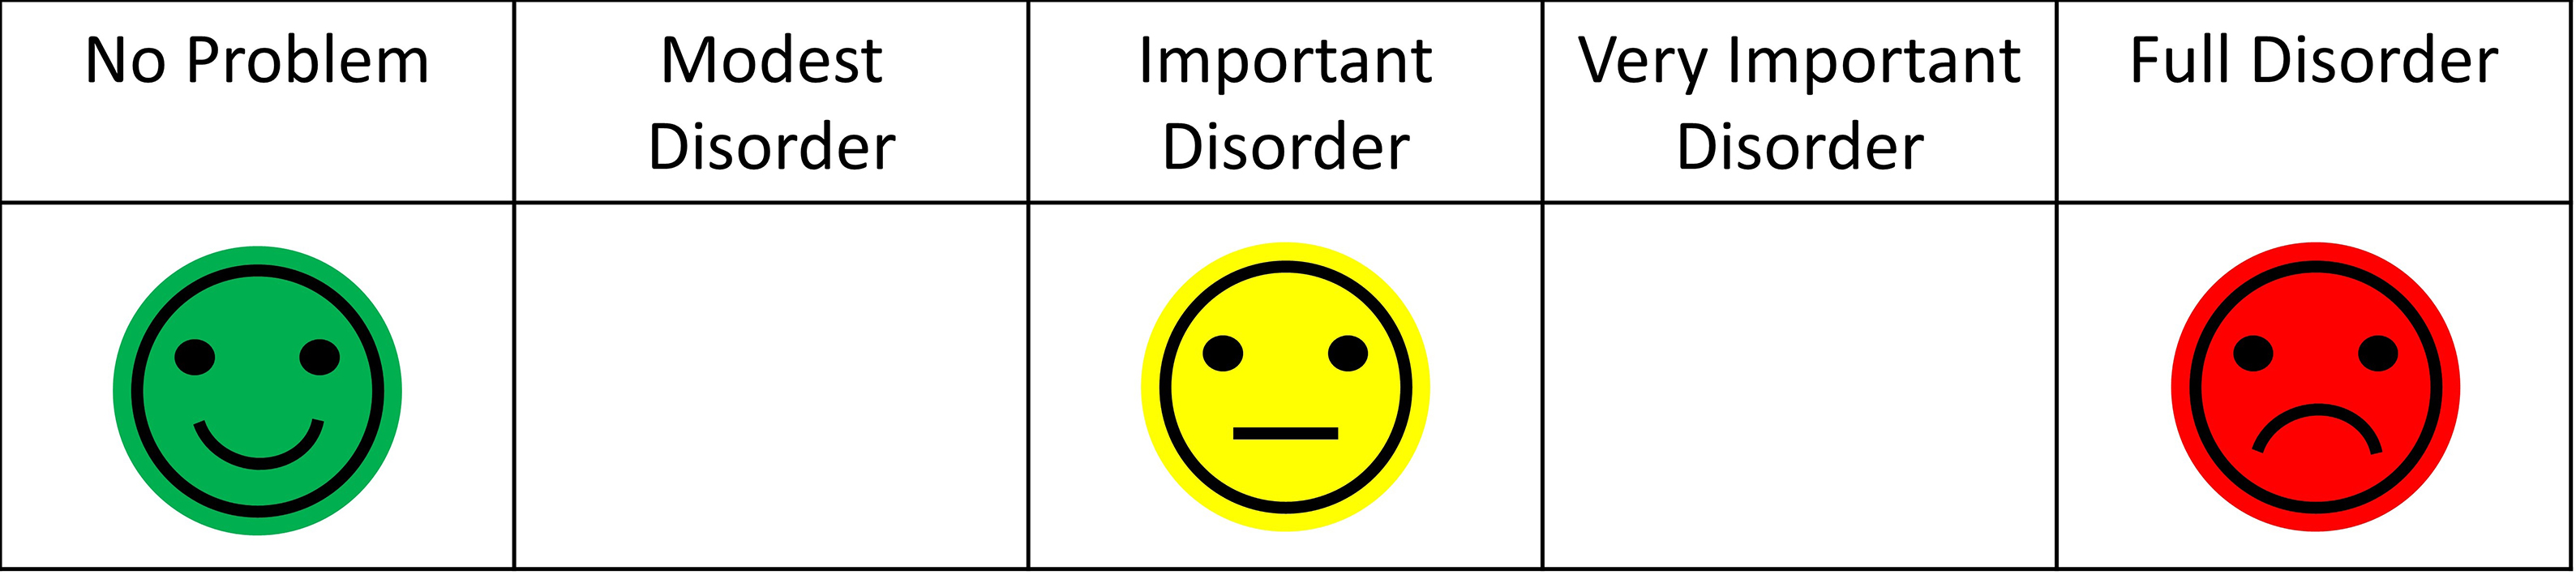
In order to evaluate if the GUI presented here was actually appropriate for patients, a usability test was carried out. Twenty subjects (10 males and 10 females) between 50 and 60 years old participated in the experiment. The inclusion criteria were as follows: (i) being a motor disabled person, and (ii) having a motor impairment lower than four on the modified Ashworth scale [36]. Individuals with cognitive disorders were excluded from the study. Participants were informed about the purpose of the experiment and they gave us their consent to participate. The task consisted of asking participants to compare the usability of two interfaces of disability assessment: a classical static pictographic scale (Fig. 10) vs. the visuo-dynamic avatar developed here (Fig. 9).
SUS (System Usability Scale) was chosen as usability test, because it enables us to get a reliable subjective evaluation by the users in few questions (high correlation with other tests of subjective measures) [37, 38]. SUS is a questionnaire based on a Likert scale, in which a statement is made and the respondent then indicates the degree of agreement or disagreement with the statement on a 5-point scale, from “strongly disagree” (0) to “strongly agree” (4). The statements, adapted for the purpose of this specific study, were as follows:
I think that I would like to use this interface frequently. I found the interface unnecessarily complex. I thought the interface was easy to use. I think that I would need the support of a technical person to be able to use this interface. I found the various functions in this interface were well organized. I thought there was too much inconsistency in this interface. I would imagine that most people would learn to use this interface very quickly. I found the interface very cumbersome to use. I felt very confident using the interface. I needed to learn a lot of things before I could get going with this interface.
To calculate the SUS score, first sum the score contributions from each item. Each item’s score contribution will range from 0 to 4. For items 1, 3, 5, 7 and 9, the score contribution is the scale position minus 1. For items 2, 4, 6, 8 and 10, the contribution is 5 minus the scale position. Multiply the sum of the scores by 2.5 to obtain the overall value of system usability. Results are 70 out of 100 and 90 out of 100 for the static interface and the dynamic interface, respectively. A t-test analysis shows a significant difference in the evaluation of these two types of interface (
Finding new methods to increase the participation of disabled people in the management of their own impairment is a critical topic in Human-Machine Interaction (HMI) and Ethics. Previous studies have demonstrated that the involvement of the patients is a key issue in the way to improve quality of life for disabled people [39, 40]. Also, digital systems are an essential support to facilitate the management of situations of disability, in particular, and chronic diseases, in general. Built on the concept of TPE, the tool presented in this paper aims to promote the disability self-assessment in order to enable patients to easily express and share their autonomy issues with health professionals. The end objective is to increase the accuracy in the identification of the specific needs for each disabled person. To do so, the tool had to be both as simple as possible for the patients and as informative as possible for the professionals.
The paper describes all of the process to build a visuo-dynamic interface for self-evaluation, which is based on a 3D animated avatar that executes an everyday life activity at different levels of disability. Our approach shows that an affordable technology, based on computer vision, can be an alternative means of three-dimensional motion reconstruction, when a commercial system (e.g., Vicon, Kinect…) cannot be applied, because the conditions prohibit the use of reflective markers and/or the action has to be recorded in an outdoor environment. The GUI is developed by using our technique of motion capture, image processing and movement modelling. An intuitive interface was built in order to promote self-evaluation by the end user. Thus, the patient can become a stakeholder that may collaborate with physicians, who may improve their medical evaluation through a comparison between professional and patient assessments. The originality of this approach is supported by the fact that self-evaluation is considered as an excellent prognostic of the true heath condition of the individuals [41]. Supported by the versatility of the information technologies (IT) the kind of visuo-dynamic questionnaire presented here enables the patient-professional pair to draw up a refined profile of the limitations and needs of each individual.
Results of the usability test show that a visuo-dynamic self-evaluation interface is preferred to the static one. SUS test score is 90 and 70 for dynamic and static GUI, respectively. Overall, participants felt more at ease to use our interface than the classicalquestionnaire. They highlight the fact that it is more “natural and precis” to proceed with a self-assessment of their motor performance when the questionnaire is animated and scalable than motionless and predefined. This observation was an important achievement for us, because this system was specifically designed to make the self-rated evaluation more straightforward and accurate. In addition, subjects’ comments are very promising regarding the use of the tool in the field. The fact that the application could be easily integrated in the routine of the targeted audience is a fundamental aspect of this project. In particular, patients stated that the interface could be a useful support to facilitate the communication between caregivers and themselves, which is quantitatively confirmed by the quite high score in the usability test. This positive appreciation is also shared by the health professionals, who watched a demonstration of the system. Actually, this visuo-dynamic self-assessment interface is a module that the physicians involved in the project are expecting to see implemented in the e-ESPOIRS-Handi platform, very soon. To put into practice these expectations we are working on the modelling of several other human activities. We are recording actors who are performing daily actions with different levels of disabilities. When a significant number of activities will be modelled and simulated through a 3D animated stickman, the resulting visuo-dynamic interface of each action will be integrated into the e-ESPOIRS-Handi Web platform [18]. In order to boost the expansion of the daily activities database, we also intend to provide the professional users with a record option, which will enhance the storage of additional movements performed by patients. This process will be facilitated by the low-cost approach and high versatility setup of the proposed motion capture method.
One of the main challenge of this work was to design a system for disabled people that does not cause a “technological burnout”, which is one of the main fears expressed by sick people. Considering the result of the usability test we can conclude that this risk seems to be avoided. The easy appropriation of the interface by patients is a fact we intend to replicate in other health fields. Although this project focuses on the requests to promote the self-evaluation of physical disabilities, it also tackles the general requirements to ensure an empowerment of disabled people. Therefore, this paper can be considered as a case study that demonstrates the fundaments of a collaborative work between computer scientists and health professionals in order to improve the management of the situations of disability. We believe that the tool developed here will be a helpful support to identify the real needs of disabled people and to enhance a crucial communication between the several stakeholders involved in the caregiving network [42, 43]. Before concluding, it is important to mention that the tool is designed for motor impaired people and may need additional assistance (e.g., aid from a relative) if the user suffers cognitive disorders, too. Nevertheless, the TPE is not limited to the motor disabilities and can also be applied to the mental impairments [8]. Our collaborative work with health professionals to better understand the appropriation processes of assistive technologies will be pursued in order to promote patient empowerment [44].
Footnotes
Acknowledgments
SUS was developed as part of the usability engineering programme in integrated office systems development at Digital Equipment Co. Ltd., Reading, UK.
Conflict of interest
None to report.