
Abstract
BACKGROUND:
Drivers with Multiple Sclerosis (MS) experience visual-cognitive impairment that impact on-road driving performance.
OBJECTIVE:
This study examines the feasibility of utilizing visual-cognitive and driving simulator assessments to indicate driving performance deficits (operational, tactical, and strategic maneuvers) in drivers with MS.
METHODS:
Through an evidence-informed feasibility framework, we evaluated recruitment capability and resulting sample characteristics, data collection procedures and outcome measures, participants’ acceptability and suitability of the driving simulator, the resources and ability to implement the study, and clinical and driving simulator assessment results.
RESULTS:
Thirty-eight persons with MS (median age
CONCLUSIONS:
Study findings identified challenges (missing data, simulator sickness), but established feasibility for executing a full-scale study to predict driving simulator performance in drivers with MS.
Keywords

Introduction
Drivers with Multiple Sclerosis (MS) experience visual-cognitive impairment that may compromise their fitness to drive [1]. Fitness to drive is determined via a comprehensive driving evaluation, with clinical and on-road driving assessments [2]. However, the comprehensive driving evaluation may be restrictive for some medically at-risk drivers, as it may be expensive, inaccessible, and may pose a crash risk during the on-road assessment, which can occur in real-world traffic conditions. Driving simulators offer a safe and secure assessment of driving performance for medically at-risk drivers [3]. Accordingly, a need exists to examine whether driving simulators can be used to indicate the underlying driving performance impairments of drivers with MS and inform decisions about a person’s fitness to drive.
Based on the extant literature, little congruency exists for which clinical tests indicate deficits in on-road and driving simulator outcomes in drivers with MS [1]. On-road studies show that impairment in binocular visual acuity, attention, information processing (visual), executive functioning, and visuospatial ability indicate failing outcomes [4, 5, 6, 7, 8, 9, 10, 11]. The driving errors that predict pass/fail outcomes include adjustment to stimuli errors (operational, tactical) and strategic errors in suburban/urban environments [9, 12, 13]. Conversely, driving simulator studies show that impairment in information processing (auditory) and divided attention indicate adjustment to stimuli errors (operational) of highway drives with secondary attention tasks in drivers with MS, as compared to those without MS [14, 15, 16, 17, 18]. Overall, these findings make it difficult to understand whether the evidence-based visual-cognitive indicators of on-road outcomes can indicate driving simulator outcomes in drivers with MS. As driving simulator studies mostly report on operational maneuvers of highway drives [14], it is difficult to understand whether driving simulators can be utilized to assess tactical and strategic maneuvers in suburban and urban environments – the maneuvers and environments previously shown to indicate failing an on-road assessment [9, 12, 13].
Based on prior on-road study findings [8, 9, 10, 12, 13], this study examined the feasibility of utilizing visual-cognitive and driving simulator assessments to indicate deficits in operational, tactical, and strategic driving maneuvers in drivers with and without MS. Feasibility was examined via using an evidence-informed framework, developed by Orsmond and Cohn who synthesized research studies on feasibility and developed a conceptual framework with five objectives to inform the guidance and development of future interventions [19]. Our study did not include an intervention but addressed the foundational components of feasibility through evaluating: 1) recruitment capability and resulting sample characteristics; 2) data collection procedures and outcome measures; 3) acceptability and suitability of the driving simulator; 4) resources and ability to implement the study; and 5) clinical and driving assessment results [19].
Examining the study’s feasibility provided information pertaining to: recruiting eligible participants with similar demographic characteristics to the MS population-based sample within the planned timeframe; the adequacy of data collection procedures and outcome measures; participants’ perceptions toward using the driving simulator and whether the onset of simulator sickness affected completing the simulated scenarios; obtaining the resources and ability to conduct the study successfully as per the protocol; and preliminary results that identified potential clinical indicators of driving performance in drivers with MS. Study findings that confirm feasibility will lay the foundation for executing a full-scale study to quantify the clinical tests that predict driving performance. Understanding if driving performance deficits that contribute to on-road outcomes can be detected on a driving simulator is important for making decisions about one’s driving performance.
Methods
The study’s methods, procedures, and participants’ demographic findings are documented in publications examining predictors of driving simulator performance in drivers with MS [20, 21].
Participants
From January 2019 to February 2020, we recruited participants 18 to 59 years with a valid graduated driver’s license via advertising in the London (Ontario) MS Clinic, Western University, MS Society of Canada’s Research Portal, social media sites (i.e., Facebook), network sites (i.e., Kijiji, Craigslist), and online editions of local newspapers. Inclusion criteria ensured that participants met Ontario’s legal vision standards to drive (i.e., corrected/uncorrected, far-sighted binocular visual acuity of at least 20/50 and binocular horizontal field of view of at least 120 degrees continuous) [22], and those with MS had a physician-verified diagnosis [23] and low to moderate physical disability (Expanded Disability Status Scale [EDSS] score
Study protocol
Participants attended one in-person visit at Western University’s i-Mobile Driving Research Lab. Upon obtaining written informed consent and screening participants to confirm eligibility, participants completed a demographic and medical intake form [27], Driver Behaviour Questionnaire [28], and a clinical assessment of visual and cognitive ability [29, 30, 31, 32, 33], administered by the trained research student.
Clinical assessment
The OPTEC
We selected the visual and cognitive tests for this study, as they previously indicated deficits in on-road outcomes in drivers with MS [8, 9, 10]. Notably, losses in far-sighted binocular visual acuity correlated with adjustment to stimuli errors (
Driving simulator assessment
After the clinical assessment, participants completed a driving assessment on the CDS 200 Simulator (DriveSafety Inc., Murray, Utah), administered by the trained research student. As displayed in Fig. 1, the computer desktop simulator had a fixed-based platform, three 19-inch LCD screens that covered 110-degrees horizontal field of view, and driver controls including a steering wheel, signal indicators, accelerator/brake pedals, and rear and side view wide-angle mirrors.
CDS 200 Simulator by DriveSafety, Inc. (https://drivesafety.com). Note. This figure is reprinted with permission.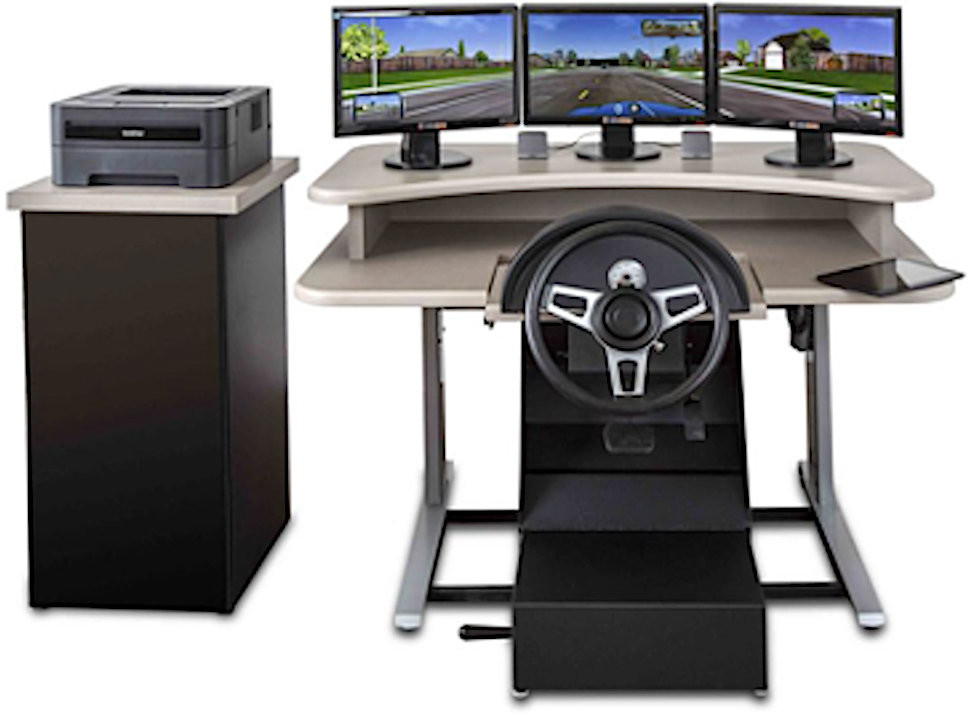
Description of Events in Driving Simulator Assessment by DriveSafety, Inc. (https://drivesafety.com). Note. This figure is adapted and printed with permission. The descriptions in the figure are documented in prior studies examining the predictors of driving simulator performance in drivers with MS [20, 21].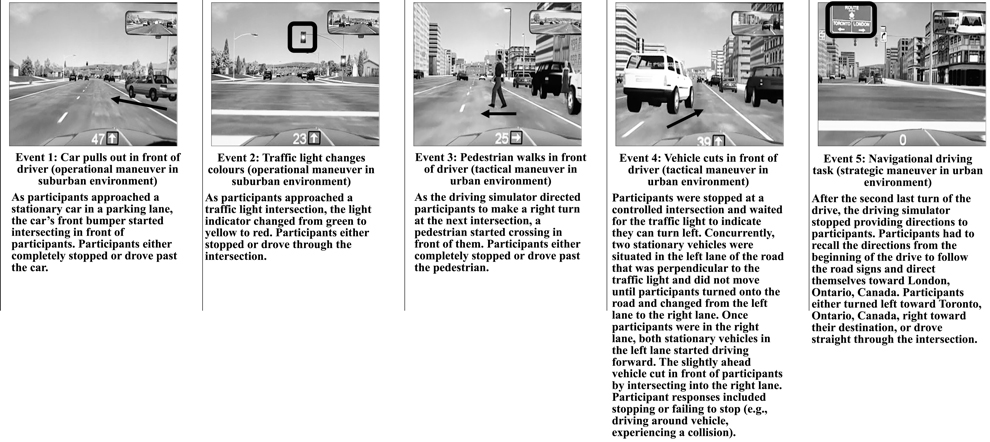
The driving assessment included a protocol to mitigate symptoms of simulator sickness [34, 35]. We asked participants to refrain from alcohol, caffeine, high-fat, or any mind-altering substance intake 24 hours preceding the study visit. The simulator lab had an exclusive air conditioning unit with a room temperature of 72 degrees Fahrenheit (22 degrees Celsius), a tower fan to ensure consistent air flow throughout the room, and dim light settings to reduce glare from the simulator’s screen monitors. The research student calibrated and adjusted the simulator’s driver controls to meet participants’ anthropometric measures. Participants reported measures of simulator sickness (Modified Motion Sickness Assessment Questionnaire, i.e., 0–10, not at all to severely for sweaty, queasy, dizzy, nauseous) at baseline, before and after each drive [34]. A cut-point
Participants completed two pre-driving exercises to practice operating and controlling the driver controls and three adaptation drives to practice driving up to 50 kilometres per hour (31 miles per hour), stopping, and turning left/right on residential, suburban, or urban roads with other road users [36]. Participants completed a driving scenario, previously developed, refined, and validated to detect adjustment to stimuli errors and visual scanning errors of youth drivers [36]. The driving scenario took 10 minutes to maneuver, with pre-recorded auditory cues, through 12 intersections, four left turns, three right turns, four hazardous events and a navigational driving task, when driving 40–60 kilometres per hour (25–37 miles per hour) [36]. Figure 2 provides a detailed description of the operational, tactical, and strategic driving maneuvers and environments of hazardous events and the navigational driving task.
Based on Michon’s hierarchical model of driving behavior, operational maneuvers required automatic and habitual physical abilities to respond to the environment (e.g., pressing foot pedals in response to traffic signs) [37]. Tactical maneuvers required intermittent problem-solving and decision-making to navigate through the environment (e.g., judging the time/space required to overtake road users) [37]. Strategic maneuvers required higher-level reasoning, decision-making, and problem-solving to navigate a route beforehand or when driving, while considering traffic laws, flow of traffic, and the risks and challenges in the environment [37].
We selected this scenario to assess participants’ adjustment to stimuli (operational, tactical) and strategic driving maneuvers during the events, as adjustment to stimuli errors in suburban (OR
2.2.2.1 Driving outcomes
We quantified participants’ adjustment to stimuli (operational, tactical) via reaction time, in seconds from when the event started until initial accelerator/brake pedal contact; response time, in seconds from when the event started until participants either completely stopped or drove past the road user/object (e.g., pedestrian); mean speed, in meters per second from when the event started until participants completely stopped or drove past the road user/object; and response type, categorized as participants who stopped, failed to stop, or experienced a collision. If participants experienced a collision, the driving scenario stopped until the research student advanced the scenario so participants could proceed with the drive after the collision. We quantified participants’ strategic maneuvers via a correct decision (i.e., turned toward London, Ontario, Canada) or incorrect decision (i.e., turned left toward Toronto, Ontario, Canada or drove straight through the intersection). The DriveSafety
2.2.2.2 Video recordings
To optimize data collection, we video-recorded participants’ driving scenario with two Logitech C922 Pro Stream cameras. The cameras recorded high-definition videos with 1080 pixels at 30 frames per second. One camera was located behind the driver to record the driving scenario on the simulator’s monitor screens, while the other camera was located on the simulator’s middle monitor screen to record the driver’s eyes and face. We used Logitech Capture software to simultaneously video record the driving scenario (e.g., entire screen) with participants’ eyes and face (e.g., bottom left screen) as one mp4 file. Video recordings were stored as mp4 files on a password protected and encrypted folder on the i-Mobile Driving Research Lab’s computer drive. We viewed each participant’s video recordings once to verify the data collected on the driving simulator testing form and the metrics collected by the driving simulator. For example, the video recordings verified participants’ response type (i.e., stopped vs. failed to stop) or the occurrence of collisions (i.e., collided vs. did not collide) in each event and the navigational driving task decision (i.e., correct vs. incorrect).
To understand whether participants would accept or intend to use a driving simulator to assess their driving performance, we asked them to complete the Perceived Usefulness and Ease of Use Questionnaire [38] and the System Usability Scale [39]. The Perceived Usefulness and Ease of Use Questionnaire included 12 questions (1–7, strongly disagree to strongly agree) about the driving simulator’s usefulness and usability [38]. The System Usability Scale included 10 questions (1–5, strongly disagree to strongly agree) about the driving simulator’s usefulness and satisfaction [39].
Data analysis
Data analyses were performed with SPSS Statistics 26 (IBM Corporation, 2019), using two-sided tests with a significance level
Sample characteristics (
59)
Sample characteristics (
Note. MS
Objective 1: Recruitment capability and resulting sample characteristics
Out of 180 individuals (84 with MS, 96 without MS) who expressed interest in the study, 38 individuals with MS (95% of recruitment goal) and 21 individuals without MS (105% of recruitment goal) participated. Participants were recruited via the London (Ontario) MS Clinic (33 with MS, 3 without MS), Western University (4 with MS, 18 without MS), and the MS Society of Canada’s Research Portal (1 with MS). Of individuals who declined participating, most did not provide a reason (26 with MS, 17 without MS). For those who provided reasons, eleven individuals with MS said it was too much of a time commitment, nine individuals (5 with MS, 4 without MS) declined due to the study location, and three individuals (1 with MS, 2 without MS) did not agree or follow through with the study requirements (e.g., did not attend study visit). For individuals who were excluded from the study, 49 individuals without MS inquired about taking part after recruitment was complete, and six individuals did not meet the inclusion criteria: two individuals with MS and two individuals without MS had medical diagnoses, one individual with MS took medication that could have affected cognition or driving ability, and one individual without MS did not meet the age criterion. We did not exclude any participants once they enrolled in the study.
Table 1 summarizes the demographic and clinical characteristics of participants with and without MS. As documented in prior studies [20, 21], participants with MS, compared to those without MS, took significantly more medications. In the MS group, 35 participants had relapsing MS (92%; ages 22–58, 24 female) and 3 had progressive MS (8%; ages 47–58, 2 female) [20, 21]. Diagnosis occurred a median of 8 years preceding the study (IQR
Participant Responses on the Perceived Usefulness and Ease of Use Questionnaire (
54) and the System Usability Scale (
53)
Participant Responses on the Perceived Usefulness and Ease of Use Questionnaire (
Note. MS
All participants completed the clinical and driving simulator assessment; however, up to seventeen (28.8%) participants had missing data on the simulator. Reasons for missing data included: participants missing the landmark to trigger event 1 to occur (11 with MS, 4 without MS); the driving simulator not loading the driving scenario (1 with MS) or event 4 to occur (3 with MS); and experiencing symptoms of simulator sickness (1 with MS, 1 without MS). Furthermore, five participants with MS did not complete the Perceived Usefulness and Ease of Use Questionnaire and System Usability Scale because they completed the study before we added the questionnaires to the study protocol. When testing the participants, we observed different driving performance responses to events (e.g., stopped, failed to stop, collision), including the onset of simulator sickness. Accordingly, we added both questionnaires into the study protocol to examine participants’ intention to undergoing a driving simulator assessment. Lastly, one participant with MS did not complete the System Usability Scale during the study visit.
Objective 3: Acceptability and suitability of the driving simulator
Table 2 presents participants’ responses on the Perceived Usefulness and Ease of Use Questionnaire and System Usability Scale. On the Perceived Usefulness and Ease of Use Questionnaire, participants agreed the most on statements about the driving simulator being easy to interact with or use (e.g., item 12, median response
Participant Responses on the Modified Motion Sickness Assessment Questionnaire
Participant Responses on the Modified Motion Sickness Assessment Questionnaire
Note. MS
Computing the percentage of participants who reported symptoms of simulator sickness on the Modified Motion Sickness Assessment Questionnaire (i.e., cut point
For participants with MS, correlations between reported symptoms of simulator sickness and demographic or clinical characteristics indicated that females (vs. males,
This objective determined if the study had the resources to conduct the study successfully as per the protocol. We covered all fees (e.g., participant compensation, $1,475 CAD) through undesignated funds, and cost-share of faculty time. The research team already had all the screening and assessment administration manuals, assessment forms, software, and equipment needed to conduct the study. Without these resources, the study would not have been possible to conduct without securing funding.
Recruiting participants involved setting up collaborations with the London MS Clinic and the MS Society of Canada. Other recruitment methods involved using the University’s poster distribution services for eight months to post recruitment advertisements around campus for a fee of $170 CAD. On a monthly basis, we requested to post recruitment advertisements via online networks (i.e., Craigslist, Kijiji). Participants’ study visit took a median of 120 minutes to complete the entire study protocol (IQR
Objective 5: Clinical and driving simulator assessment results
Table 4 summarizes the driving simulator maneuvers in participants with and without MS. Participants with MS, compared to those without MS, made more adjustment to stimuli errors (tactical) via a significantly slower response time in the pedestrian event (i.e., event 3) and more collided with the vehicle that cut across the lane (i.e., event 4). Experiencing a collision (yes/no) in event 4 did not significantly impact whether a correct/incorrect decision was made in the navigational driving task (i.e., strategic driving maneuver; Fisher’s exact
Driving simulator maneuvers (
59)
Driving simulator maneuvers (
Note. MS
For participants with MS, correlations between clinical test scores and driving simulator maneuvers showed that a slower divided attention correlated with slower response time (
This study examined the feasibility of utilizing visual-cognitive and driving simulator assessments to indicate driving performance in drivers with and without MS.
Objective 1: Recruitment capability and resulting sample characteristics
As we reached 95% of our proposed recruitment goal for participants with MS, meeting the proposed sample size (
Objective 2: Data collection procedures and outcome measures
The missing data during the driving simulator scenario might have been mitigated via pilot-testing the drive multiple times prior to data collection. Furthermore, collaborating with simulator industry partners about the process of triggering hazardous events to start might have minimized the number of bypassed events. However, such consultations are costly, especially given that the study had no external funding to offset the cost of specialty consultations. Nevertheless, we suggest four strategies to minimize missing data on a driving simulator: 1) pilot test the drives and driving performance measures to ensure proper functioning and data collection of the simulator; 2) ensure that computer programming occurs as to “hit” the landmark that cues hazardous events to start; 3) video record the main drives to supplement failure of the driving simulator to record such data; and 4) include additional practice drives with turns so that participants become more accustomed to turning with the restricted field of view on this simulator (e.g., half the screen, 55 out of the 110-degree horizontal field of view) as compared to real-world driving (e.g., 180-degree horizontal field of view and 135-degrees vertical field of view when stationary) [43].
Objective 3: Acceptability and suitability of the driving simulator
Participants’ acceptability toward the driving simulator suggested that those with and without MS perceived the driving simulator as easy to use, but they would not intend to use a driving simulator in their daily lives. In the literature, one study by Lamargue-Hamel et al. reported that participants with MS rated a driving simulator assessment as pleasant (0–5, very unpleasant to very pleasant; mean score
Consistent with findings in prior driving simulator studies [14, 17, 44], participants’ suitability toward the driving simulator showed that some participants with MS experienced symptoms of simulator sickness. For example, in Lamargue-Hamel et al., five of 30 participants with MS (17%) experienced motion sickness during a driving simulator assessment [17]. In Akinwuntan et al. six of 42 participants with relapsing MS (14%) discontinued a simulated training program in the first simulator familiarization session and continued as control participants due to experiencing simulator sickness [44]. Overall, the prior and our study’s findings indicate that some drivers with MS may experience symptoms of simulator sickness that can affect completing a driving scenario during an assessment or intervention [14]. However, since these studies’ findings derive from one session on a driving simulator, more research is needed to determine the number of repeated sessions (if any) and period of expositions that are most suitable for drivers with MS.
Profiling participants who experienced and did not experience symptoms of simulator sickness showed that turns may indicate symptoms of simulator sickness (e.g., adaptation drives 2–3). While dizziness did not significantly differ between groups before the driving scenario, ratings increased after adaptation drive 2. These preliminary findings suggest that increasing dizziness and turns may contribute to experiencing increasing symptoms of simulator sickness (e.g., sweaty, queasy, dizzy, nausea).
The demographic and clinical characteristics that were correlated with increased dizziness while driving the simulator correspond with at least one of the underlying factors that contribute to the occurrence of simulator sickness (i.e., female sex) [45]. One reason for why individuals with MS may be more susceptible to experiencing simulator sickness is that MS is more prevalent in women than men, and some may experience vestibular instability [14, 46]. However, the occurrence of simulator sickness is under-reported in driving simulator studies for drivers with MS. Understanding the physiological mechanisms will be a plausible next step to develop mitigation protocols to reduce simulator sickness during driving assessment or intervention.
Objective 4: Resources and ability to implement the study
Though the available resources enabled us to conduct the study, some were not optimal for detecting the underlying driving performance impairments in drivers with MS. For instance, the navigational driving task in the driving scenario did not provide an adequate assessment of participants’ strategic driving maneuvers, which depend on high-level reasoning, planning, judging, or problem-solving. Optimizing the navigational driving task would have required an added expense, and as such, we chose to use an existing driving scenario with a strategic maneuver component – but not to the extent required to make a targeted assessment.
Objective 5: Clinical and driving simulator assessment results
Preliminary results showed that participants with MS (vs. without MS) made more adjustment to stimuli errors (tactical) via taking longer to respond to the pedestrian who walked in front of them, or by not responding in enough time to the vehicle that cut across the lane in front of them and experiencing a collision. These findings suggest that tactical maneuvers may target driving performance deficits in drivers with MS which is consistent with prior on-road studies [12, 13], and builds on prior driving simulator studies which mostly show that adjustment to stimuli errors (operational) target driving performance [14, 15, 16, 17, 18].
As deficits in immediate verbal/auditory recall, slower divided attention, and slower selective attention correlated with deficits in adjustment to stimuli (i.e., operational, tactical) or strategic maneuvers, the CVLT2-IR, UFOV2, and/or UFOV3 may be useful for identifying drivers with these driving performance issues. Accordingly, we considered immediate verbal/auditory recall and divided/selective attention as predictors of driving performance in a follow up study [21].
Limitations
Study findings may only be generalized to individuals who meet the sample’s characteristics for individuals with and without MS (e.g., selection bias, spectrum bias) [20, 21]. While screening criteria ensured that severe fatigue would not be a confounding factor of driving performance in drivers with MS, we did not assess for whether fatigue severity changed throughout the study visit; though participants took breaks whenever they felt necessary. Although driving simulators can be used to assess operational and tactical driving maneuvers, the pre-existing driving scenario [36] used in this study did not allow us to perform an adequate or comprehensive assessment of gap acceptance or strategic driving maneuvers for drivers with MS. In this study, more drivers with MS than without MS experienced a collision on the driving simulator. Consistent with prior studies [14, 16, 18], these findings show that drivers with MS (and without MS) can experience collisions during driving simulator scenarios. However, since the absolute validity of driving simulators cannot yet be inferred, the occurrence of simulated collisions cannot be directly related to on-road collisions. The missing data during the driving simulator assessment may have underestimated actual results (e.g., type II error). However, due to the exploratory nature of this study, we did not correct for multiple comparisons (e.g., type I error).
Strengths
The research team consisted of multidisciplinary professionals with expertise in driver rehabilitation science, biostatistics, MS, neurology, occupational therapy, driving simulation, and transportation engineering. Though we knew participants’ diagnoses and clinical test scores, the kinematic data obtained on the driving simulator ensured the collection of objective data. Furthermore, video-recording the driving scenario and documenting driving outcomes on the standardized assessment form [36] enabled us to cross-reference metrics obtained by the driving simulator and those observed from the drive.
Implications
Future research
As the acceptability toward a driving simulator is not fully understood in drivers with MS [14], research that focuses on acceptability may help identify factors that influence participants’ perceptions on the usability, usefulness, practicality, and representativeness of driving simulators measuring driving performance. In addition to adjustment to stimuli maneuvers, gap acceptance and strategic driving maneuvers have been shown to predict failing an on-road assessment in drivers with MS [9, 12, 13]. However, gap acceptance maneuvers were not assessed in this study and the navigational driving task may not have adequately challenged the high-level reasoning, planning, judging, or problem-solving of drivers with MS. Developing and validating scenarios that adequately and comprehensively assess gap acceptance and strategic driving maneuvers for drivers with MS may provide insight to demographic, clinical, and driving characteristics that impact driving performance.
Policymakers
Canada’s fitness to drive standards state that occupational therapists or other specialists with expertise in driver rehabilitation can use driving simulators to assess whether drivers can compensate for motor deficits [43]. Based on prior [14, 15, 16, 17, 18, 21] and our study’s findings, visual-cognitive impairments may be indicators of driving performance deficits. Policymakers may consider implementing the use of driving simulators to identify, assess, or monitor visual-cognitive deficits to help inform decisions about one’s fitness to drive.
Practitioners
Tracking participants’ acceptability of a driving simulator over time may help identify factors that influence their perceptions on whether the driving simulator is a representative, useful, and practical measure of driving performance. Likewise, tracking the occurrence of simulator sickness over time may help identify factors that impact simulator sickness. Clinical tests that measure immediate verbal/auditory recall and divided attention may be useful for screening driving performance deficits in drivers with MS. Assessing operational, tactical, and strategic driving maneuvers in all driving environments (i.e., residential, suburban, urban, and highway) may provide an overall picture of a person’s driving performance.
Conclusion
This study indicated the feasibility of utilizing clinical and driving simulator assessments to indicate driving performance deficits in drivers with and without MS. Overall, the lower than proposed recruitment rates highlighted the importance of ensuring feasible planning, realistic timelines, and using a variety of recruitment methods to reach recruitment goals and enhance the generalizability of study findings. The missing data on the driving simulator emphasized the importance of understanding its data collection procedures and outcome measures. Participants’ acceptability toward the driving simulator indicated that participants perceived the simulator as a useful driving performance assessment, but they would not use one in their daily lives. Participants’ suitability toward the driving simulator showed that some drivers experienced symptoms of simulator sickness that affected their ability to complete the assessment. Lastly, clinical and driving assessment results showed that deficits in immediate verbal/auditory recall and divided/selective attention may underlie driving performance deficits on a driving simulator. Clinical tests that predict driving performance deficits may be useful for informing driving performance decisions in drivers with MS.
Author contributions
CONCEPTION: Sherrilene Classen, Sarah A. Morrow and Sarah Krasniuk.
PERFORMANCE OF WORK: Sarah Krasniuk.
INTERPRETATION OR ANALYSIS OF DATA: Sherrilene Classen, Sarah A. Morrow and Sarah Krasniuk.
PREPARATION OF THE MANUSCRIPT: Sarah Krasniuk.
REVISION FOR IMPORTANT INTELLECTUAL CONTENT: Sherrilene Classen, Sarah A. Morrow and Sarah Krasniuk.
SUPERVISION: Sherrilene Classen and Sarah A. Morrow.
Ethical considerations
This study received ethics approval from Lawson’s Health Research Institute (R-18-631) and Western University’s Health Sciences Research Ethics Board (112525), and all procedures were performed in compliance with relevant laws and institutional guidelines. The study took place from January 2019 to February 2020. Participants consented in writing prior to taking part and received a $25 CAD gift card.
Footnotes
Acknowledgments
Western University’s i-Mobile Driving Research Lab, the London (Ontario) Multiple Sclerosis Clinic, and the University of Florida’s Institute for Mobility, Activity, and Participation Lab provided infrastructure and support to conduct this research study and to disseminate findings. This research did not receive any specific grant from funding agencies in the public, commercial, or not-for-profit sectors.
Conflict of interest
The authors have no conflicts of interest to report.