



Abstract
BACKGROUND:
Pressure injuries are an important health care issue. This problem is even more evident with patients with neurological conditions.
OBJECTIVE:
This study aims to develop an analytical tool to predict the magnitude of the maximum stresses developed at the wheelchair cushion-patient contact area.
METHOD:
Newton’s polynomial interpolation method was applied in order to obtain correlations between the maximum stress developed and the weight of the patient and the maximum pressure and body mass index (BMI) of the participants. For this study it was recruited five able-bodies and nine patients with spinal cord injury.
RESULTS:
The agreement between the computed stress values and those measured with the able-bodied group is excellent, but in the patients within the spinal cord injury group, the concordance is poor. The correlations were applied in data from Crawford’s study, and predictions of pressures show lack of agreement.
CONCLUSIONS:
Correlation between the weight of a person and the maximum stress developed by him or her while sitting for extended periods of time has been demonstrated. The lack of agreement between estimated and measured values in spinal cord injuries and Crawford’s data can be mainly attributed to some sort of neurological status.
Introduction
Pressure injuries are a health issue, especially for patients with neurological conditions, such as patients with spinal cord injuries, or elderly and fragile patients. The National Pressure Ulcer Advisory Panel (NPUAP) in 2016 [1] redefined the pressure injury as “localized damage to the skin and underlying soft tissue usually over a bony prominence or related to a medical or other device. The injury can present as intact skin or an open ulcer and may be painful. The injury occurs as a result of intense and/or prolonged pressure or pressure in combination with shear. The tolerance of soft tissue for pressure and shear may also be affected by microclimate, nutrition, perfusion, co-morbidities and condition of the soft tissue.”
It is recognized that pressure is the most intrinsic factor involved in the development of pressure injuries [2]. Pressure is the perpendicular force applied to a surface per unit area. When pressure is applied over a bony prominence, it distorts the skin and the underlying soft tissue [2] damaging the skin. As the pressure increases, the blood flow towards the soft tissue decreases, resulting in ischemia. If ischemia is short, the blood flow returns to normal levels [2]; however, continuous ischemia leads to tissue necrosis and further breakdown, which represents poor health and quality of life for the patient.
Additionally, every year, considerable resources are destined to the treatment of pressure injuries [3]. Depending on the severity and complications of the injury, the treatment may extend for some months or even years [4]. As an example, in Canada, $9000 CAD/month are spent in medical care for injuries in a community with high incidence of pressure injuries [5]. In the United States, the cost for hospital admission for pressure injuries treatment is around $130 000 dollars [5]. Between 1.30 and 3 million adults suffer pressure injuries [6]. In the United Kingdom, a 4% per year of the National Health Service Expenditure is invested in this issue [5].
Lyder [4] proposed programs aimed to prevent the development of pressure injuries by the increase of medical and nursing care; he suggested the prevention through systematic risk factor identification, skin assessment, patient, and the use of supported surfaces.
Regarding to supported surfaces, special mattresses and cushions have been developed. Ferguson-Pell [7] has defined a set of characteristics that cushions for people using a wheelchair must fulfill in order to dissipate those compressive forces (pressures) developed by sitting people. In such study, it is recognized that while sitting, the ischial tuberosities support the greatest fraction of body weight; in concordance with this, Bogie et al. [8] suggested that spinal cord injuries which are present in paraplegia are at high risk of developing pressure injuries over the ischial tuberosities.
Stinson et al. [9] recognized the usefulness of interface pressure maps as a preventing tool in the treatment of pressure injuries. They have concluded that special attention has to be taken in evaluating the maximum pressures developed at the ischio-gluteal area/cushion contact area, rather than just average pressure. Although the guidelines proposed by Ferguson-Pell [7] have been fulfilled up to different extents in different clinical practices, pressure injuries are still an important issue. In this paper, we propose an analytical tool to estimate the extent of pressure developed on patients after being seated on a wheelchair for different time periods. The data was gathered from volunteers at Instituto Nacional de Rehabilitación Luis Guillermo Ibarra Ibarra (INR LGII) in Mexico City. The aim of this tool is to provide new criteria for wheelchair cushion design.
Materials and methods
The study protocol was approved by the Institutional Ethical Committee and is in compliance with the Declaration of Helsinki. Informed consent was obtained from all of the participants in this study.
Volunteer groups
Two groups of subjects were recruited to measure the maximum pressure development at the cushion/ischio-gluteal area while they were seated for over 30 minutes in an INR wheelchair cushion [10].
Group One: it was made of five able-bodied subjects.
Group Two: it was formed by nine patients with spinal injury who attended the Spinal Injury Service at INR LGII; they did not have previous pressure injury and neither develop any pressure injury during the this study.
INR Wheelchair cushion
The INR wheelchair cushion was designed and manufactured at INR LGII [10]. It was made with commercial polyurethane foam (2.54 cm in thickness) supported on a rigid base of polypropylene (0.64 cm in thickness). The cushion was designed according to anthropometric measurements of the ischio-gluteal area of the members of group two.
Methods
The Force Sensing Array (FSA) (Vista Medical, Ltd., Winnipeg, Canada) system was used to register the interface pressure between the subjects and their surface. This system displays a numerical and topographical map of the pressures exerted at each point by means of an array of 16
Test protocol
In Tables 1 and 2, the demographic characteristics obtained from both volunteer groups are shown. For each volunteer, an INR wheelchair cushion was manufactured [10].
Anthropometric Characteristics of able-bodied group
Anthropometric Characteristics of able-bodied group
Anthropometric Characteristics of spinal cord injury group
The volunteers were seated on a wheelchair (Universal-24020000 Brad Everest & Jennings) as indicated in Fig. 1 and using the INR cushion according to the posture proposed by Eitzen [13]. The measurement of the interface pressure was carried out with the FSA
A) Force Sensing Array equipment; B) Subject position according to Eitzen [13].
Once the volunteers from both groups were seated, the maximum stress along with the average stress, were measured at the ischial tuberosities every 0.2 s. The data from individuals in Group One showed that there is no significant change in the readings, thus it was decided to only show maps obtained every 5 minutes. This is shown in Fig. 2. However, in constructing the weight and BMI correlation analysis all of the recorded data was used.
The numerical evaluation of the data gathered was conducted by means of Newton’s polynomial interpolation method in order to obtain correlations between the maximum stress developed and the weight of the patient and the maximum stress and body mass index (BMI) of the participants. The numerical method used in this work has been widely described and discussed elsewhere [14] . The weight, height and BMI for both groups were contrasted applying t-Student test, with
Results
In Tables 1 and 2, the anthropometric characteristics of both groups are shown. No significant difference was found to contrast weight (
Figure 3 shows a plot of the maximum stress developed by the different volunteers in Group One over time. In this figure, it is possible to see that the maximum stress developed by the different volunteers remained fairly constant over the recording time. Subject 4, who was the heaviest participant did not provide the largest stress, whereas subject 5, who was the second heaviest participant produced a smaller stress; thus, the effect of the contact area between the ischio-gluteal area and the cushion is clear in these results. With the data provided by these volunteers, it was possible to obtain a series of polynomials to predict the level of stress developed by individuals over a range of weight.
Maximum stress recorded during 30 minutes. The tendency of the stress data is similar to Crawford reported [12].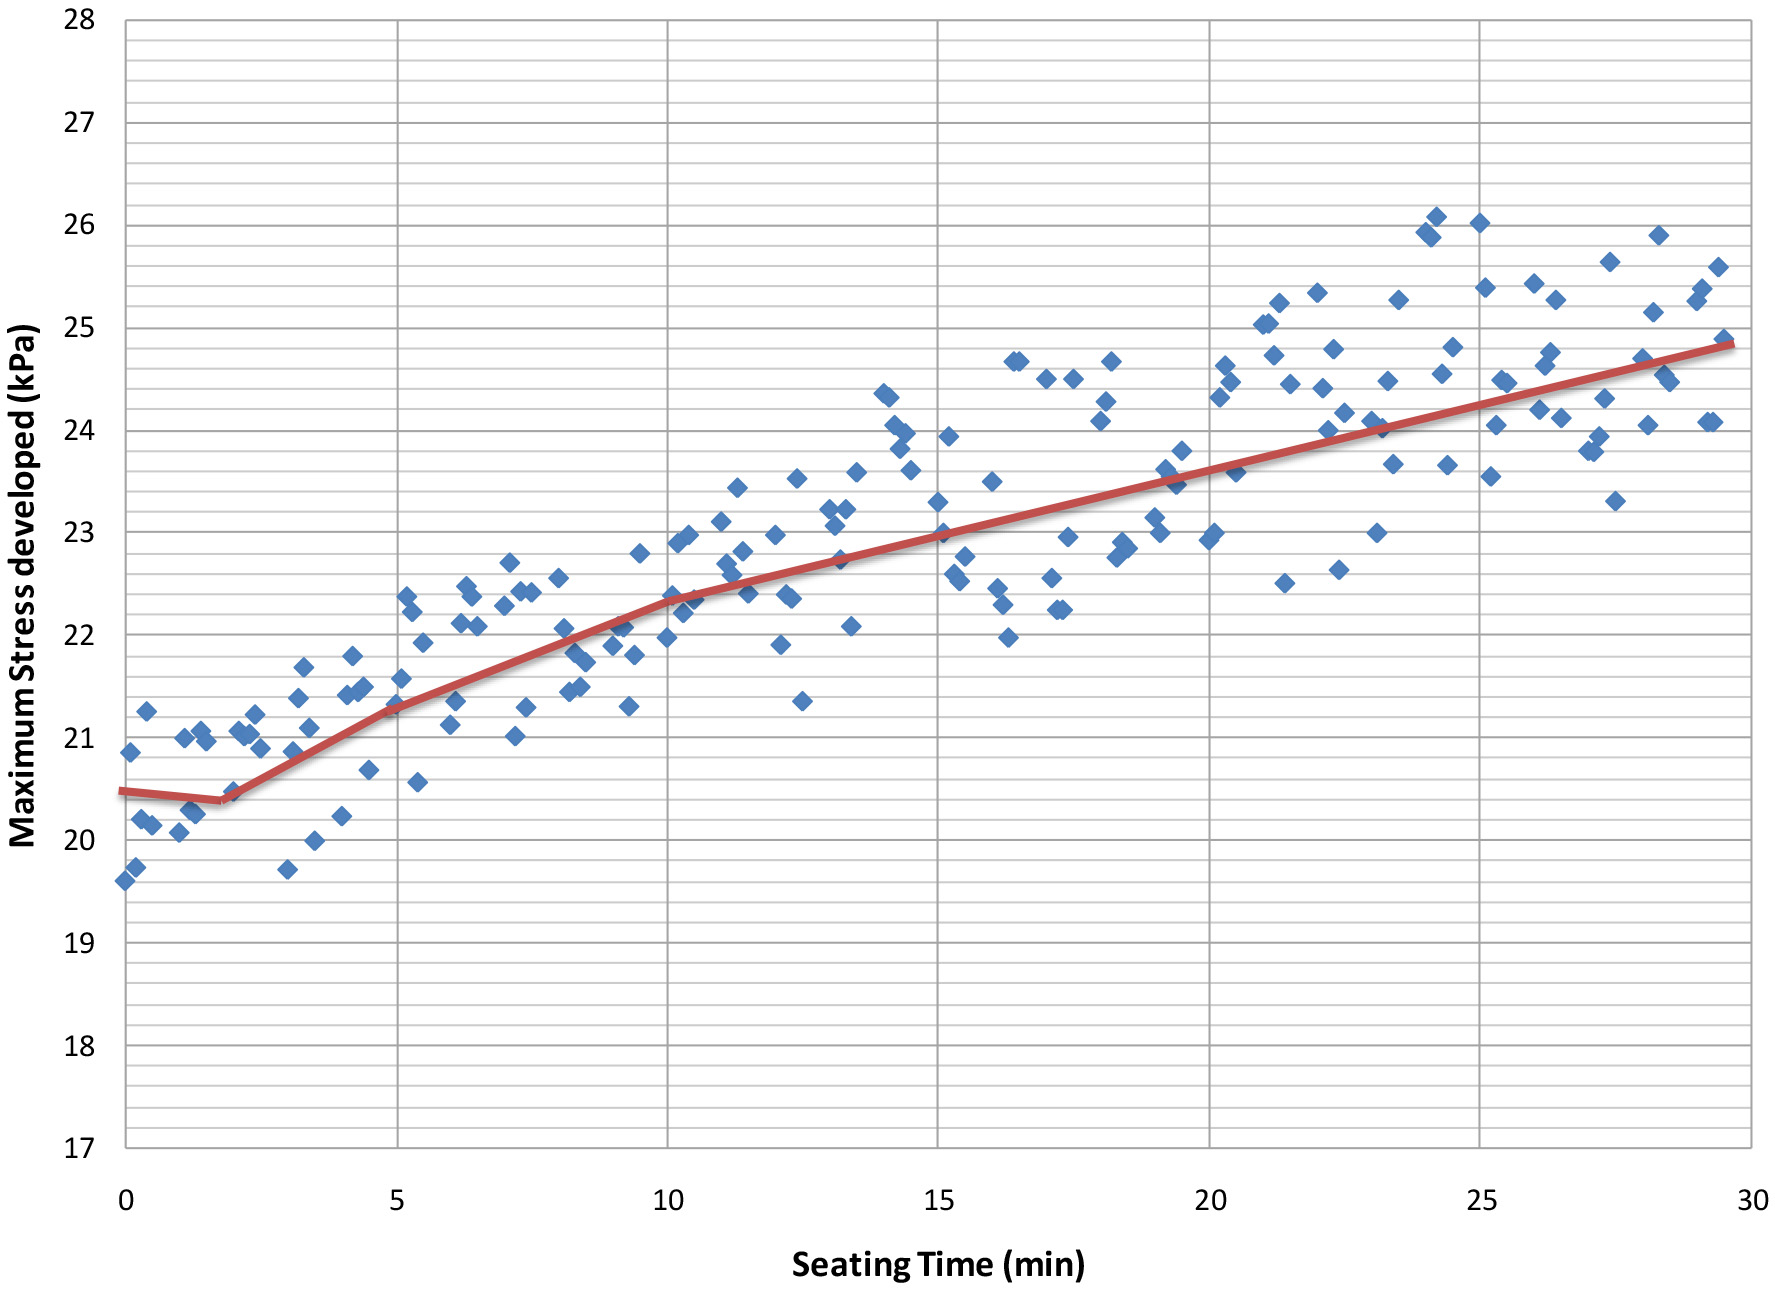
The polynomials obtained have the general form:
Where
Weight-Maximum Stress developed correlations obtained from experimental data
Figures 4A and B show the comparison between the measured stress and those predicted by the polynomials in Table 3. As seen in these figures, the good agreement among computed and actual values is clear. Some points show larger differences, due to the functionality found. The maximum difference between calculated and real values lies within 5%, which means that the set equations are able to reproduce accurately the experimental data.
Maximum stresses developed by able-bodied group as function of time.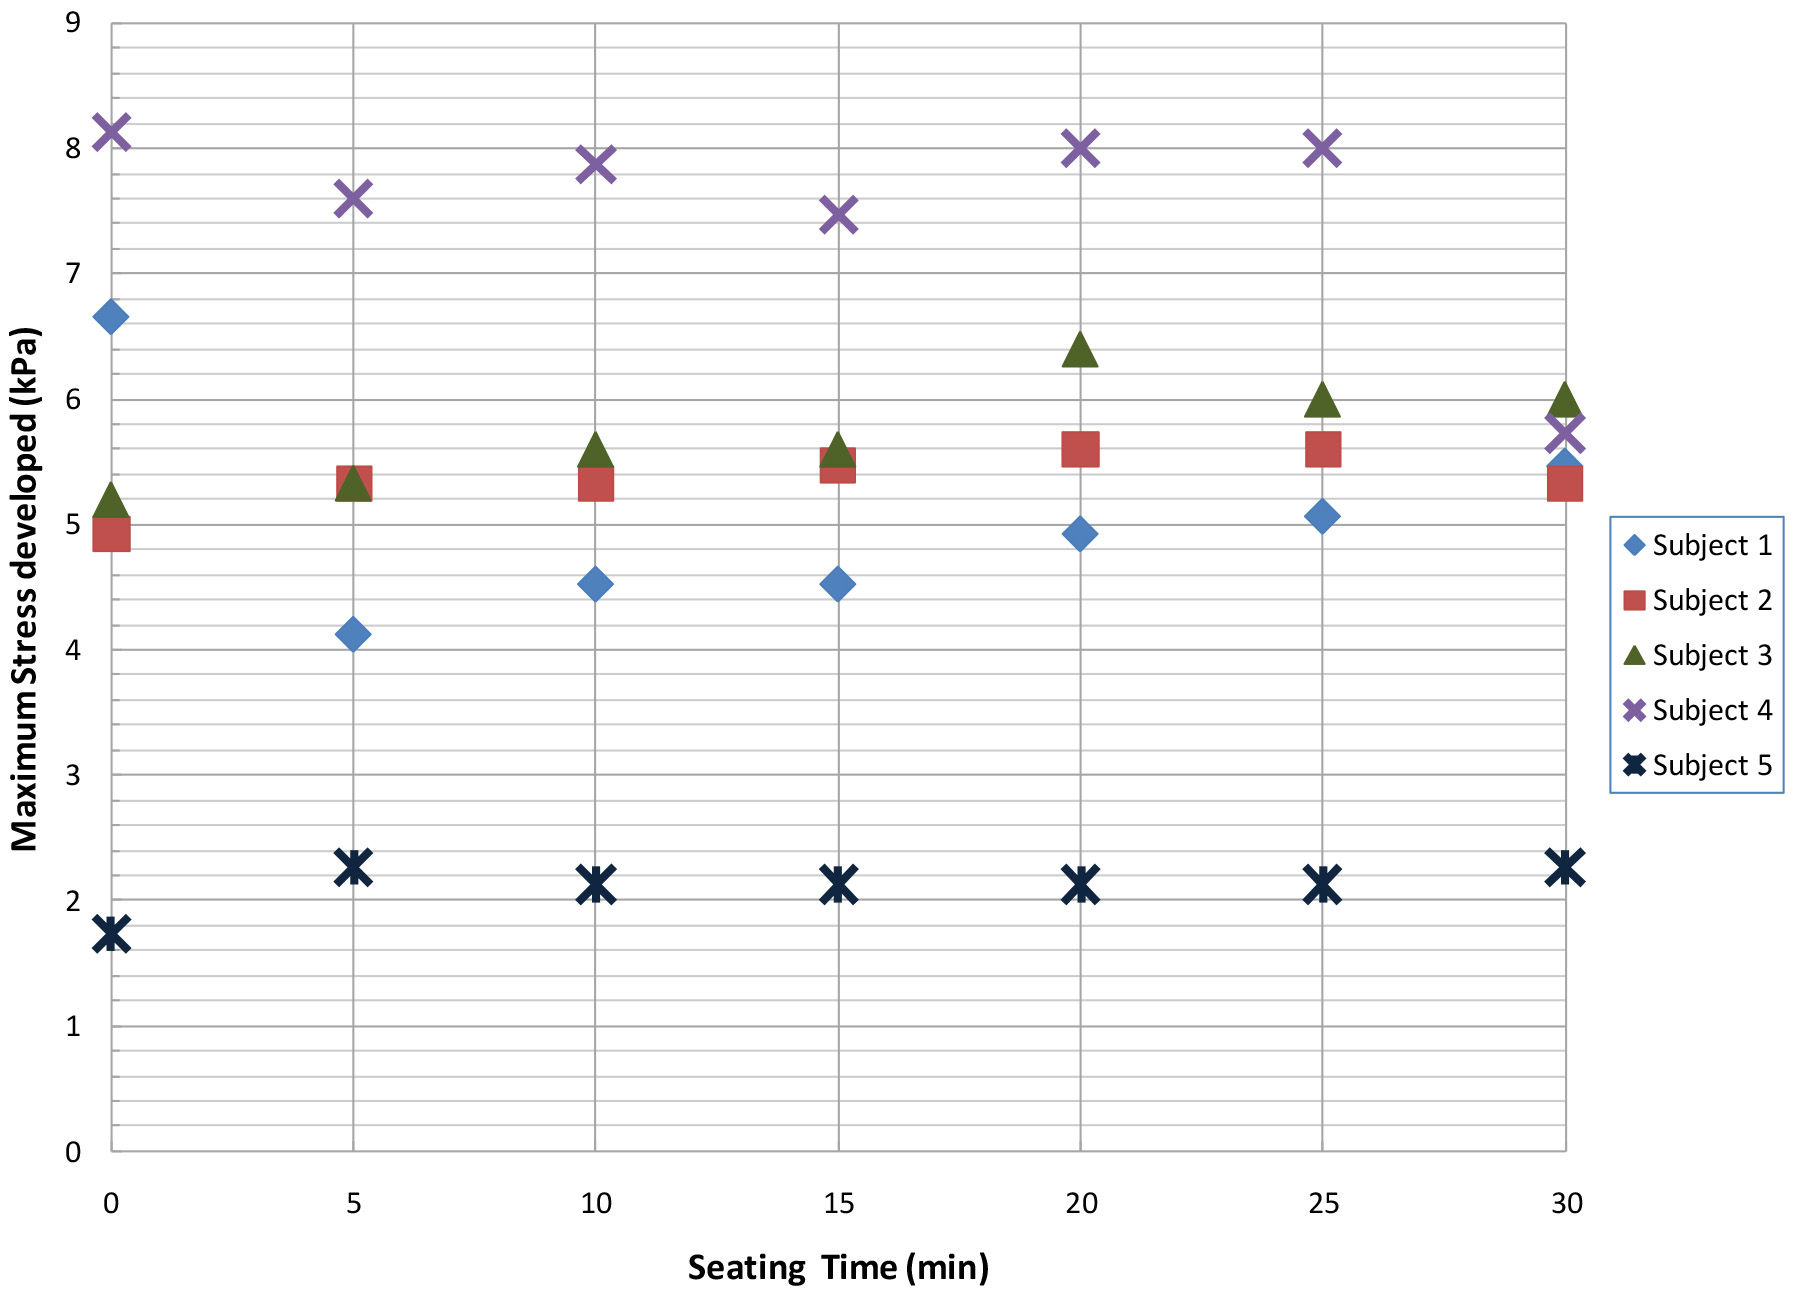
Additionally, similar correlations were obtained between the body mass index (BMI) and the maximum pressure reported for each participant:
BMI-Maximum Stress developed correlations obtained from experimental data
a) Comparison between estimated and measured stresses with weight-stress correlations for able-bodied subjects 1 and 5; b) Comparison between estimated and measured stresses with weight-stress correlations for able-bodied subjects 2 and 4.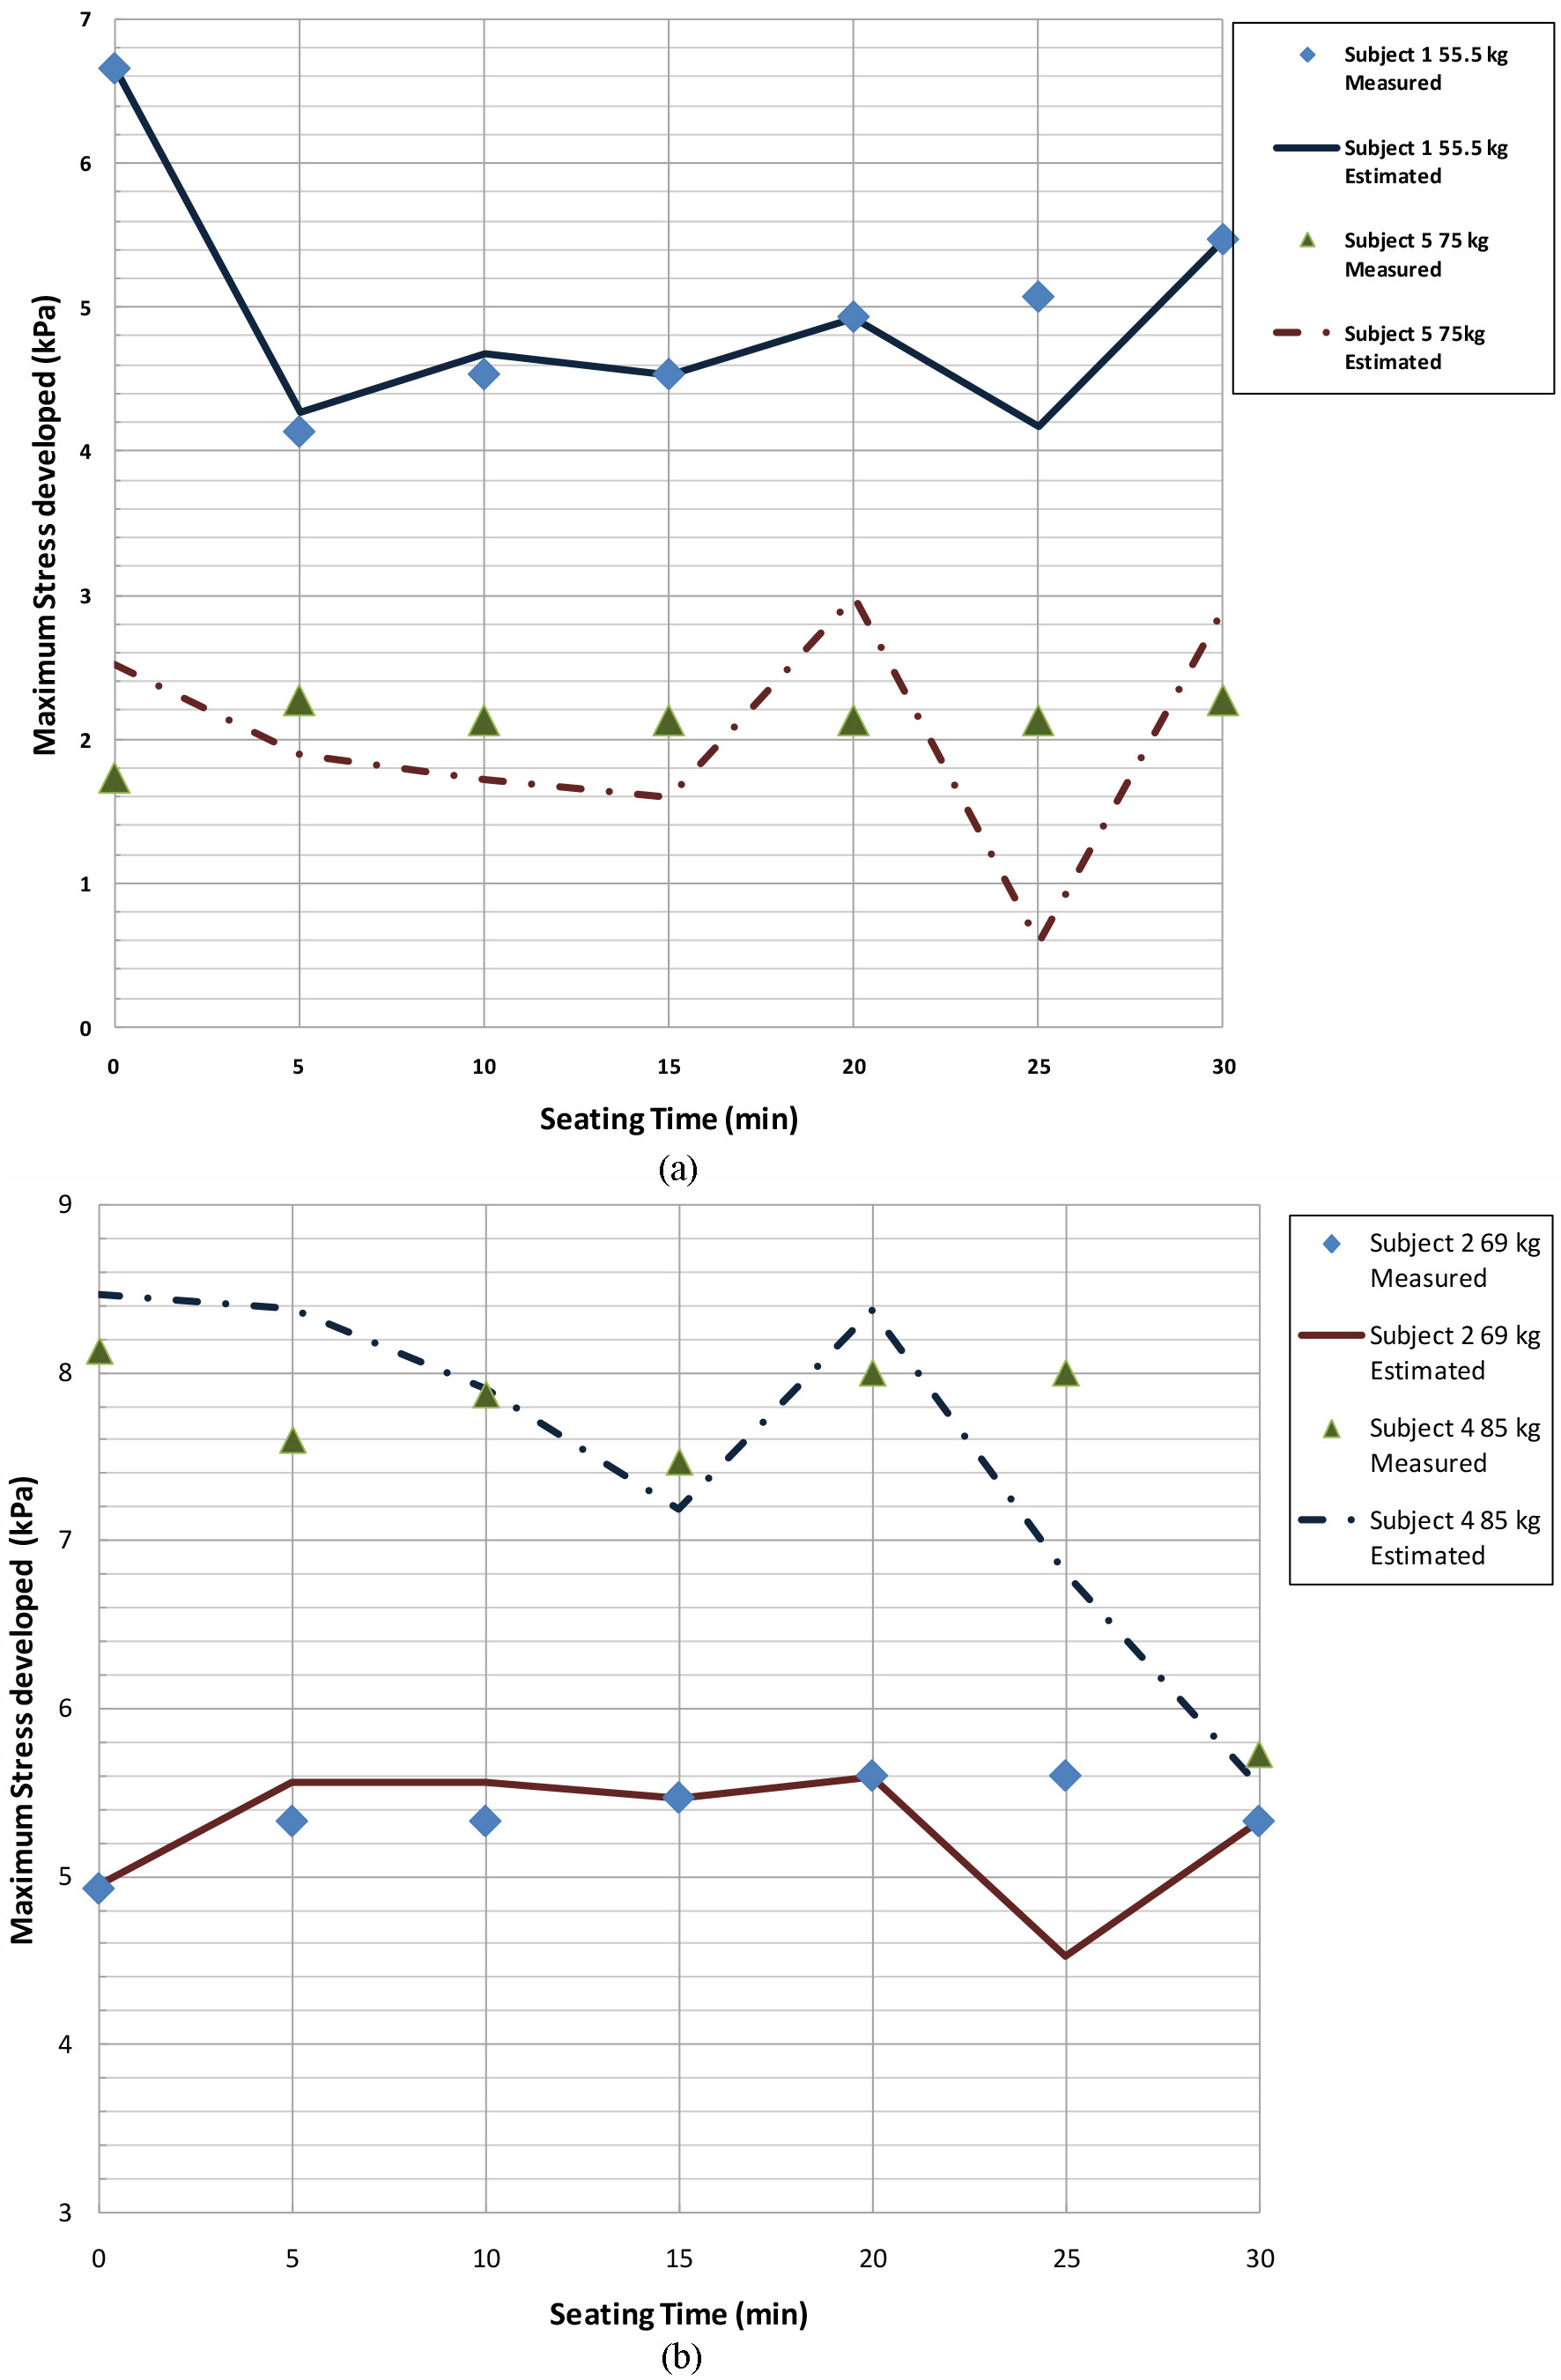
Where
Table 4 shows the different correlations for the body mass index and the maximum stresses recorded over time, whereas Fig. 5 shows the comparison between the experimental data and that obtained from correlations. This figure shows that there is excellent agreement between the BMI and the maximum stress developed in both our predictions and our measurements. Furthermore, the correlation between the BMI and the stresses developed is even more precise (less than 2%) than that developed for the weight and the maximum stress experienced.
The volunteers’ data revealed that subject 1 is the lightest participant and also has the smallest BMI value. On the other hand, the BMI does not relate the same way with heavier participants: for example, subject 4, who is the heaviest volunteer, has the third largest BMI at 25, whereas subject 5 is the participant with the highest BMI value at 30, but in terms of weight, is the second heaviest volunteer. Although the BMI involves the actual mass of the individual, it does not specify how the weight is distributed within the body. Therefore, it is evident that the patient’s weight – maximum pressure developed is the relationship that we ought to work with.
Figure 5 shows the poor concordance among the computed and measured maximum stresses for the group with spinal cord injuries.
Comparison between estimated and measured stresses with BMI-stress correlations for able-bodied subjects 1, 4, and 5.
The agreement between the computed stress values and those measured with the able-bodied group is excellent, but in the patients within the spinal cord injury group, the concordance is poor, which can be seen in Fig. 6.
The behavior of the group with spinal cord injury shows that this lack of agreement between the computed and measured data is due to the different spinal cord injuries levels exhibited by the patients. Given that the spinal injuries occur in different levels, it is difficult for most of the patients to have full trunk body control and correct pelvis orientation [15]. These features result in a poor sitting posture of the patients, which results in uneven weight distribution in the seats, thus developing stresses with higher magnitude than those exhibited by the able-bodied participants.
As already explained, this analytical work focuses solely in either the person’s weight or his or her BMI; such variables, although specific to each individual, do not account for body control. Likewise, physiological factors such as alterations in tissues composition, or in skin condition should be accounted for [2]. Furthermore, nutritional status also has some effect on the overall health of an injured person [2, 16]. These non-physical factors should be accounted for the posture experienced by the patients while sit for extended periods of time.
Additionally, Fig. 6 shows that there is no obvious relationship between the weight of the spinal cord injured patients and the maximum stresses developed by them, i.e. it is expected that, as the weight of the patient increases, so does the magnitude of the stresses developed. The latter is not particularly true, given the anthropomorphic characteristics of the different patients.
It must be mentioned here that participant 6 has not been included in this discussion because his weight (98 kg) is over the upper limit used (85 kg) in developing our correlations.
The predictions of stresses show a similar lack of agreement with Crawford’s data [12] as with ours. It can be seen in Fig. 7 that our predicted stresses lie below those recorded by Crawford. Crawford used in order to record the data, the Force Sensing Array, with the same features as we used for our study [12].
In such figure, the maximum stresses developed at time zero while using different cushions for each one of the participants are plotted. In our analysis with Crawford’s data, we have not used the measurements in cushions made with materials other than polymer foams or related ones; additionally we have eliminated subjects 4 and 15 in Crawford’s participants, because their weight is below the defined lower limit (55 kg) to obtain our correlations.
Anthropometric Characteristics of volunteer recruited by Crawford [12]
Anthropometric Characteristics of volunteer recruited by Crawford [12]
Comparison between estimated and measured stresses using the weight-stress correlation. The comparison is made in the subjects with spinal cord injury.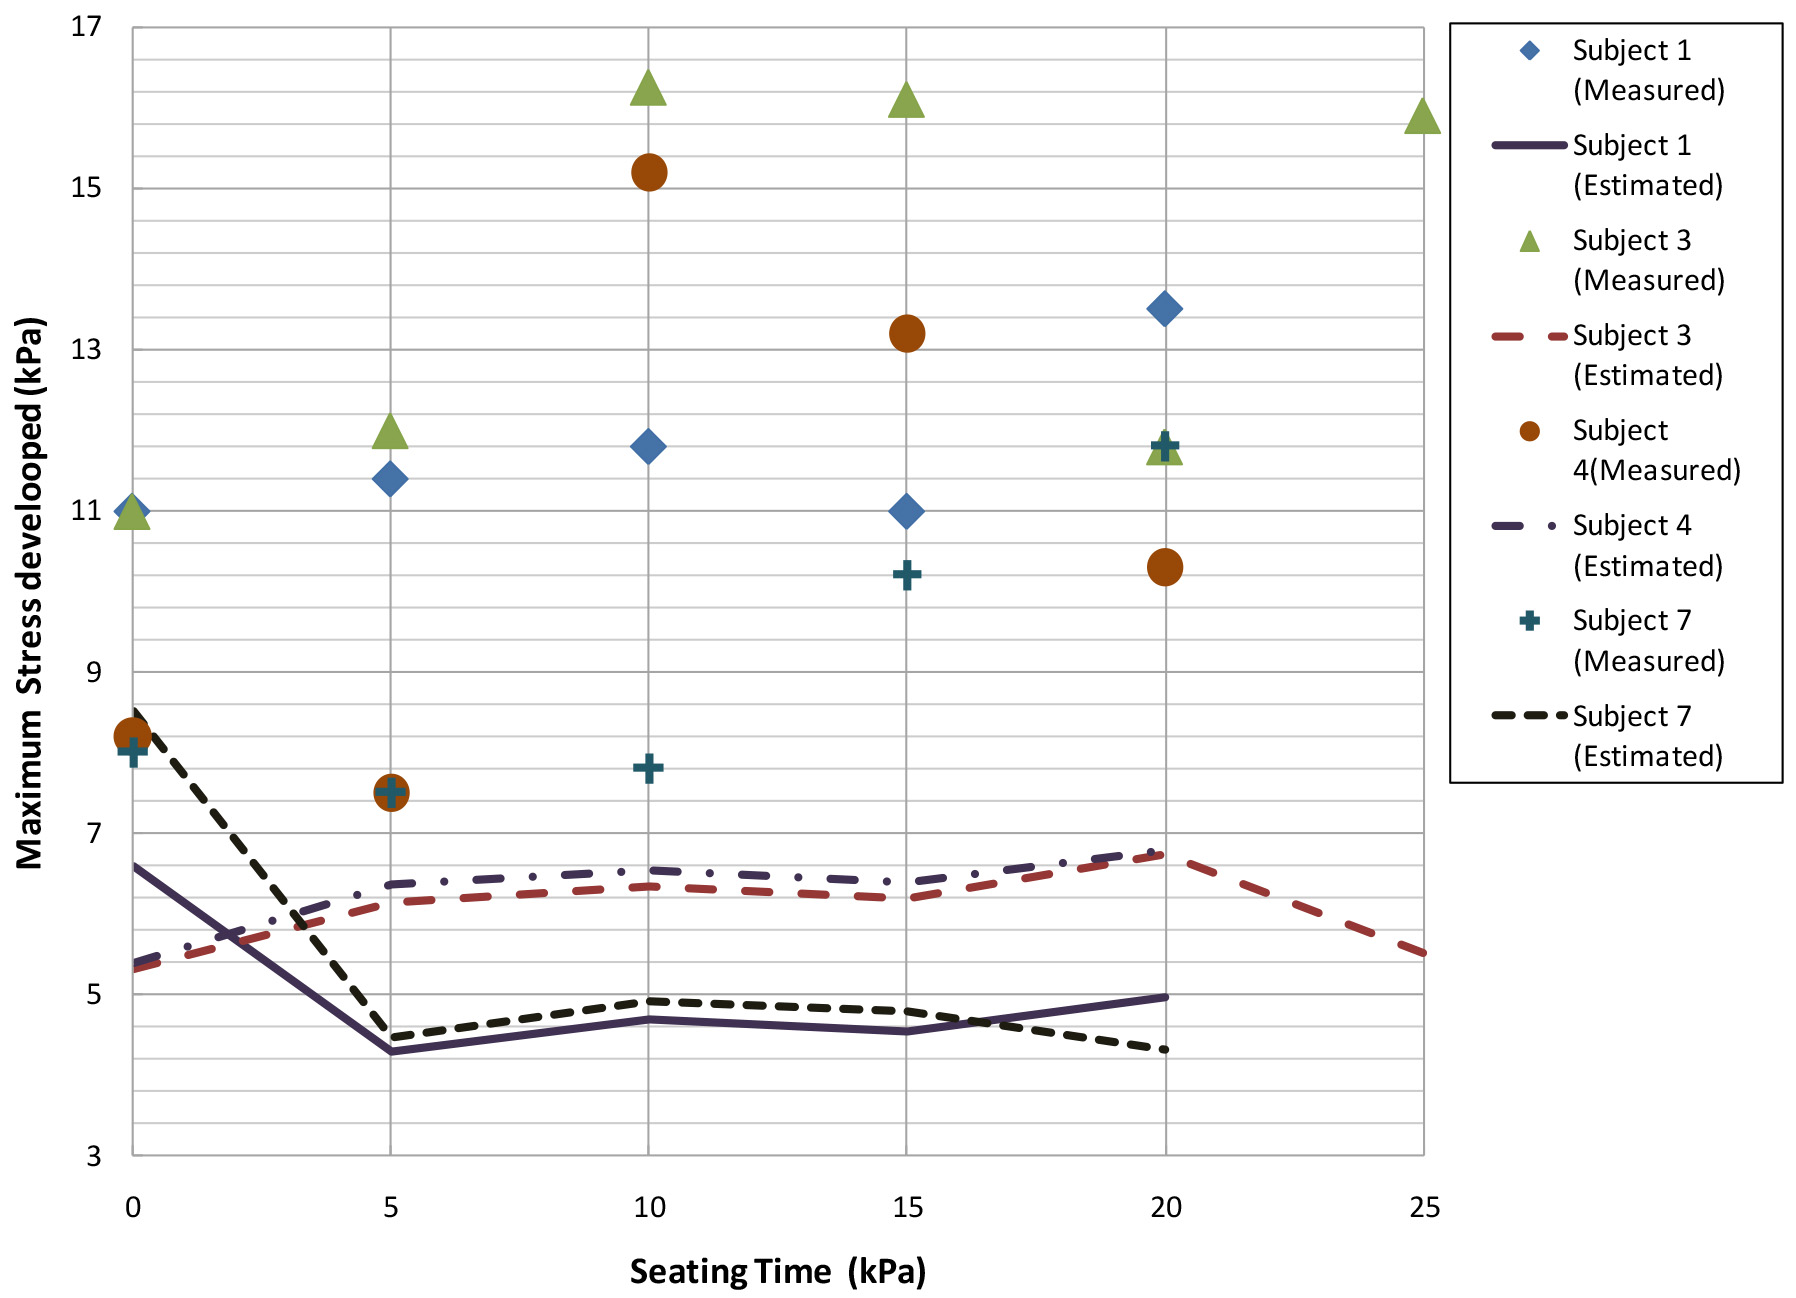
As with our own data, we can argue that the lack of agreement between estimated and measured values can be mainly attributed to some sort of neurological status by Crawford’s subjects (Table 5). In the case analyzed, the sample studied by Crawford does not present any spinal cord injury, but the subjects in this research are wheelchair users with multiple sclerosis.
Comparison between estimated and experimental data from Crawford using the weight-stress correlation. The comparison is made in subjects with multiple sclerosis.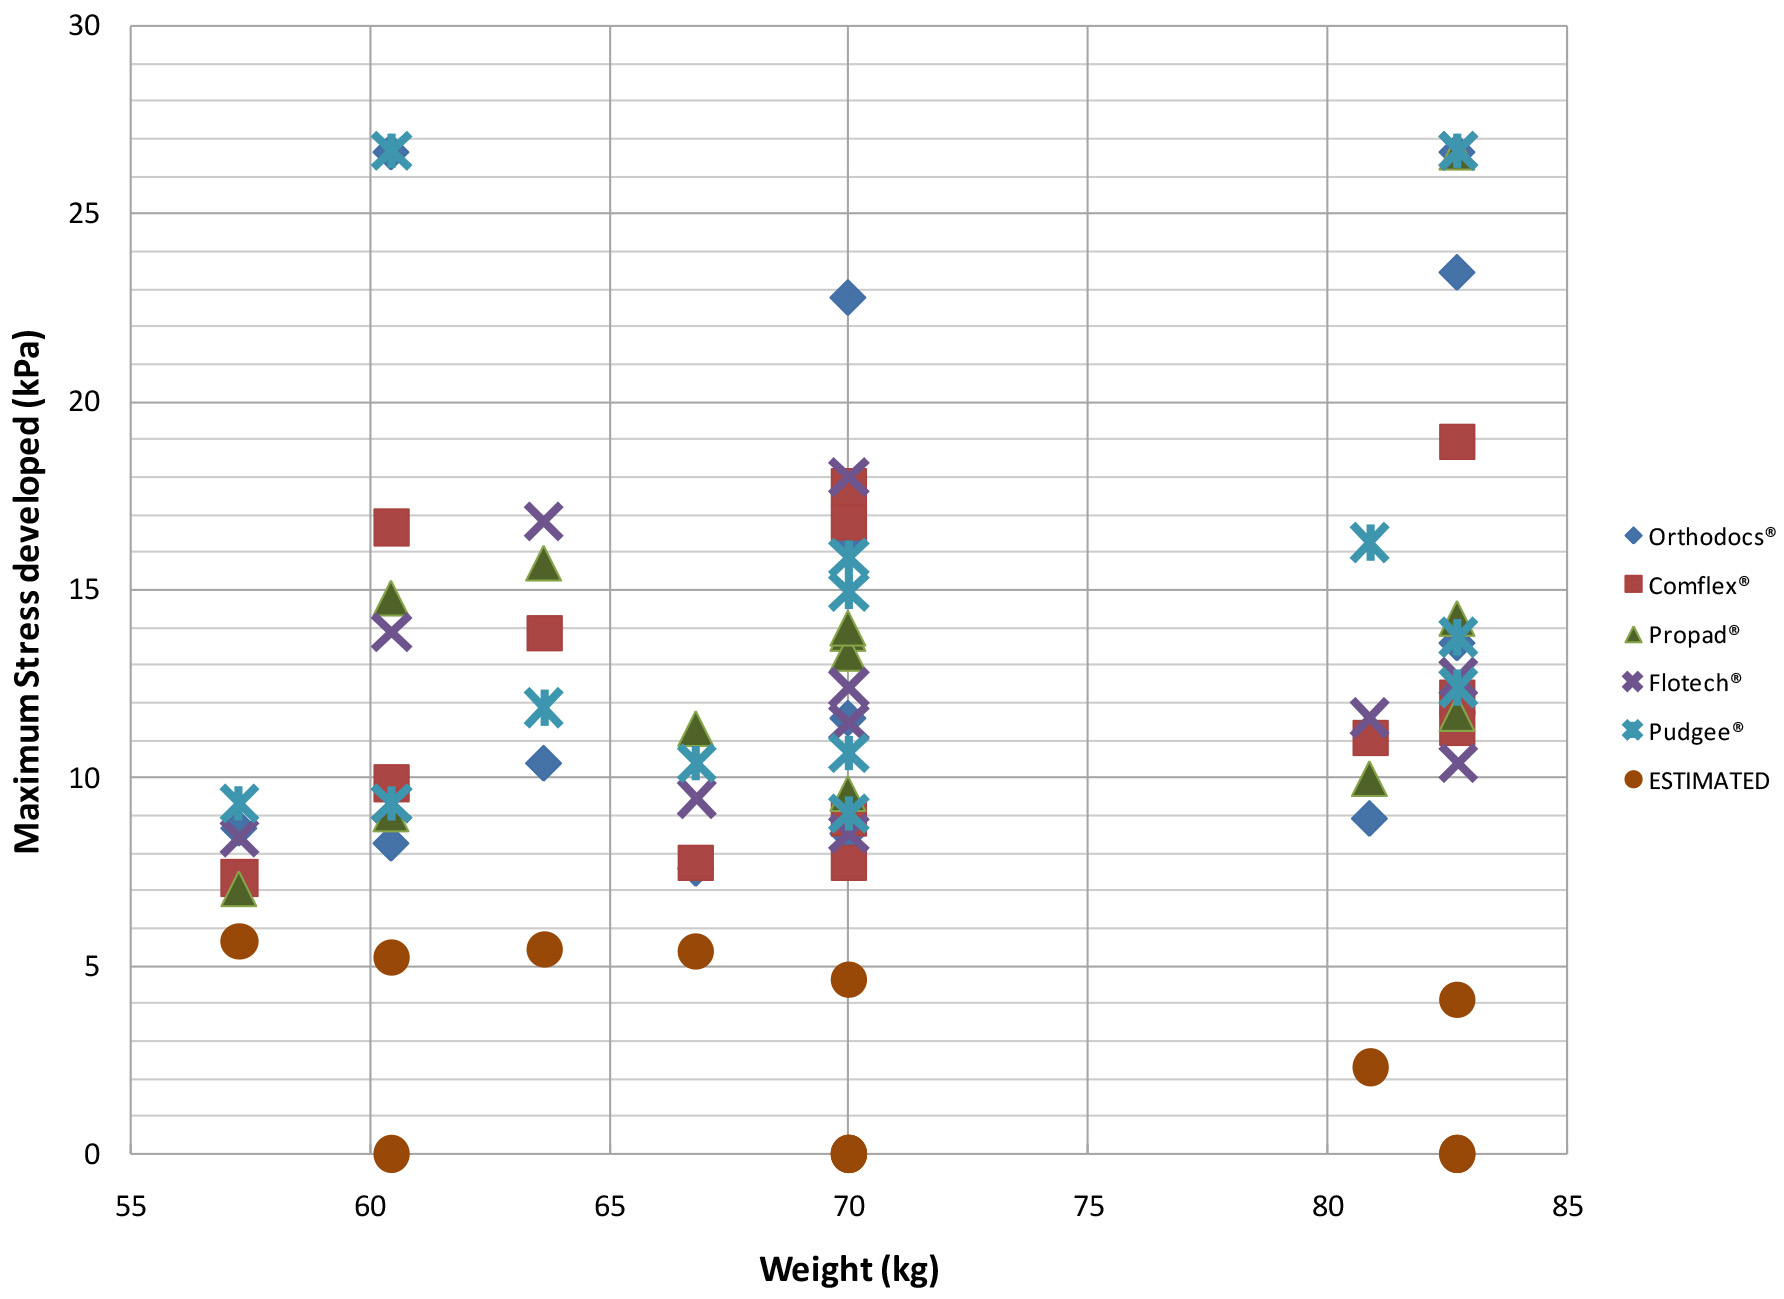
Another factor to gauge in the poor agreement among data is the type of polymers used in the manufacturing of the seats. These polymers are quite different in their chemical formulation and, additionally, some of the cushions combine polymers with gels, so the mechanical response from these cushions change quite significantly even for the same user, which is evident from the data plotted in Fig. 7. Nonetheless, and in spite of the disagreement shown by the correlations and the experimental data gathered, the model still shows similar trends than those exhibited by the different measurements reported.
To improve the accuracy of the predicted stresses with respect of the measured values, it is necessary to add the type of spinal cord injury and other factors inherent to patients to our model as variables, so better correlations can be expected. Unfortunately, the latter is difficult to accomplish, given the nature of the different levels of cord injuries, as well as the anthropometric characteristics of each individual.
However a factor of 1.2 to 1.5 can be added to our correlations to give better stress predictions; unfortunately such factors can be explained in terms of data adjustment, and the addition of physical meaning to such factors is still needed.
A correlation between the weight of a person and the maximum stress developed by him or her while sitting for extended periods of time has been demonstrated. The correlation was obtained from data gathered with a group of able-bodied subjects and then used to verify its accuracy in a group of patients with different levels of spinal cord injury. The exactness of the data obtained between estimated and measured pressure values was not completely satisfactory. We also tested our correlations with experimental data independently collected and found out the same trend as with our own data. The lack of agreement between calculated and measured values is credited to the neurological conditions of patients with any type of spinal cord injury. Further work is needed to implement limited body control and other physiological and nutritional conditions in our numerical model.
However, regardless the poor accuracy in our stress predictions, the predicted stresses follow the same trend exhibited by the actual measurements. It will be a useful analytic tool to estimate the stress behavior in the soft tissue underlying to bony prominences, because in a computational model developed by Araujo-Monsalvo et al. [17], the results suggested that the stress inside the soft tissue underlying bony prominences is 4.54 or 6.26 times greater than the interface pressure measured in cushion/subject.
Conflict of interest
None declared.
Footnotes
Acknowledgments
The authors would like to express their gratitude to National Council of Science and Technology (CONACYT, by its Spanish acronym) for funding project number “CONACyT-SALUD-2009-1-115219”; CIITEC–IPN and Universidad Iberoamericana. The authors would also like to thank Prof. Porter-Armstrong from the University of Ulster for providing a copy of Dr. Crawford’s Ph. D. dissertation.