



Abstract
BACKGROUND:
Speech disorders such as dysphonia and dysarthria represent an early and common manifestation of Parkinson’s disease. Class prediction is an essential task in automatic speech treatment, particularly in the Parkinson’s disease case. Many classification experiments have been performed which focus on the automatic detection of Parkinson’s disease patients from healthy speakers but results are still not optimistic. A major problem in accomplishing this task is high dimensionality of speech data.
OBJECTIVE:
In this work, the potential of Principal Component Analysis (PCA) based modeling in dimensionality reduction is taken into consideration as the data smoothening tool with multiclass target expression data.
METHODS:
On the basis of suggested PCA-based modeling, the power of class prediction using logistic regression (LR) and C5.0 in numeric data is investigated in publicly available Parkinson’s disease dataset Silverman voice treatment (LSVT) to develop an advanced classification model.
RESULTS:
The main advantage of our model is the effective reduction of the number of factors from
CONCLUSIONS:
Our combined dimension reduction and data smoothening approaches have significant potential to minimize the number of features and increase the classification accuracy and then automatically classify subjects into Parkinson’s disease patients or healthy speakers.
Introduction
Parkinson’s disease (PD) is a neurodegenerative disorder characterized by muscular rigidity, tremor, bradykinesia and postural instability. During the course of the disease, patients with PD will develop voice and speech impairments including dysarthric speech, reduced loudness and loss of articulation which leads to a negative impact on functional communication and quality of life [1, 2, 3, 4]. These difficulties processing speech include deficits estimating the time intervals of an acoustic speech signal, altered emotional prosody and difficulty perceiving the individual’s own loudness. In other words, individuals with PD articulate imprecise consonants, particularly those used phonetically for the closure of phrases, have impaired prosody or natural variations in pitch, as well as impaired intensity and rhythm during spontaneous speech production [5]. According to Herd et al. [6] patients with Parkinson’s disease also suffer from difficulties in language selection, language understanding, coordination and dual tasks (talking and walking) as well as emotional intent and understanding. However, the neural mechanisms underlying these voice and speech disorders remain unclear. Recently, Dias and colleagues [7] reported that global motor disability and speech articulation impairment do not correlate with age at onset of PD symptoms or age of the patients at evaluation. According to Orozco-Arroyave et al. [8] it is possible to automatically classify between speech of people with PD and healthy controls (HC) with accuracies ranging from 84% to 99% in three languages: German, Spanish and Czech. In English native speakers the reported accuracy is 91% [9]. Bocklet et al. [10] considered a set of 176 German speakers (88 patients with PD and 88 HC) and performed the automatic detection of PD including acoustic, prosodic and voice related features. The accuracy reported in this work was 94%. Significant improvements in motor functions of patients with PD have been shown with the use of medical therapies and surgery procedures, however, data on their effects on speech production performance are inconsistent and overall success remains unclear [11]. The Lee Silverman Voice Treatment (LSVT
In recent years, scientific data has the tendency of growing in both size and complexity. The high dimensionality of modern massive datasets has provided a considerable challenge to efficient algorithmic solutions design [18]. Dimension reduction is a subject of study in several research areas including high-dimensional data analysis, pattern classification, medical data processing, machine learning, and data mining applications. It’s the process of reducing the random number of variables under consideration. Dimension reduction techniques aim at finding the meaningful low dimensional data structures hidden in their high-dimensional observations which allow the user to better analyze the complex data sets in an interpretable way, such that most of the information in the data is preserved [19, 20]. Feature extraction and feature selection are two popular methods for dimension reduction that play important role in the medical data interpretation and application.
The feature selection process can be considered a problem of global combinatorial optimization in machine learning, which reduces the number of features from the original features, removes irrelevant, noisy and redundant data according to a certain criterion and results in higher classification accuracy [21]. Therefore, a good feature selection method is needed in order to speed up the processing rate, predictive accuracy, and to avoid incomprehensibility. Feature selection algorithms are separated into three categories; filter (extract features from the data without any learning involved), wrapper (use learning techniques to evaluate which features are useful) and hybrid (combine the feature selection step and the classifier construction) approaches [22, 23].
Feature extraction is a process that extracts a set of new features from the original features through some functional mapping with the mean goal to reduce dimensionality by linear [e.g. the Principal Component Analysis (PCA), linear discriminant analysis (LDA)] or non-linear methods [e.g. Kernel PCA and Kernel LDA], and hence improving the quality of data and the performance of data mining algorithms. LDA and PCA are the two popular independent feature extraction methods. Both of them extract features by projecting the original parameter vectors into a new feature space through a linear transformation matrix. But they optimize the transformation matrix with different intentions [24]. In recent years, machine learning techniques have been of great interest in disease classification, detection of irregularities and increase of medical decision-making objectivity. Interestingly, various research papers have attempted to build predictive telediagnosis and telemonitoring models for diagnosing Parkinson’s disease (PD) [25], especially for speech disorders considered as one of the most common problems in patients with PD [26, 27, 28, 29, 9]. Artificial intelligence continues to play an important role in healthcare informatics while researchers are working to solve many new problems in the big data era of healthcare [30].
The aim of this paper is to study the potential of dimensionality reduction in speech pattern analysis of a publicly available LSVT (Silverman voice treatment) Voice Rehabilitation DataSet in order to investigate prediction accuracy in the context of class prediction using the PCA. In this optic, a supervised feature selection process identifying the most significant feature was performed using Pearson’s correlation, followed by an independent stratified 10-fold cross validation and linear PCA. After dimension reduction, the class prediction was made by Logistic Regression and C5.0 algorithm.
The applied features extraction and the modeling approaches may be sensitive to gender. For this reason, it is important to try and understand the possible relationships between gender and dimension reduction for speech treatment issues.
LSVT voice rehabilitation data set informations
LSVT voice rehabilitation data set informations
Dataset
The dataset is composed of a range of biomedical speech signal processing algorithms from 14 people who have been diagnosed with Parkinson’s disease undergoing the program assisting voice rehabilitation LSVT [31]. Table 1 shows the mean characteristics of the dataset. The 14 PD subjects (8 males and 6 females), had an age range of 51 to 69 (mean
A dimensionality reduction framework for speech treatment in PD.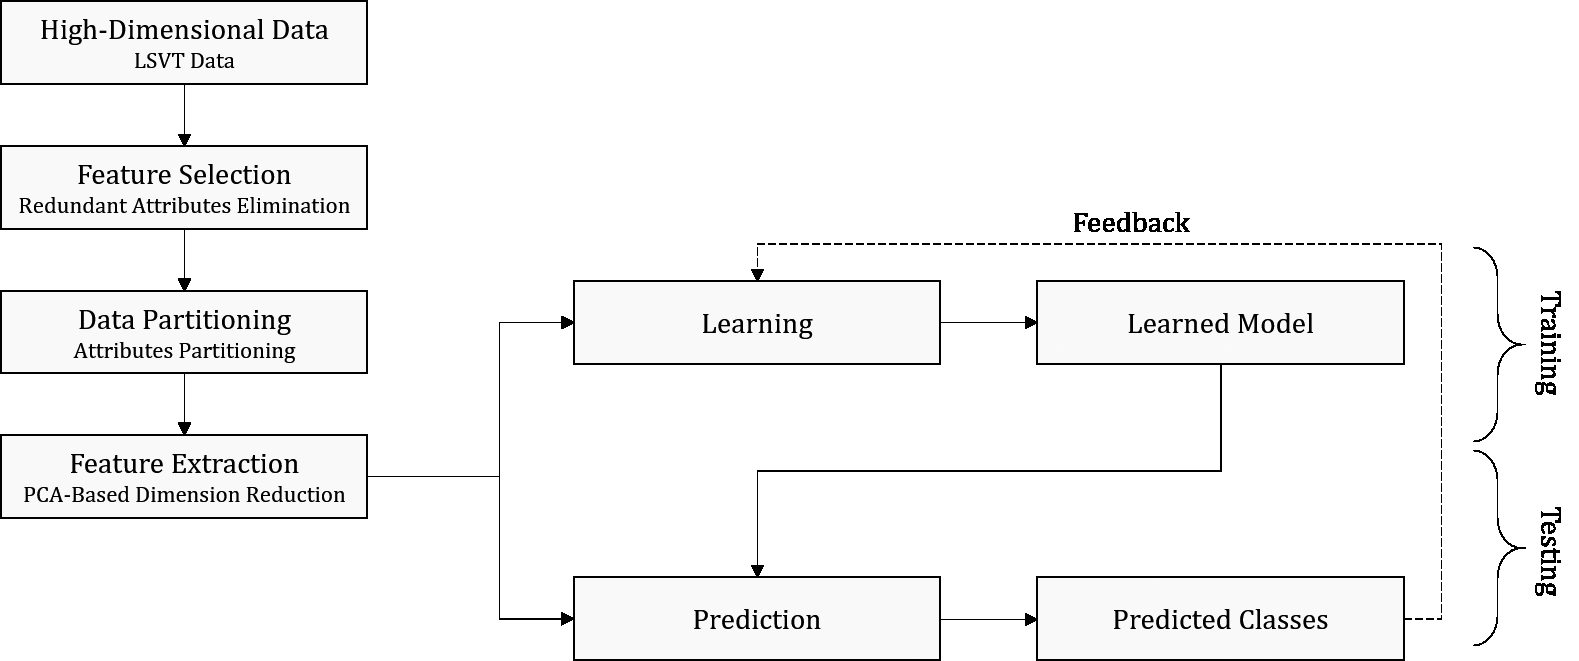
The computational experiment in our work consists of the cross-validation of the linear PCA classifier over different feature vectors extracted from the LSVM data following diverse feature extraction processes and class prediction. Figure 1 shows a general framework summarizing the diverse steps that lead to the performance evaluation. Applying feature selection with Pearson Correlation Coefficient we obtain the significant features where data is extracted to build the feature vectors employed in the cross-validation experiments of the PCA classifier. After dimension reduction, we fixed the class prediction step with Logistic Regression and C5.0.
Dimension reduction
In most situations, one finds oneself with a number of variables which tends to largely exceed the number of observations. Dimensionality reduction is then the most intuitive solution to contribute to the resolution of these problems in the field of machine learning. It proceeds either by applying a feature selection or feature extraction. Redundant and useless information will be thus circumvented in order to have a better representation of the data. The principal objectives of the reduction of dimension can be described by Guérif [32]: to improve the task of classification and to facilitate visualization plus the comprehension of the data, we must identify the relevant features in order to reduce the storage space necessary, and of least time consumption also CPU-expenditure. However, the elimination of certain redundant or not very relevant information can increase the classification error, considering this information can prove to be informative if they jointly are used [33].
Feature selection process. Feature extraction process.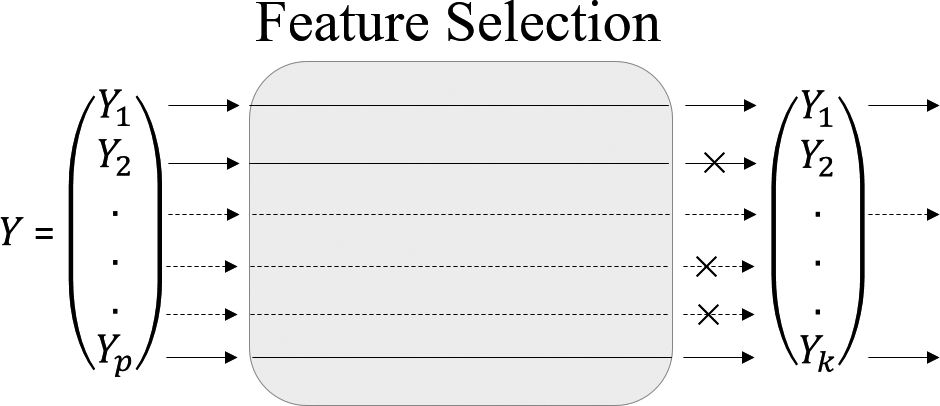
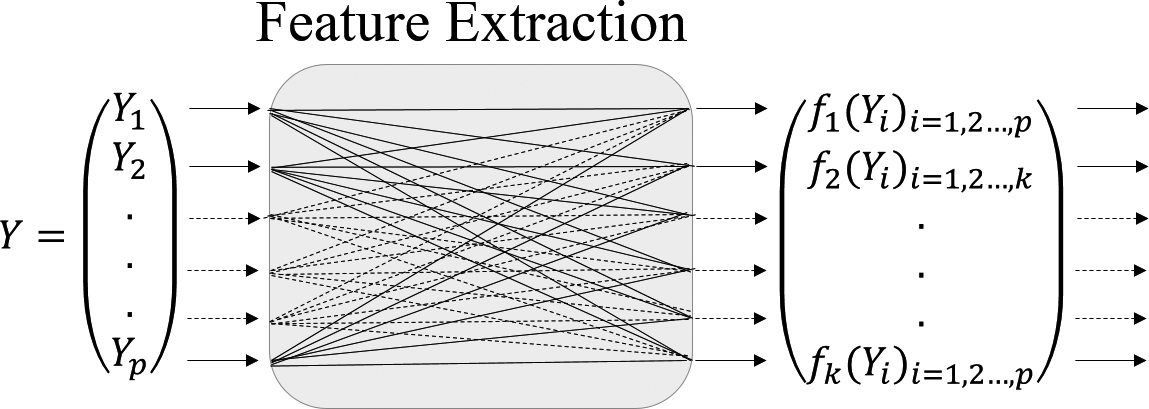
Dimensionality reduction remains a complex problem. It is divided into two main categories: feature selection and extraction or the transformation of the features as shown in the Figs 3 and 3.
These data do not prove very relevant for the classification process. Certain variables correspond to noise, or they are not very informative, less correlated and redundant or even useless for classes prediction. The problem of dimension reduction can be defined by assuming that we have dataset represented in a
In general, neither the geometry of the data manifold, nor the intrinsic dimensionality ‘
The motivation for applying feature selection techniques in bioinformatics has shifted from being an illustrative example to becoming a real prerequisite for high dimensional model building [21].
Feature selection is suitable when the measurements acquisition is expensive. Its objective is to reduce the number of necessary measurements and to choose those most informative. For the feature selection phase, the Pearson Correlation Coefficient developed by Karl Pearson was used to find highly correlated features to the class label [39]. The Pearson’s correlation coefficient, typically denoted by
We suppose that each feature consists of
Where
And similarl
This equation gives a value between
The methods of extracting features constructed from the original variables ‘
Nonlinear methods were also developed such as Independent Component Analysis (ICA), ISOMAP [43], LLE [44], and nonlinear versions of PCA and LDA as Kernel PCA [45], Kernel LDA [46].
2.3.2.1. Principle component analysis (PCA)
PCA is one of the oldest and most unsupervised techniques widely used for dimensionality reduction [47]. It performs dimensionality reduction by embedding the data into a linear subspace of lower dimensionality. The basic idea behind the PCA is to reduce the dimensionality of a dataset while retaining as much as possible the variation in the original variables [48]. This is done by finding a linear basis of reduced dimensionality for the data, in which the amount of variance in the data is maximal. The basic working of a PCA is presented below.
Mean value
The mean value is subtracted from each feature:
Matrix
The covariance matrix characterizes the distribution of the data. Eigenvalues are computed as:
Eigenvectors are computed as:
Since
where For dimensionality reduction, only the terms corresponding to the
where The representation of
The new variables (i.e.
The covariance matrix represents only second order statistics among the vector values.
Let
In fact,
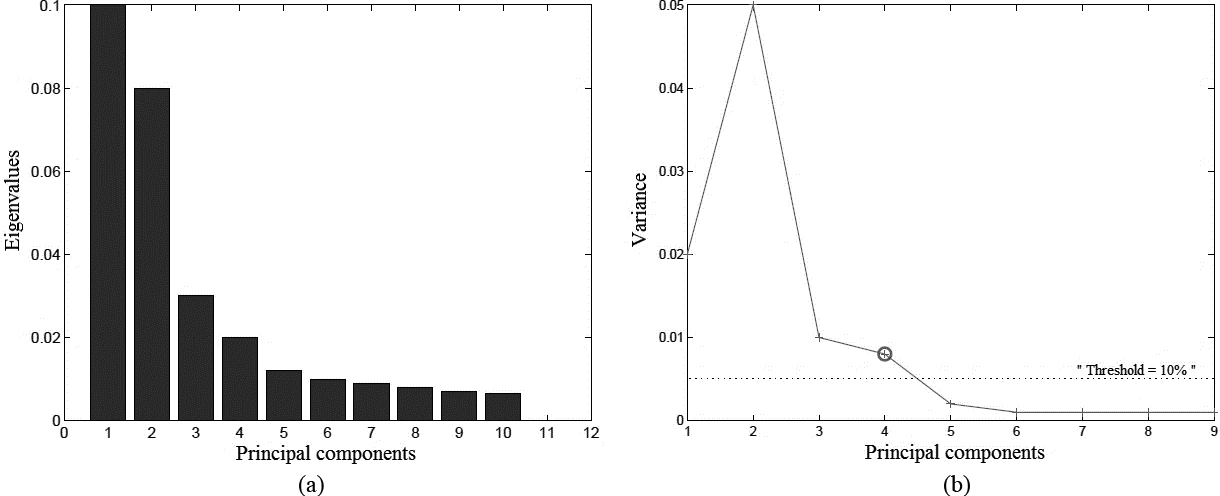
In this example, the threshold was set at 10% of the biggest difference and the scree-test identifies an elbow at the 4
The high dimension of ‘
C5.0 Decision tree algorithm
C5.0 algorithm developed based on C4.5 by Quinlan [51] consists of a number of branches, one root, a number of nodes and a number of leaves. One branch is a chain of nodes from root to a leaf, and each node involves one attribute. Classification is done through the decision tree with its leaves representing the different conditions of the monoblock centrifugal pump. This algorithm is known to have many advantages such as higher accuracy, possibilities to use boosting, pruning, weighting and windowing features [52].
The use of this methods recurred that the root node at the top of the tree considers all samples and passes them through to the second node called “branch node”. The branch node generates rules for a group of samples based on an entropy measure. In this stage, C5.0 constructs a very large tree by considering all attribute values and finalizes the decision rule by pruning. It uses a heuristic approach for pruning based on splits statistical significance. After fixing the best rule, the branch nodes send the final class value in the last node, called the “leaf node” [53].
In this study, we adopt the largest gain rate of the attributes as the node, and use the recursive method based on Information Entropy to form the decision tree. Entropy provides an information-theoretic approach to measuring the goodness of a split. It measures the amount of information in an attribute. The following takes calculation evaluation the property
Assume that category attribute has
We suppose that attribute
Split Information
Gain is computed to estimate the gain produced by a split over an attribute.
then:
The smaller the entropy, the purer the dataset.
Logistic regression (LR) is one of the most common models for prediction, regression, and classification [55]. It’s a type of linear predictive model in which the output variable is a binary variable such as healthy or unhealthy, dead or alive, win or loss, etc. Logistic regression, widely applied in the medical sciences, assumes that the targets follow a Gaussian distribution [56]. The binary output variable can take one of two possible values, denoted by 1 and 0 (for example,
Logistic regression method models the relations between these variables through the following equation:
Where
Each model developed has the performance that has been measured in terms of the average accuracy, which means the number of correctly classified cases under the total number of cases in a testing set. The dataset is divided into a training set and a testing set. Comparing the classification performance of two models (PCA-C5.0 and PCA-LR) can be realized by accuracy rate, which is the most direct criterion to evaluate the classification models. It can be quantitatively evaluated by the following expression:
After data preprocessing, the proposed performance evaluation procedure on the dataset is applied. The performance of each model developed was measured in terms of average accuracy. The experiments were performed with training data and test data. The size was chosen differently and dependent on the available dataset in order to provide a reliable estimate and validate the developed models.
The interest of dimension reduction by considering applications for the class prediction of spoken data has been illustrated.
Application to LSVT voice rehabilitation dataset
After data preprocessing, the proposed performance evaluation procedure on the LSVT Voice Rehabilitation dataset was applied. We choose 90% instances randomly to train the model and the 10% remainder instances to test the model. After 10-fold cross validation (CV) with 100 repetitions we present the accurate performance of only the first 30 steps of the features selection algorithms. As feature selection is performed in each cross-validation folder, the standard deviation of the number of features is provided.
Mean 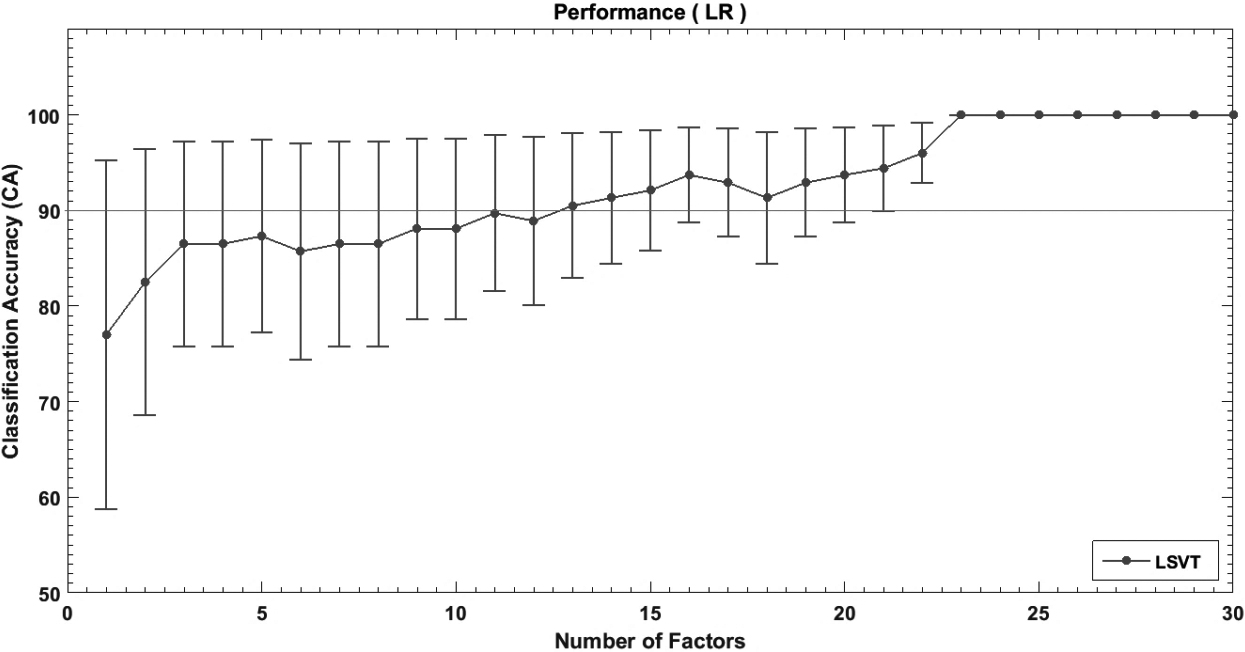
Mean 
Using PCA-LR model, the mean performance results reached 90% with thirteen features and 100% with twenty-three features (Fig. 5).
With the PCA-C5.0 model, we noted that when at least four features are used, the performance of the classifier reached 91,27% (Fig. 6).
The comparison of PCA-LR and PCA-C5.0 mean performance results (Fig. 7) shows that the PCA-C5.0 model is more efficient in minimizing the number of features and maximizing the accuracy. In fact, PCA-C5.0 provided an accuracy of more than 90% with only four features.
Common features ‘
Comparison of mean performance results of the first 30 steps of the feature selection algorithms using PCA-LR, and PCA-C5.0.
The results obtained by applying feature selection and extraction with PCA-LR and PCA-C5.0 modelson the experimental dataset using different criteria to estimate the number of common features are represented in Table 2.
Firstly, it should be mentioned that the feature selection method reduced the number of features from
On the other hand, the feature extraction using the first criterion called Kaiser Criterion with Eigenvalue
Our results of 96.3% with the PCA-C5.0 model for
Using a novel feature selection method based on Network of Canonical Correlation Analysis (NCCA) with two classifiers; neural network (NN) and support vector machine (SVM), Hossain et al. [58] show that NCCA is very robust in terms of accuracy 100% for
Females and males performance in the PCA-LR and PCA-C5.0 models.
The idea of testing gender effects in performance arose from previous evidence which suggested gender-related differences in speech abilities. To examine the effect of gender on dimension reduction performance, we applied dimension reduction methods separately to males (
Figure 8 represents the results when training the C5.0 and LR with the 14 subjects in relation to gender. We observed that the classifiers fluctuate around 90% depending on the number of features presented to the classifiers.
For women in the LR model, the best results were obtained from
The performance of the model reached a maximum of 100% from
In the PCA-C5.0 model, the performance exceeded 90% in female participants and reached 100% from
The differences in performance between male and female may reflect the well-documented gender-related differences concerning the speech performance and intelligibility in PD [60, 61, 62]. The size of the sample limits the generalizability of this study.
Conclusion
The current study was designed to address the problem of speech performance in Parkinson’s disease using dimension reduction and data smoothening approaches. In this paper, we focus on data preprocessing, feature extraction, dimensionality reduction and classification. We proposed a new method for dysphonia measures selection for Parkinson speech rehabilitation based on feature dimensionality reduction using PCA to low dimensionality feature space and using the C5.0 and LR as a decision functions for classification of dysphonia measures. The main advantage of our approach is that the number of factors can be effectively reduced from
The results of extensive testing performed on the LSVT Voice Rehabilitation dataset (we have achieved an accuracy of within-PCA-C5.0 classification of 99.21% with 13 features only and an accuracy of 96.03% with 6 features) reveal the advantages of the proposed approach.
In addition, differences in performance between male and female were reported in this work which suggests that the applied features extraction and modeling approaches may be sensitive to gender. For this reason, further research is needed to understand the possible relationships between gender and dimensionality reduction for voice rehabilitation issues.
Conflict of interest
The authors have no conflict of interest to report.