



Abstract
BACKGROUND:
The influence of various musculoskeletal disorders has been evaluated using different kinetic and kinematic parameters. But the efficiency of walking can be evaluated by measuring the effort of the subject, or by other words the energy that is required to walk.
OBJECTIVE:
The aim of this study was to identify mechanical energy differences between the normal and pathological groups. Four groups of 15 healthy subjects, 13 Parkinson subjects, 4 osteoarthritis subjects, and 4 ACL reconstructed subjects have participated in this study. The motions of foot, shank and thigh were recorded using a three dimensional motion analysis system. The kinetic, potential and total mechanical energy of each segment was calculated using 3D markers positions and anthropometric measurements.
RESULTS:
Maximum value and sample entropy of energies was compared between the normal and abnormal subjects. Maximum value of potential energy of OA subjects was lower than the normal subjects. Furthermore, sample entropy of mechanical energy for Parkinson subjects was low in comparison to the normal subjects while sample entropy of mechanical energy for the ACL subjects was higher than that of the normal subjects.
CONCLUSION:
Findings of this study suggested that the subjects with different abilities show different mechanical energy during walking.
Introduction
Various musculoskeletal disorders influence the abilities of subjects during standing and walking. The performance of subject can be divided into standing performance, walking performance, and the magnitude of energy consumption during walking [1, 2, 3, 4, 5, 6].
The influence of musculoskeletal disorders on the performance was evaluated by measuring the force applied to the leg, range of motion of the joints (especially ankle, knee and hip) and the moment transmitted through the joints [5, 6, 7, 8, 9]. However, the efficiently of walking can be evaluated by measuring the effort of the subject [6, 10]. It means that the magnitude of the energy required moving the center of gravity (COG) of total body forward. In this way the efficiency of walking depend on the ability of the body to produce and absorb energy. It has been shown that the works done by muscles to translate the COG with respect to the ground is one of the determinants of the energy expenditure of gait which is controlled by neuromuscular system [6, 11].
The motion of COG during walking has been resembled to an inverted pendulum [6, 11, 12]. If the location of COG is behind the heel contact point (end of pendulum), kinetic energy will decrease due to a forward deceleration. At this point the kinetic energy is converted into gravitational potential energy. Increase in forward velocity due to forward movement of the COG) converts the potential energy into kinetic energy. In friction-less pendulum the kinetic energy is converted to potential energy, therefore, the total energy (sum of the kinetic and potential energy) remain unchanged. It means no external work require to move the pendulum forward. However, human body is not a frictionless pendulums [6, 13]. In the other words, the kinetic and potential energy does not convert totally. Therefore, the total energy fluctuates during walking. The amount of fluctuation of total energy depends on severity of musculoskeletal disorders.
It has been determined that musculoskeletal disorders influence on some gait parameters such as walking speed, stride length, and the moments transmitted through the joint [1, 2, 4, 5, 9]. However, it is not clear whether the kinetic energy, potential energy, and total energy exchange during walking is influenced by musculoskeletal disorder or not. While the changes in the mechanical energy of gait in Parkinson and normal subjects have been investigated [14], that study did not include rotational kinetic energy and any other pathologies. Furthermore, knowledge of the mechanical energy of different segments of the leg can be helpful for physicians to plan a more deliberate treatment. Answer to this question helps the clinicians to focus on the appropriate model to improve the efficiency of walking. The main hypothesis associated with this study was that the kinetic, potential and total energies differ in subjects with different abilities to walk.
Method
Four groups of normal, those with knee osteoarthritis, subjects with anterior cruciate ligament reconstruction (ACL) and those with Parkinson disease participated in this study. Table 1, shows the characteristics of subjects that participated in this study. An ethical approval was obtained from the Ethical Committee of the Isfahan University of Medical Sciences. A consent form was signed by every subject before data collection. The kinetic, potential and total energy of foot, shank and leg were the main parameters selected in this study. The motions of foot, leg, shank were recorded by use of a 3D motion analysis system (quantify with 7 high speed cameras).
Characterizations of subjects participated in this study
Characterizations of subjects participated in this study
The subjects were informed regarding the test procedure. Sixteen markers were attached on the right and left superior anterior iliac spines, right and left posterior superior iliac spine, greater trochanter, medial and lateral malleolus, first and fifth metatarsal heads and heel. Moreover, four marker clusters (4 markers) were attached on anterolateral surface of right and left legs and thighs. The subjects were asked to walk with a comfortable speed to collect 5 successful trials. The data were filtered with a Butterworth low pass filter with a cut off frequency of 10 Hz. The anthropometric measurement and 3D marker positions and velocity were used in energy analysis. In all of the subjects, data collected from the right leg of each subject was used to calculate the mechanical energy. The total mechanical energy of each segment was computed using the following equations:
In Eqs (1) to (4),
Entropy is a non-linear statistical test to detect irregularities in data pattern. Approximate Entropy is a common tool for this purpose. Approximate entropy of a data series is approximately equal to the negative average natural logarithm of the conditional probability that two sequences that are similar for m points remain similar, that is, within a tolerance r, at the next point. Thus a lower value of approximate entropy indicates more regularity in a data series [15]. But approximate entropy method has some disadvantages. The first issue is high dependency on the series length, so that the entropy value for short length of data leads to smaller magnitudes of entropy. Another issue is low repeatability of this method, in a way that if entropy of a data series is more than of that in another series it will not remain higher for all the conditions [16].
To solve this problems sample entropy method was introduced. Sample entropy of a data series is exactly equal to the negative average natural logarithm of the conditional probability that two sequences that are similar for m points remain similar at the next point. Contrary to approximate entropy self-similarity is not included for the calculation of probability in sample entropy method. In addition, sample entropy algorithm is simpler so that a lower calculation time is required. Also the results acquired from this method are independent of data length and has a better repeatability [16, 17].
In this study Sample Entropy is calculated using Eq. (5) where respectively m and r values of 2 and 0.2*std in which std is the standard deviation of data series.
In this equation A is the number of couple vectors having less distance than r having length of m
Figure 1 shows the kinetic, potential, and total energy of foot segment. In the stance phase of kinetic and potential energy of foot, energy value was almost zero, but in the late swing phase of gait, kinetic energy of ACL subjects was higher than normal subjects and kinetic energy of the OA and PD subjects was lesser than normal subjects. Also both ACL and OA subjects showed longer stance phase than normal subjects. In contrary, potential energy of ACL subjects was lower than normal subjects. Furthermore, potential energy of both OA and PD subjects was about the same level of the normal ones. However, total mechanical energy of the foot had a similar trend to the kinetic energy values. That is, due to the fact that foot segment has a generally low height in the gait, so kinetic energy of the foot have much higher contribution to the total energy compared to potential energy. It seems that the difference between the kinetic energy of the four groups is higher in the first half of the swing phase. Due to the active acceleration in the initial swing and mid swing, higher effort from the subject is required in comparison to the terminal swing where the deceleration is partially due to the gravity.
(a) Kinetic, (b) potential, and (c) total mechanical energy of the foot segment (Joules/(body weight 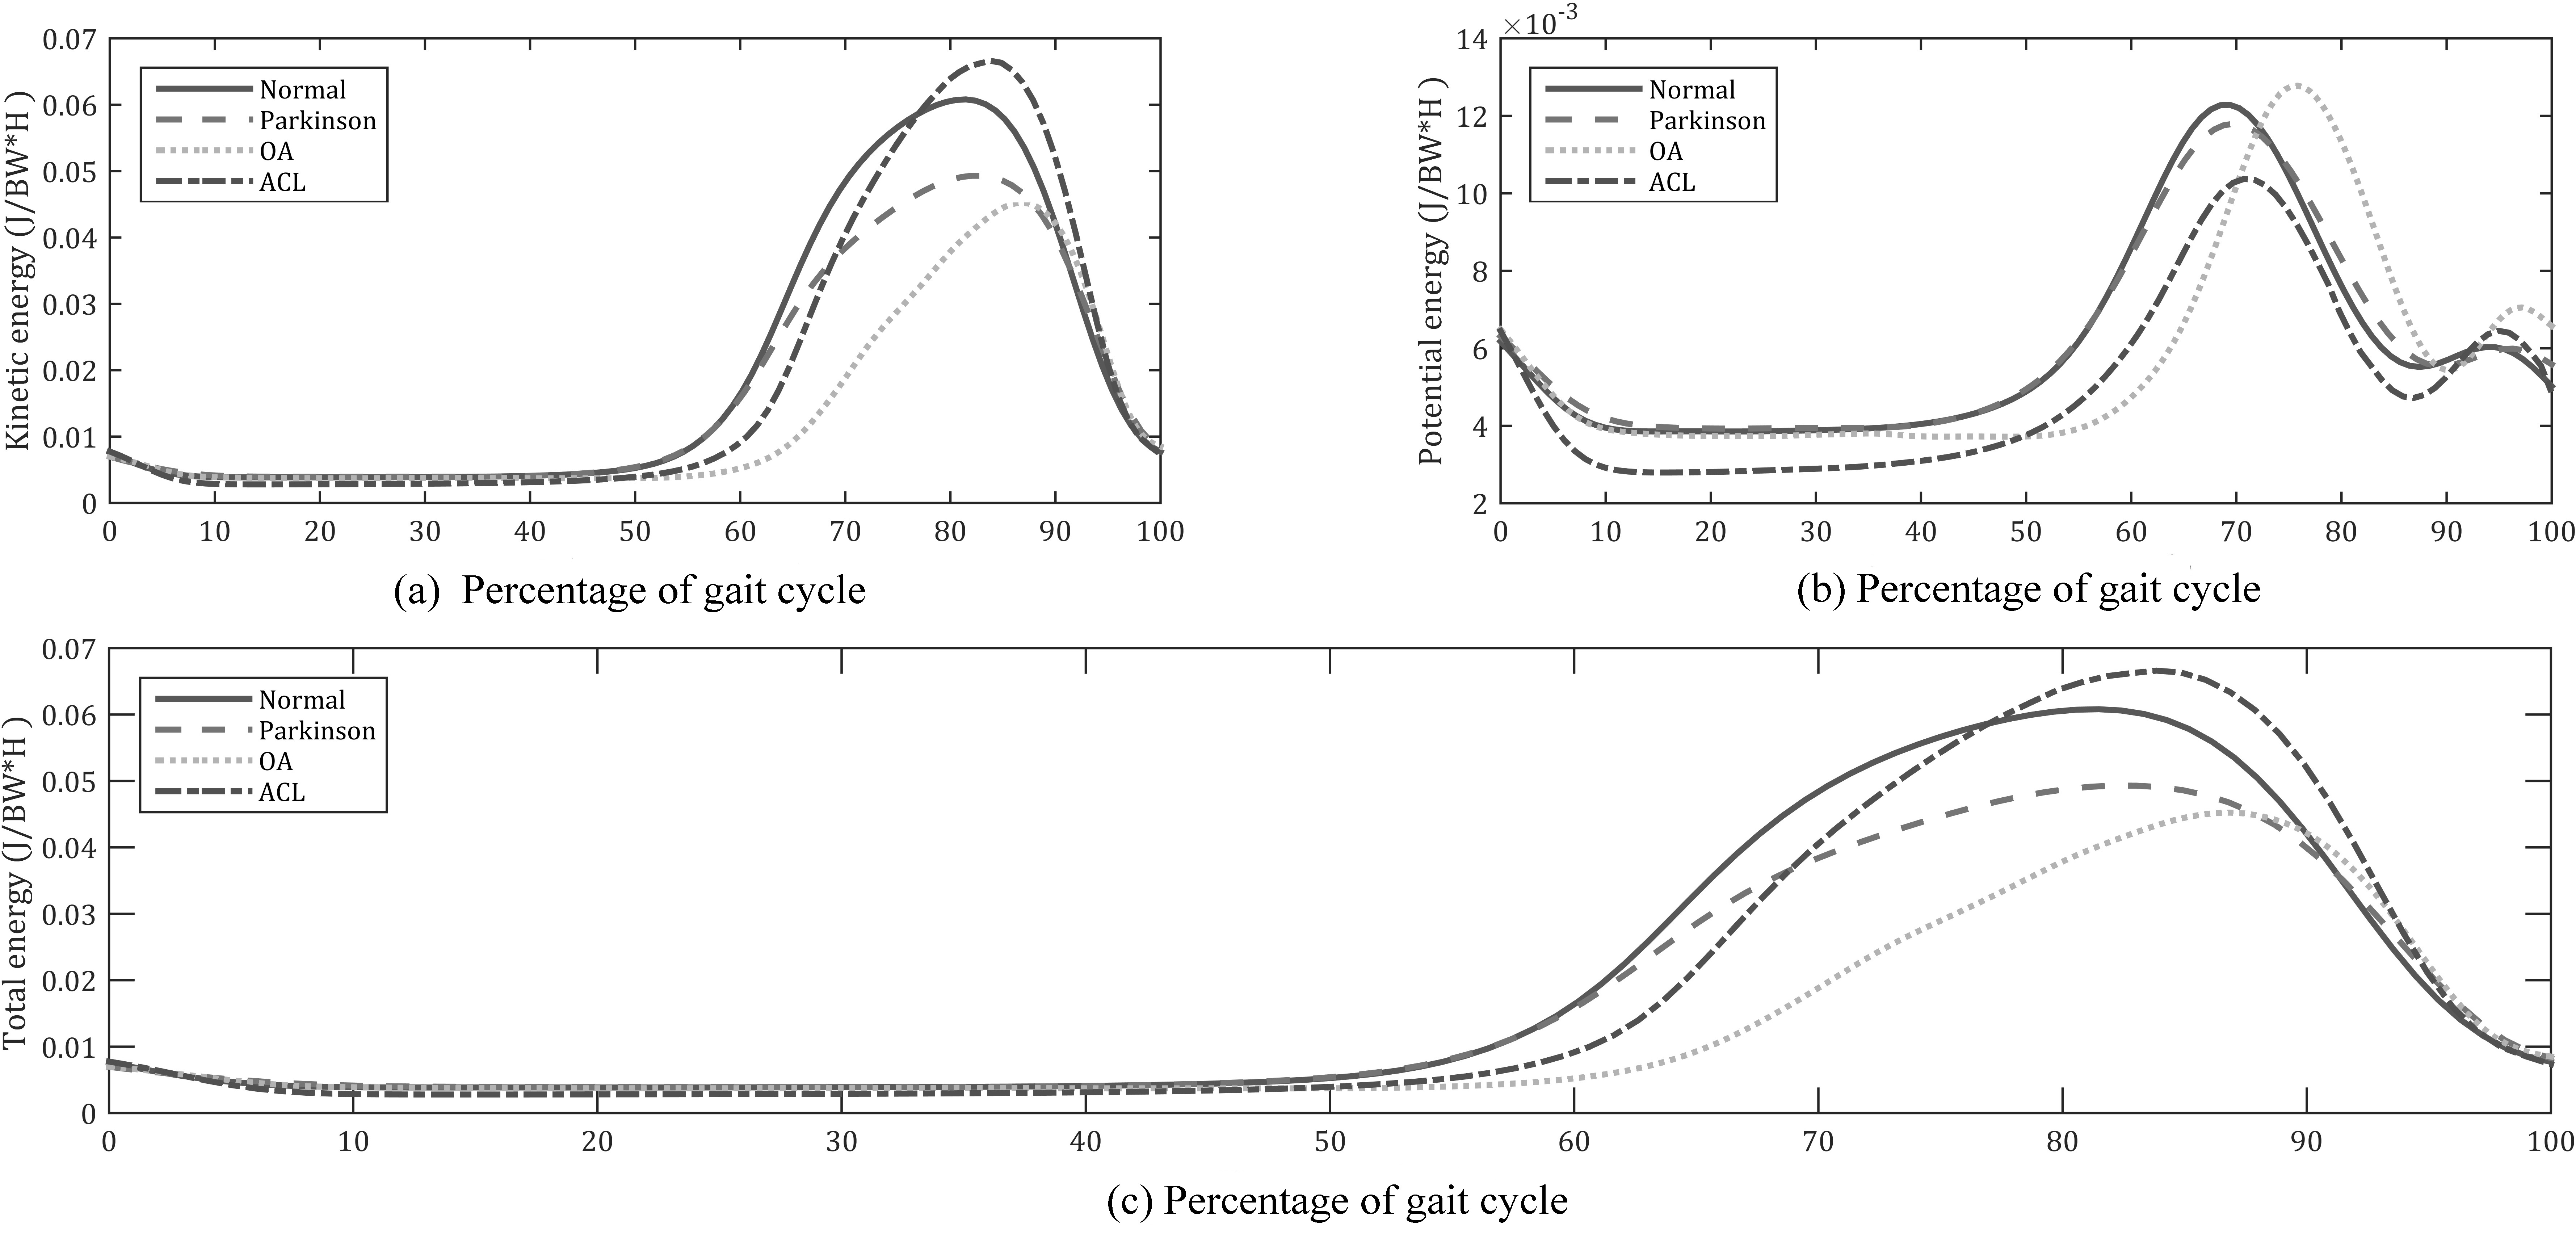
(a) Kinetic, (b) potential, and (c) total mechanical energy of the shank segment (Joules/(body weight 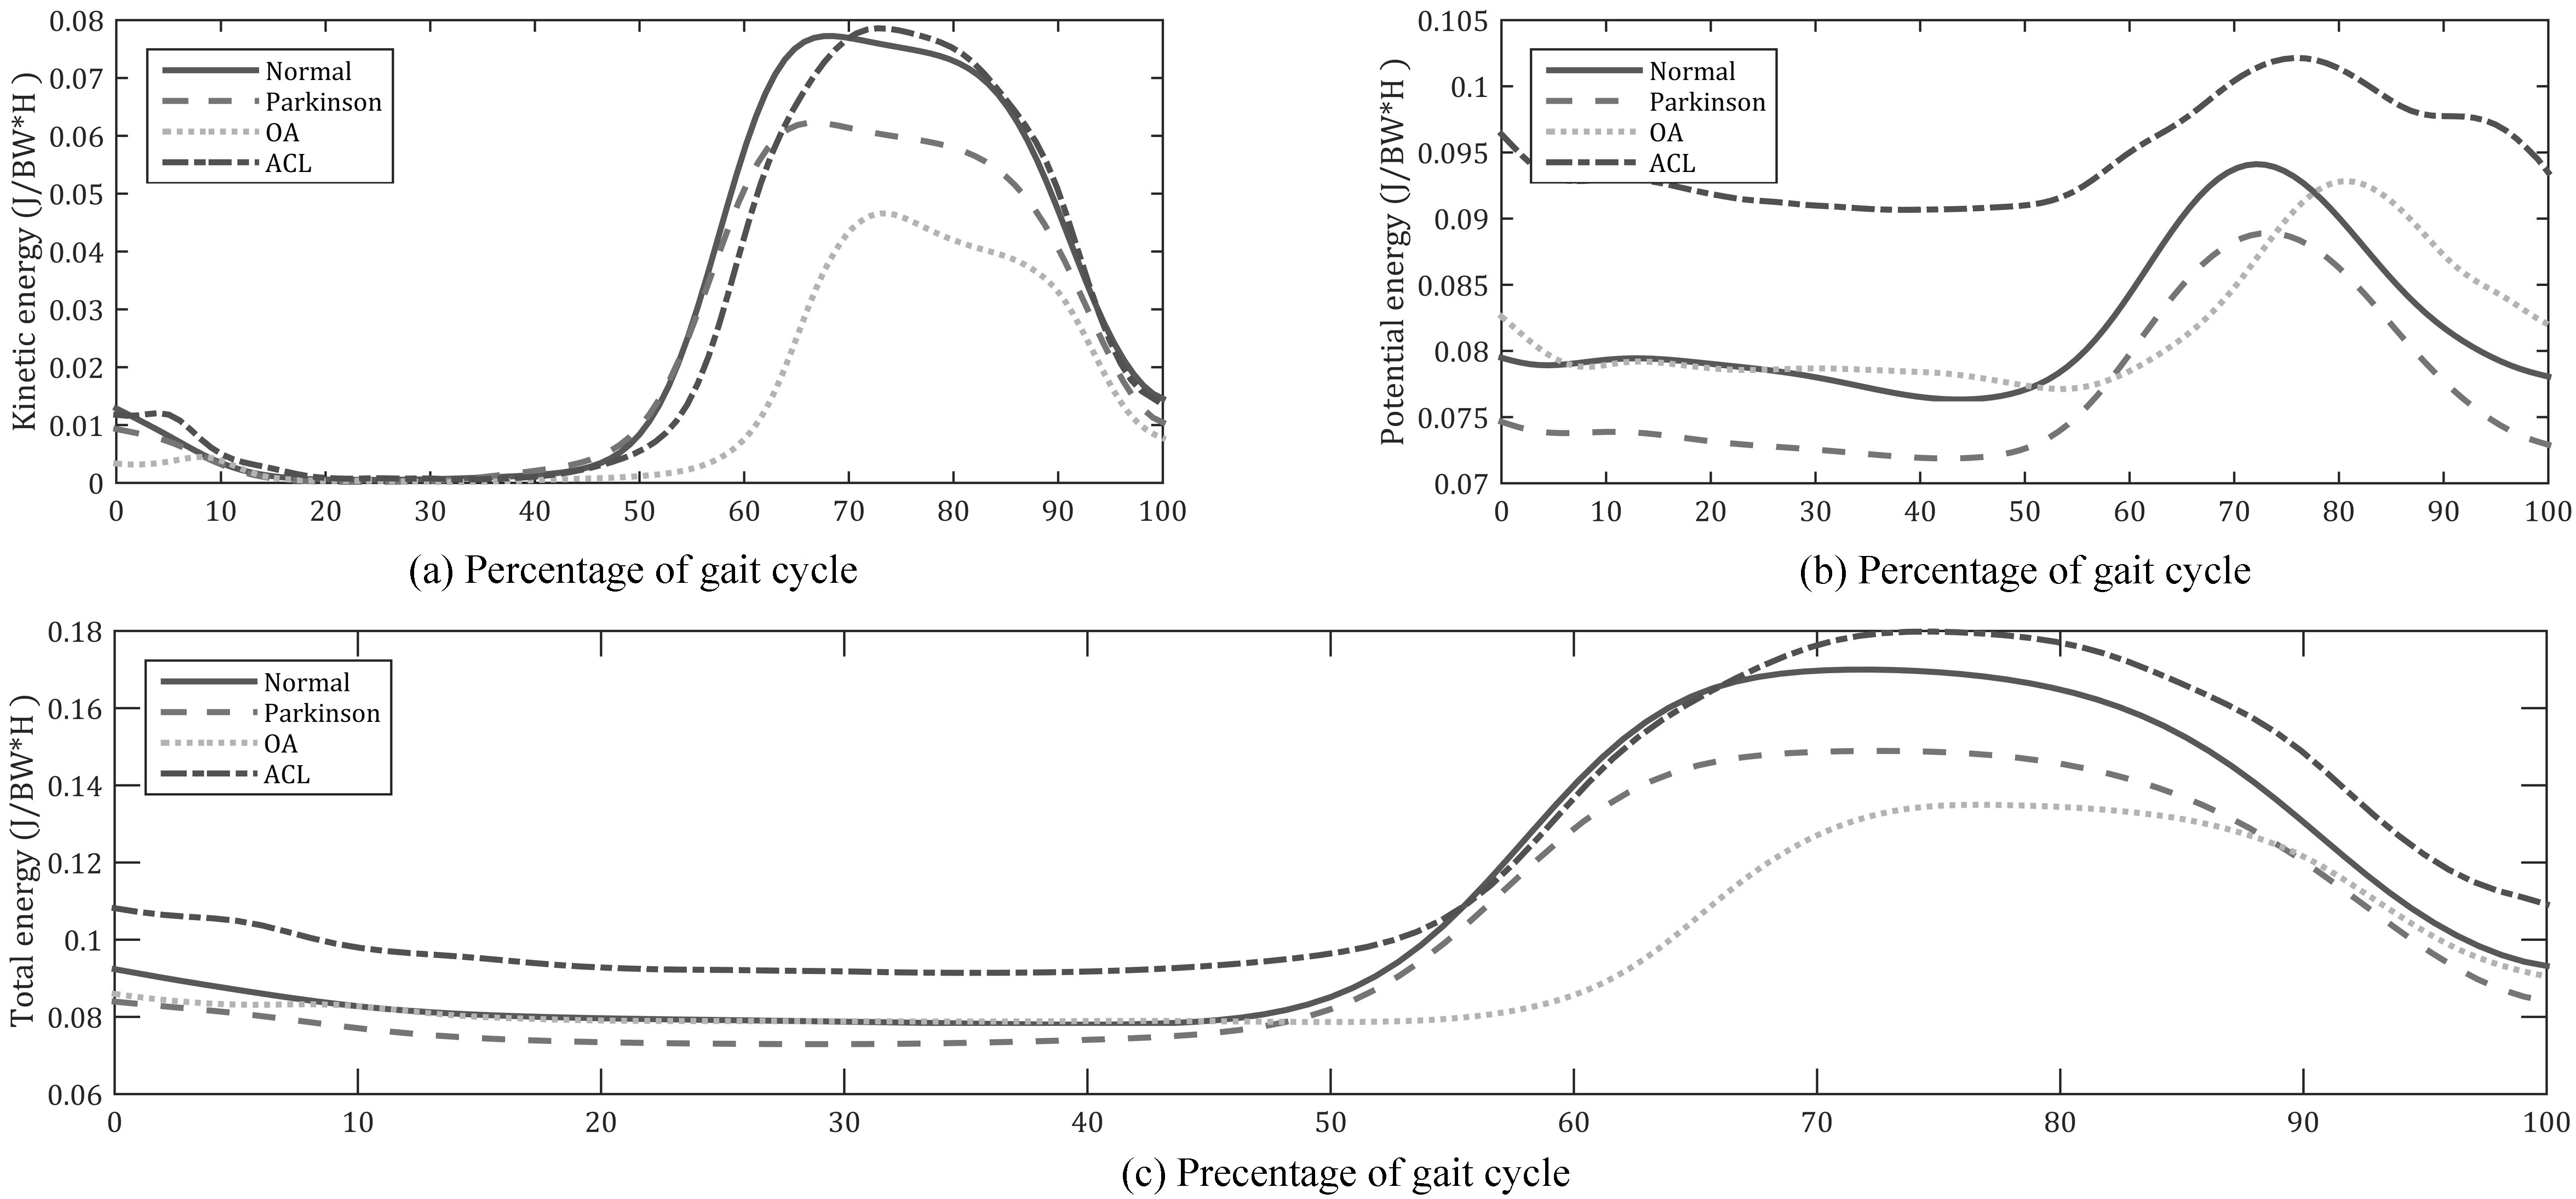
(a) Kinetic, (b) potential, and (c) total mechanical energy of the thigh segment (Joules/(body weight 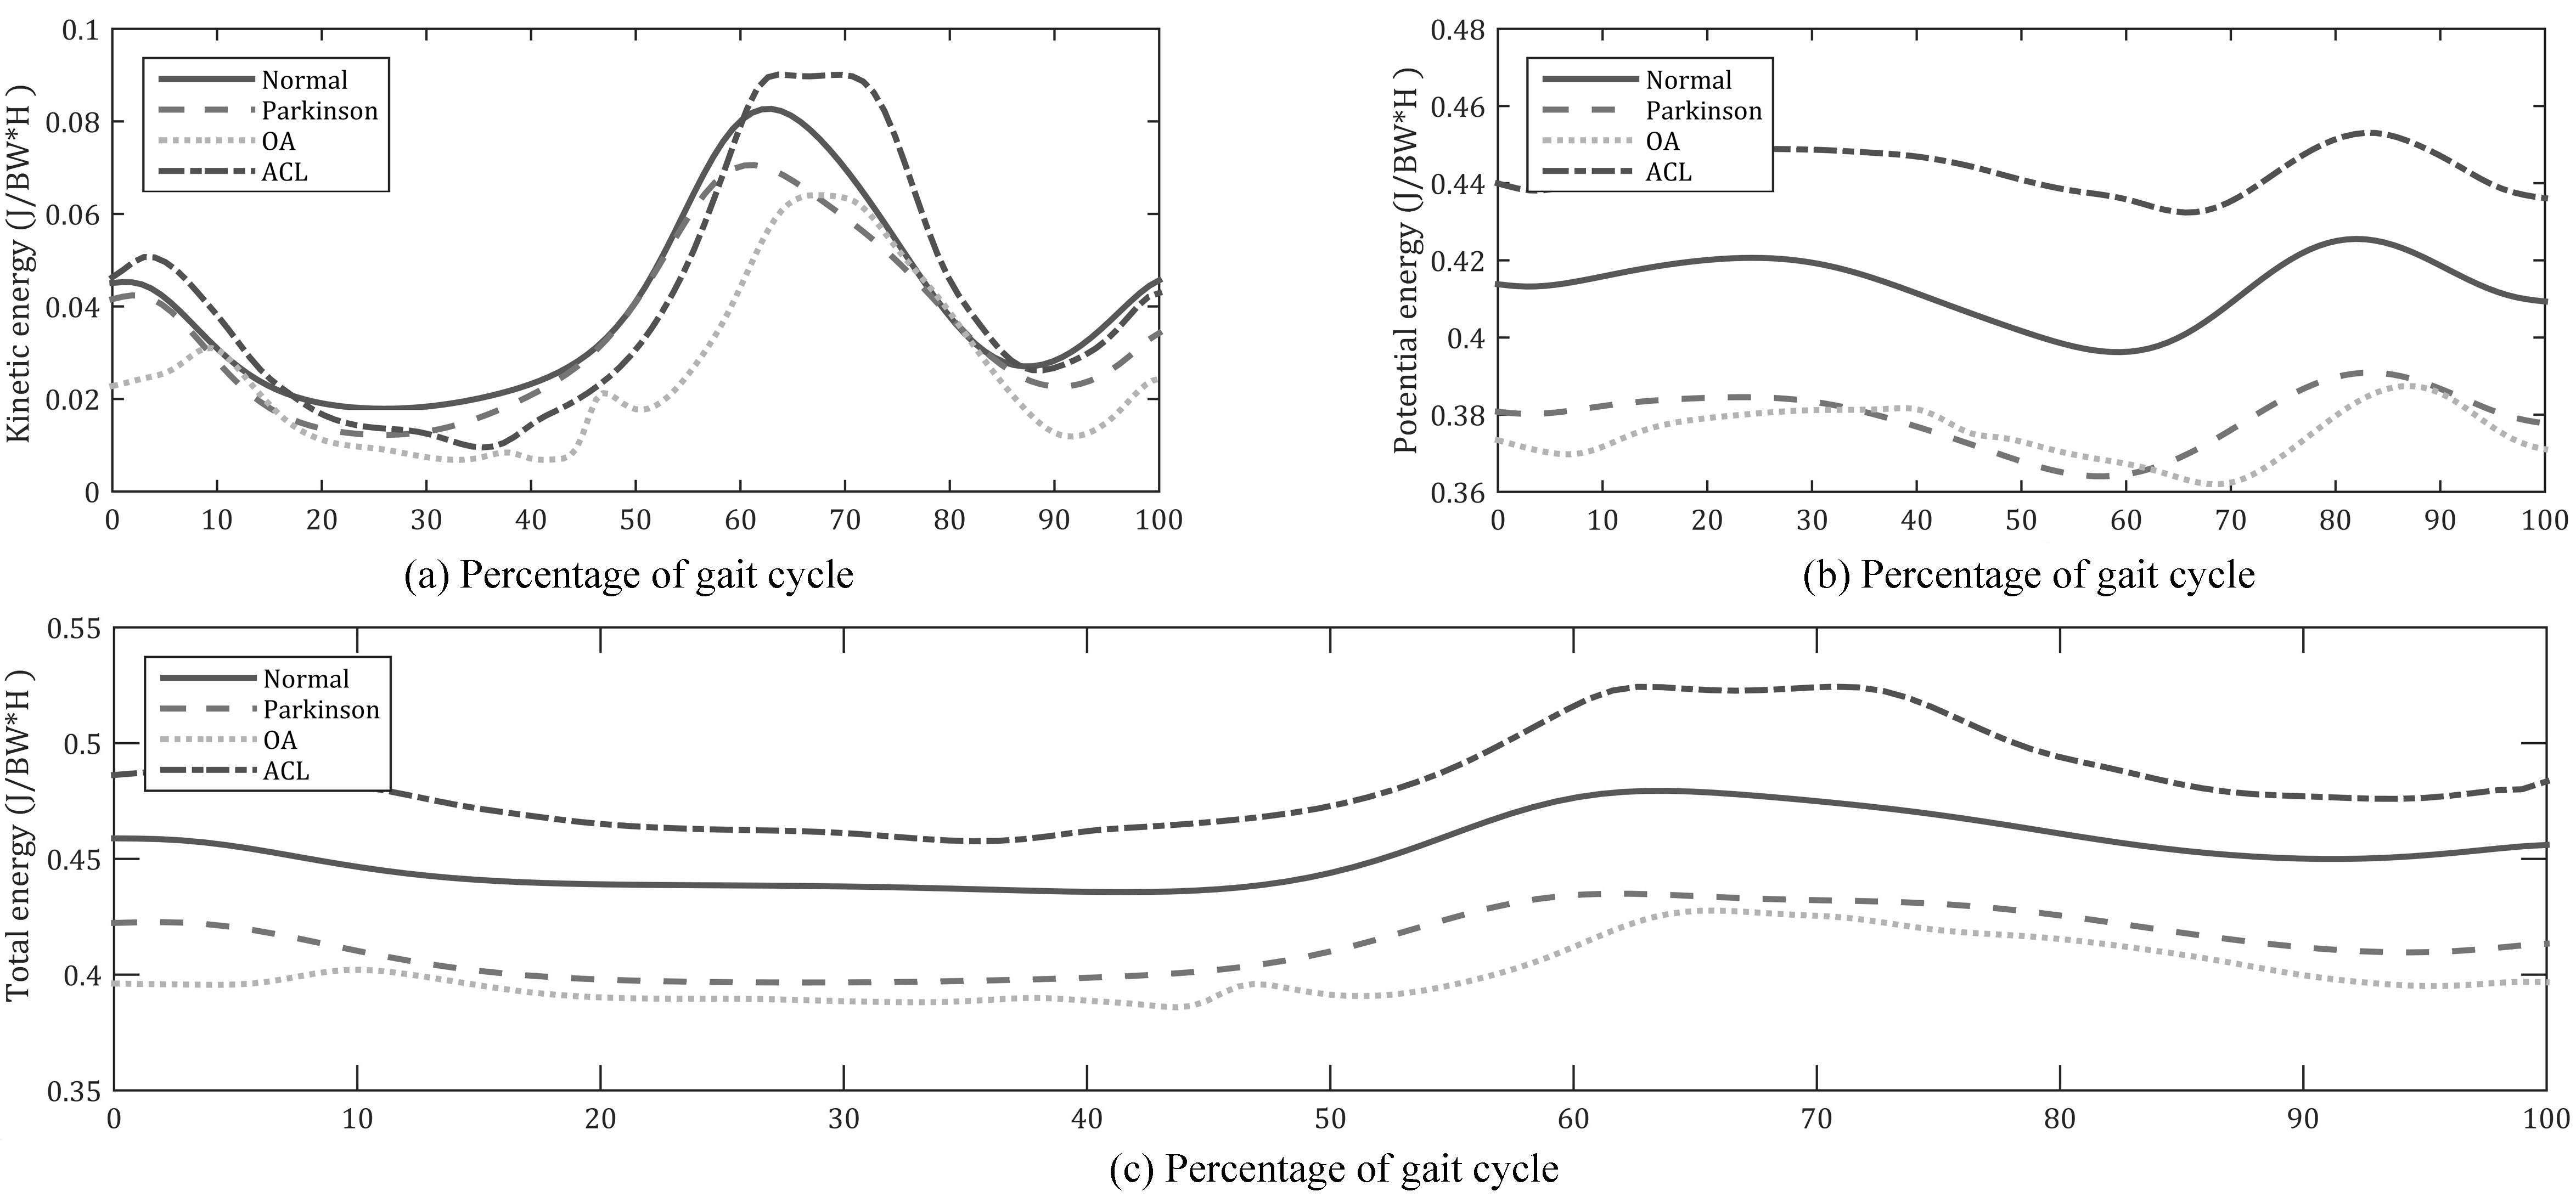
As it has been shown in Fig. 2, mechanical energy of the shank segment is higher than mechanical energy of the foot segment. That is because shank segment has more weight, have higher altitude than foot segment and have both more transitional velocity (due to the higher length of the joint to the center of mass than foot segment) and higher rotational velocity (due to the higher range of motion of knee joint than ankle joint). It has been shown that shank segment’s kinetic energy of ACL subjects were similar to normal ones but they had a slightly longer stance phase. OA subjects had both lower kinetic energy value and higher stance phase duration. Furthermore, in stance phase, PD subjects had a similar kinetic energy to normal subjects but their kinetic energy was lower than normal subjects in swing phase. Even though shank’s potential energy value of those with OA was similar to normal subjects, they had a longer stance phase. PD subjects had lower potential energy than normal subjects. Due to the age difference between those with ACL and normal group, ACL subjects had a higher potential energy than normal ones.
The other segment that has been studied in this research was thigh segment. Mechanical energy of this segment has been shown in Fig. 3. Thigh has about the same length and range of motion of the shank, but this segment has considerably more weight and altitude. Therefore, potential energy of the thigh segment makes most of its total energy. Like the two other segments the ones who had reconstructed ACL had higher potential energy than normal subjects and those with PD and OA had lower potential energy than normal ones.
The maximum value of kinetic, potential and total energy normalized by body weight*height, of foot in normal subjects were 0.058
The maximum value of kinetic energy of foot, shank and thigh in osteoarthritis subjects were 0.043
The maximum value of potential energy of foot, shank and thigh in osteoarthritis subjects were 0.011
The maximum value of total energy of foot, shank and thigh of osteoarthritis was 0.049
Table 2 shows the potential, kinetic and total energy of foot, thigh and shank of subjects with Parkinson disease. As can be seen from this table the maximum value of kinetic and potential energy of foot were lesser in subjects with Parkinson disease compared to normal subject, however difference was not significant (
Comparison of maximum value of mechanical enregy between diffrent groups (% of body weight
Comparison of sample entropy value of mechanical energy of different groups. Kinetic Energy (KE), Potential Energy (PE), and Total Energy (TE)
Table 3 shows the entropy of potential, kinetic and total energy of foot, thigh and shank of subjects with Parkinson disease. As can be seen from this table the entropy of kinetic and total energy of foot, shank and thigh were lesser in subjects with Parkinson disease compared to normal subject, difference was significant (
The entropy of kinetic, potential and total energy of thigh in osteoarthritis subjects were 0.151
The entropy of kinetic, potential and total energy of shank and thigh of ACL reconstructed subjects was higher than that of normal subjects (
Various methods have been used to compare the performance of subject with different musculoskeletal disorders. Evaluating the kinetic and kinematic parameters is a method used to find the severity of musculoskeletal disorders [10]. However, measuring the energy exchanged during walking is another method which can be used to distinguish between normal and pathologic gait and to evaluate the severity of disease. Therefore, the aim of this research was to investigate the gait difference by use of this parameter.
Both kinetic and potential energies of show a drop at the early stance phase. This reduction pattern can be justified by stating that the height of center of mass and it’s both transitional and rotational velocities of the respective segment decreases from heel strike to double support. Absence of this phenomena from the kinetic energy of shank and thigh segments of the OA subjects, can be result of the lack of proper rotation of the respective segments from the heel strike to double support. Furthermore, the second peak of the kinetic energy of the foot is due to the rotation of the foot in the late swing, in preparation for heel strike.
The dominant part of the mechanical energy of the foot in all of the subjects was the kinetic energy (Fig. 4). That is due to the lower altitude of the foot segment. On the other hand, due to the higher altitude of the thigh, potential energy of this segment accounts for most of its mechanical energy (Fig. 5). Kinetic and potential energy of the shank segment are about the same level (Fig. 6).
Maximum energy of the foot segment (Joules/(body weight 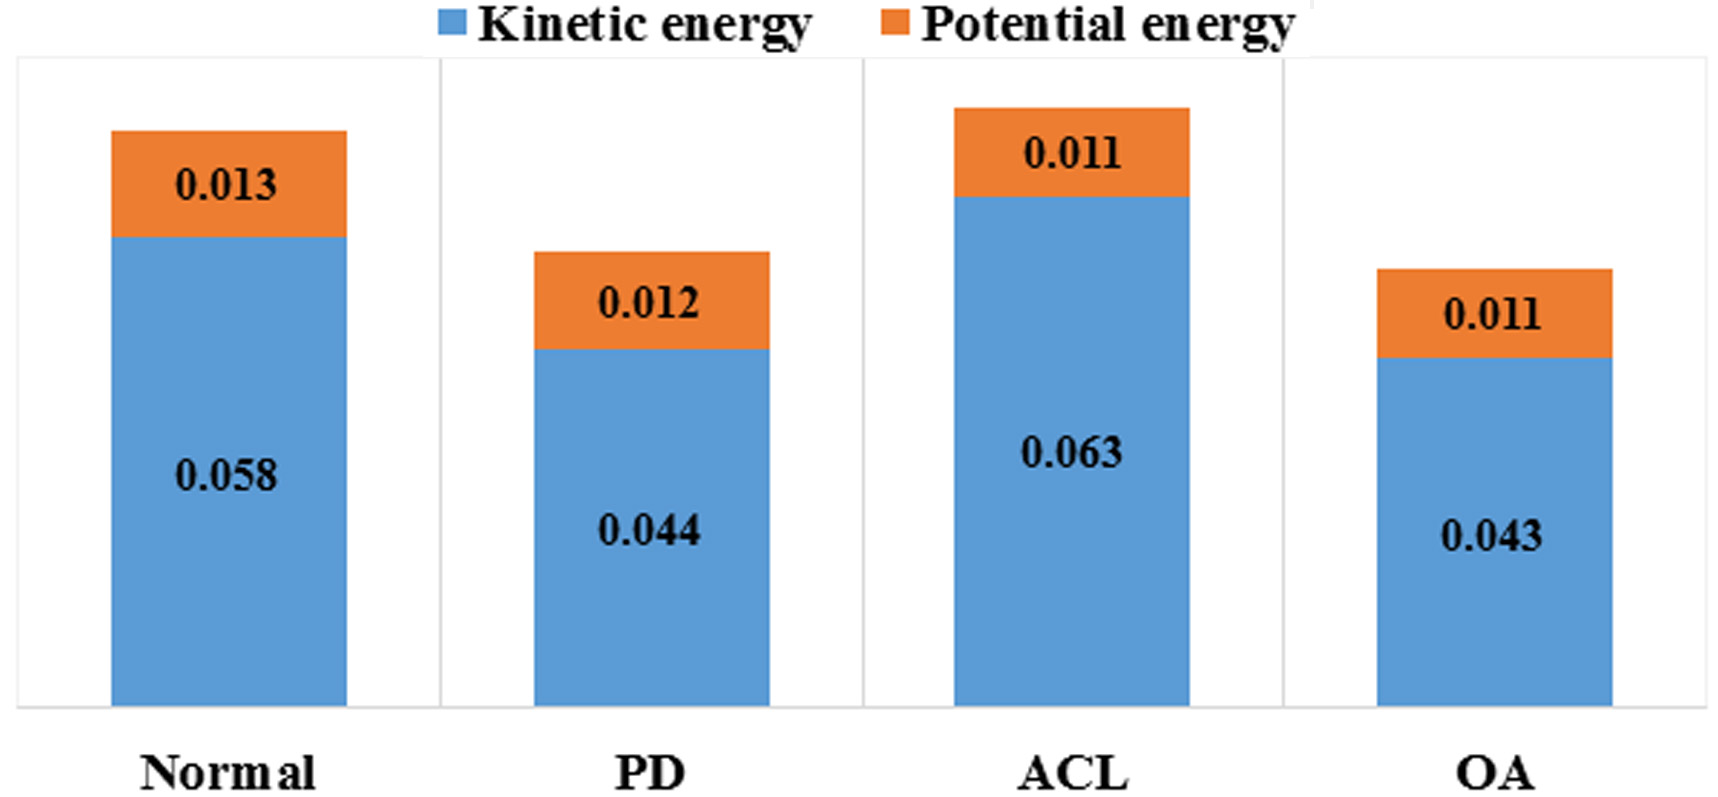
Maximum Energy of the shank segment (Joules/(body weight 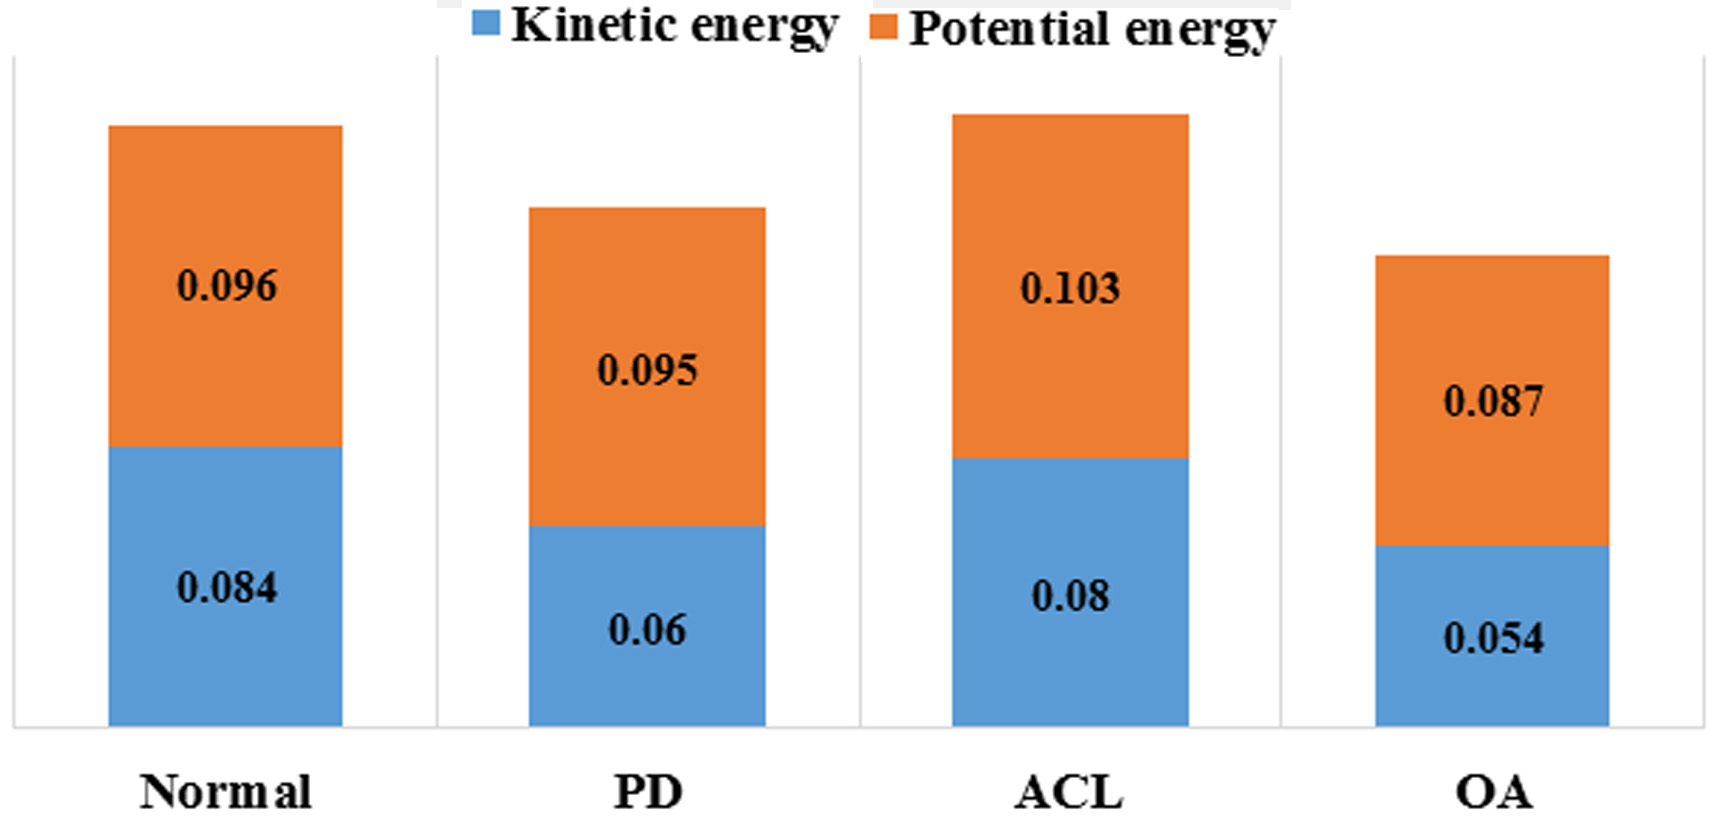
Maximum Energy of the thigh segment (Joules/(body weight 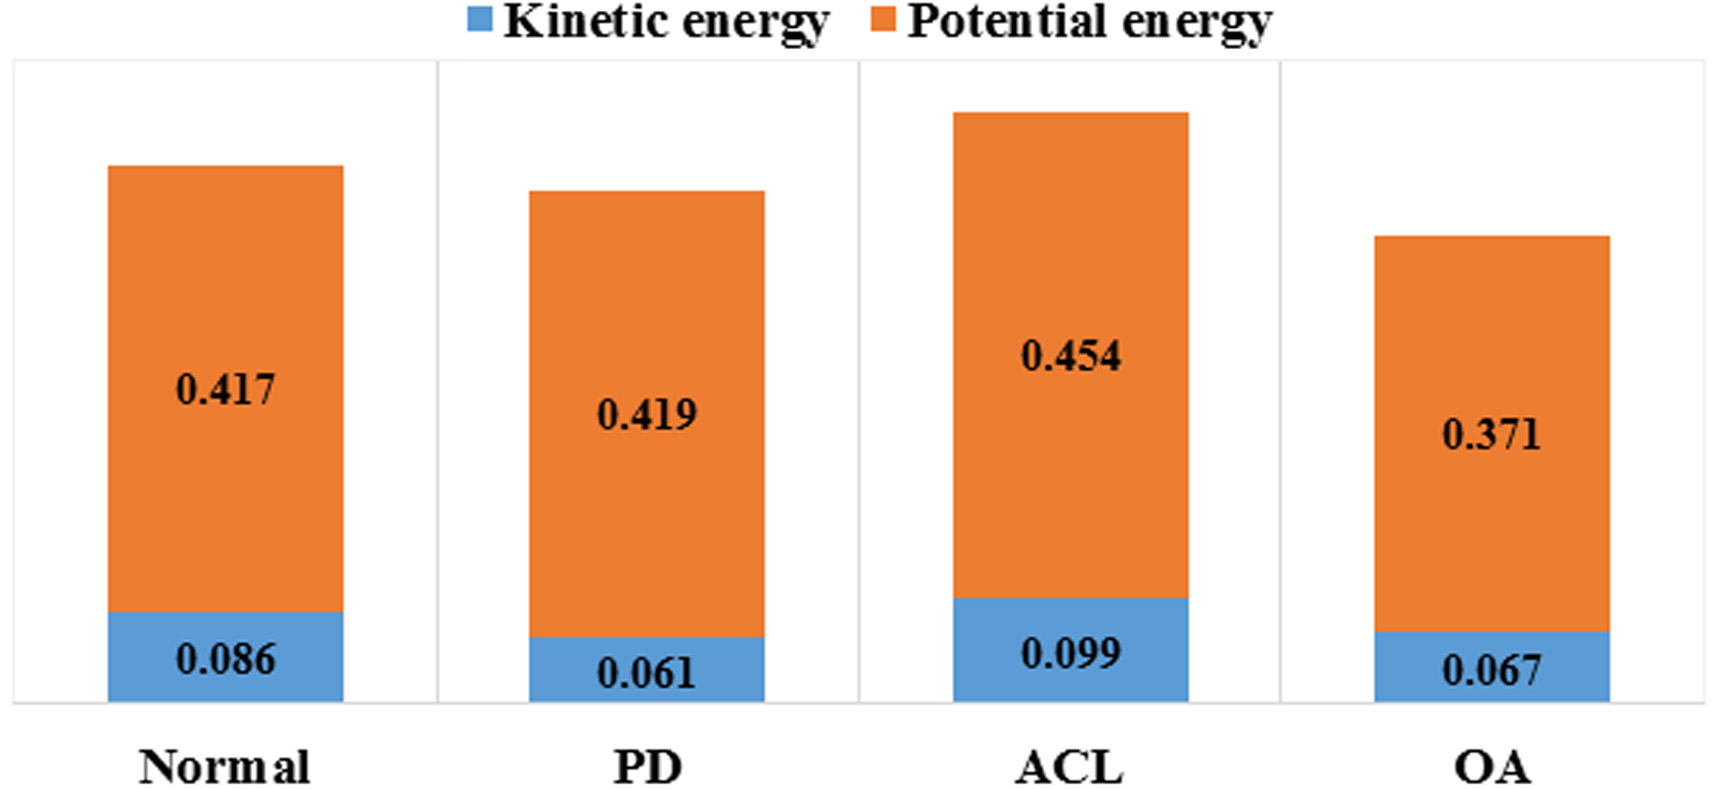
As can be seen from Table 3, there is some differences between kinetic energy of foot, shank and thigh in the ACL reconstructed subject compared to normal subject. Based on the result of various studies, the ACL reconstructed subjects employed special strategy to protect their reconstructed ligament from the applied loads. They try to decrease the knee and hip joints range of motion to decrease the loads applied on the ligaments [18, 19]. However, the result of the current research showed that pattern of their kinetic energy was more unpredictable including in the shank which represents the inability of this ligament to control the motion of the knee joint. The subjects with OA were the other group participated in this study. Tables 1 and 2 shows that compared to normal subjects.
Based on the results of previous studies, OA subject have more limitation to increase their range of motions [20]. It means that the range of motion of the hip and knee joints are less in OA subjects than in normal subjects. The other point is that their walking speed decreased significantly compared to normal subject [20]. The result of this research confirmed that the stiffness and limitation of knee joint in OA subject is high which restrict the ability of subjects to walk. The results of potential and total energy especially in shank, also confined that the ability of subject to walk efficiency decreased significantly compared to normal subjects. Furthermore pattern of total energy of foot in OA subjects was more predictable than normal subjects, but pattern of potential and total energy of thigh was less predictable than that of normal subjects.
Subjects with the Parkinson disease were another group in this study. Previous studies has shown that Parkinson gait characteristics are slower walking speed and smaller steps [21]. Average gait velocity of Parkinson subjects were 0.81
The main limitation of this study was the low number of subjects, especially in OA and ACL groups. That was due to the lack of age matched OA and normal subject that were willing to participate. Therefore, while the results are statistically accurate but further studies are needed to compare OA and ACL patients’ mechanical energy to normal subjects.
In conclusion, results of this research mostly agrees with main hypothesis of this study that the kinetic, potential and total energies differ in subjects with different abilities to walk. It has been shown that disorders which affects the musculoskeletal system directly had more significant effect on the mechanical energy rather than Parkinson which affects the gait indirectly. Findings of this study can help clinicians to better understand nature of these disorders. Mechanical energy analysis offers a useful approach for better understanding these musculoskeletal disorders and suggest more effective treatments.
Conflict of interest
None declared.