



Abstract
BACKGROUND:
Plain radiography, 2-dimensional (2D) magnetic resonance imaging (MRI), and computed tomography (CT) do not precisely display morphology and acetabular coverage in developmental dysplasia of the hip or pincer-type femoroacetabular impingement. Pelvic position and pelvic tilt affect assessment of the acetabular parameters, leading to misinterpretation.
OBJECTIVE:
We tested a 3-dimensional (3D) CT evaluation script to calculate the crossover sign (COS), acetabular coverage and morphology.
METHODS:
To test the method, we constructed a phantom pelvic model, in which the acetabulum was mounted at different coverages of the femoral head, and simulated a COS and the acetabular morphology. Additionally we examined the reliability and objectivity of this method in ten patients with CT scans of the pelvis for conditions unrelated to hip disorders.
RESULTS:
We obtained an average accuracy of the 3D CT evaluation script of
CONCLUSIONS:
Our 3D CT evaluation script permits precise evaluation of the acetabular coverage profile, the presence or absence of a COS and acetabular morphology, independent of patient positioning or pelvic tilt.
Introduction
The diagnosis of bony abnormalities associated with femoroacetabular impingement, as well as developmental dysplasia of the hip, is currently based on assessment of radiographic parameters and osseous projection signs, such as the lateral and anterior centre edge angles, the crossover sign (COS) and the posterior wall sign using plain radiographs [1]. In developmental dysplasia of the hip, the lateral and anterior centre edge angles are smaller than in a normal acetabulum, while pincer femoroacetabular impingement can be characterized by a high lateral centre edge angle and the presence of a positive COS or posterior wall sign. However, these radiographic parameters and osseous projection signs are, unfortunately, limited. They describe only a local part of the acetabulum (lateral and anterior centre edge angles) or the relation between one part of the acetabular rim and another (COS or posterior wall sign) and are partly based on the acquisition of the femoral head centre (lateral and anterior centre edge angles or posterior wall sign). In an aspheric or deformed femoral head, as typically found in developmental dysplasia of the hip and femoroacetabular impingement, this can lead to misinterpretation. Moreover, the radiological parameters are highly affected by the amount of tilt and the position of the pelvis [2, 3]. For these reasons, these parameters are less helpful to identify and quantify acetabular deformity in developmental dysplasia of the hip and femoroacetabular impingement and show little reliability, even with experienced surgeons [4].
Recent studies could show that the underlying projecting phenomenon can only be eliminated by reference against the anterior pelvic plane (APP); otherwise, the reliability of diagnosing pincer-type femoroacetabular impingement or developmental dysplasia of the hip in radiography, 2D magnetic resonance imaging (MRI) or computed tomography (CT) is inherently limited [5, 6, 7]. Additionally, these studies have shown that a standardized methodology based on CT images and computer-generated 3D models leads to an elimination of observer bias and an accurate measurement of the acetabular parameters, independent of pelvic position and tilt [5, 6, 7]. To date no validated method exists, for which reproducible mathematical principles have been shown.
Hence, the goal of this study was the development of a method to describe the acetabular morphology and the cover of the femoral head and to assess the COS and posterior wall sign objectively. This method was based on 3D CT models with morphological parameters measured relative to the APP as a reference plane. In a last step, this method was validated by a phantom model and its clinical application was tested.
Material and methods
Software
A 3D CT evaluation script based on 3D data visualization, analysis and modelling software (AMIRA software; Mercury Computer Systems, Chelmsford, MA, USA) was developed for reproducible and accurate evaluation of the COS or posterior wall sign, acetabular morphology and coverage. The CT datasets were uploaded to AMIRA software and 3D pelvic models were segmented. The APP, consisting of the two anterior superior iliac spines and the pubic tubercles, was marked on the 3D pelvic models. This was the reference for all other calculations. Then the femoral head was segmented, a sphere was projected inside the femoral head and the centre of this sphere, which should represent the idealised femoral head, was calculated (as the centre of the femoral head). Landmarks were placed manually on the acetabular rim and the fossa acetabuli to register the anatomical shape. To calculate the COS or posterior wall sign, the acetabular landmarks and the centre of the femoral head were projected onto the APP. If the anterior acetabular rim was lateral to the posterior acetabular rim, a COS was positive. If the centre of the femoral head was lateral to the posterior wall of the acetabulum, a posterior wall sign was positive. By projection of the APP to the centre of the femoral head, the APP was divided into two segments. Starting from this, the femoral head was divided into eight different segments (Fig. 1). Next, the acetabular landmarks were projected onto the femoral head and the acetabular cover for each of the eight segments was calculated. A plane was calculated using the landmarks of the acetabular fossa; the centre of this plane was linked to the centre of the femoral head and the acetabular landmarks. The resulting angle represents the acetabular morphology, which was shown in 1
Segmentation of the femur head. The femur head was divided into two segments by projection of the APP onto the centre of the femur head. Based on a Cartesian coordinate system, the femur head was further divided to generate eight different segments: APP, anterior pelvic plane; (R)SIAS, right spina iliaca anterior superior; (L)SIAS, left spina iliaca anterior superior; ALS, anterolateral superior; PLS, posterolateral superior; AMI, anteromedial inferior; ALI, anterolateral inferior; AMS, anteromedial superior; PMS, posteromedial superior; AMI, anteromedial inferior; PMI, posteromedial inferior.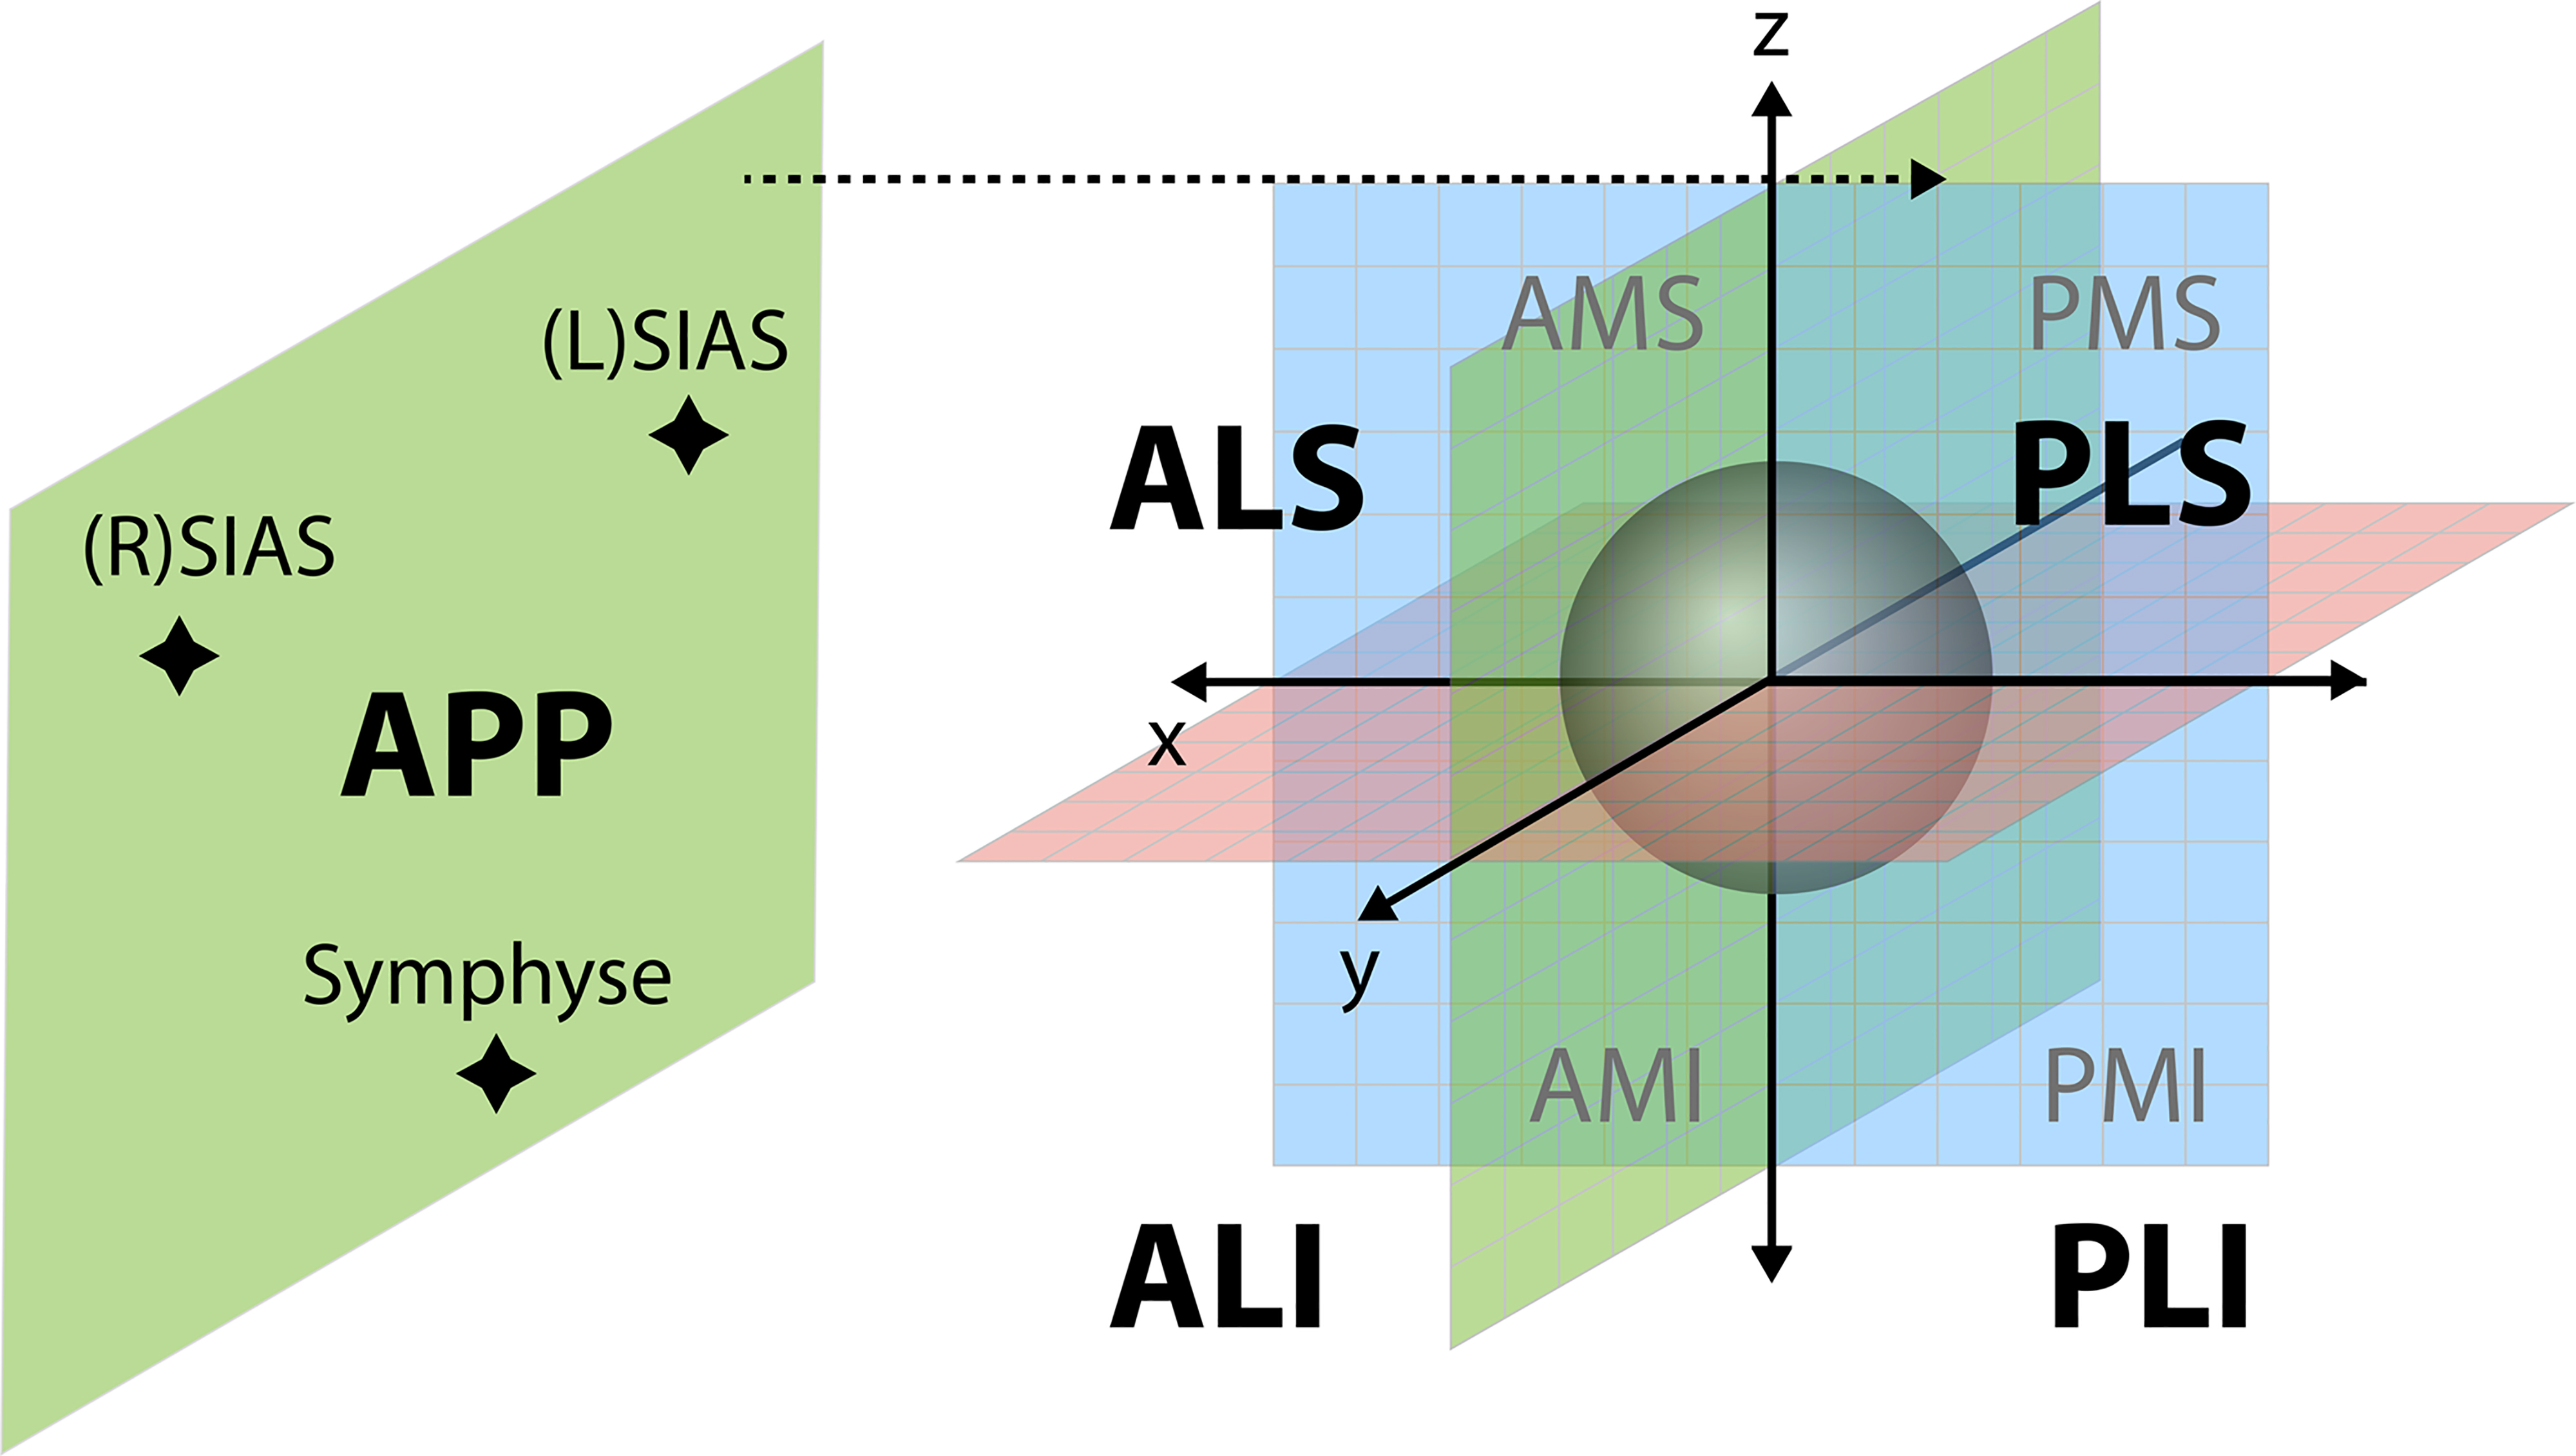
To validate our 3D CT evaluation script, ten patients, without hip pathology, were examined using the same CT protocol employed for the evaluation of acetabular coverage, morphology and COS. Between the individual measurements of each investigator, there was a minimum interval of one day. None of the investigators participated in the analysis of these measurement protocols.
Phantom model
To test the accuracy of our 3D CT evaluation script, a phantom model was constructed to reproduce a simplified human pelvis including a corresponding acetabulum. For this purpose, a square acrylic glass box with an edge length of 60 cm was constructed. Three CT detectable metal markers were fixed to each of the outer walls of the phantom model to define the APP. With the three metal markers on one outer wall, we generated a setting to simulate one specific position of the APP. Inside the box, a construction of acrylic glass bars and metal markers was installed to define the position and shape of the femoral head, the centre of the femoral head, the acetabular fossa and the acetabulum itself. The orientation of the femoral head and the acetabulum in the box was based on which set of metal markers was chosen.
Projection of 12 landmarks against the frontal APP to simulate a COS. Basic position: 12 markers defining the acetabulum placed in one level plain perpendicular to the anterior pelvic plane (APP). The landmarks in the 3 o’clock and 9 o’clock positions, representing the anterior and posterior acetabular rim, were manually adjusted in 1 mm steps, altering the ‘9 o’clock’ marker medially and the ‘3 o’clock’ marker laterally, to simulate different intensities of a COS against the APP.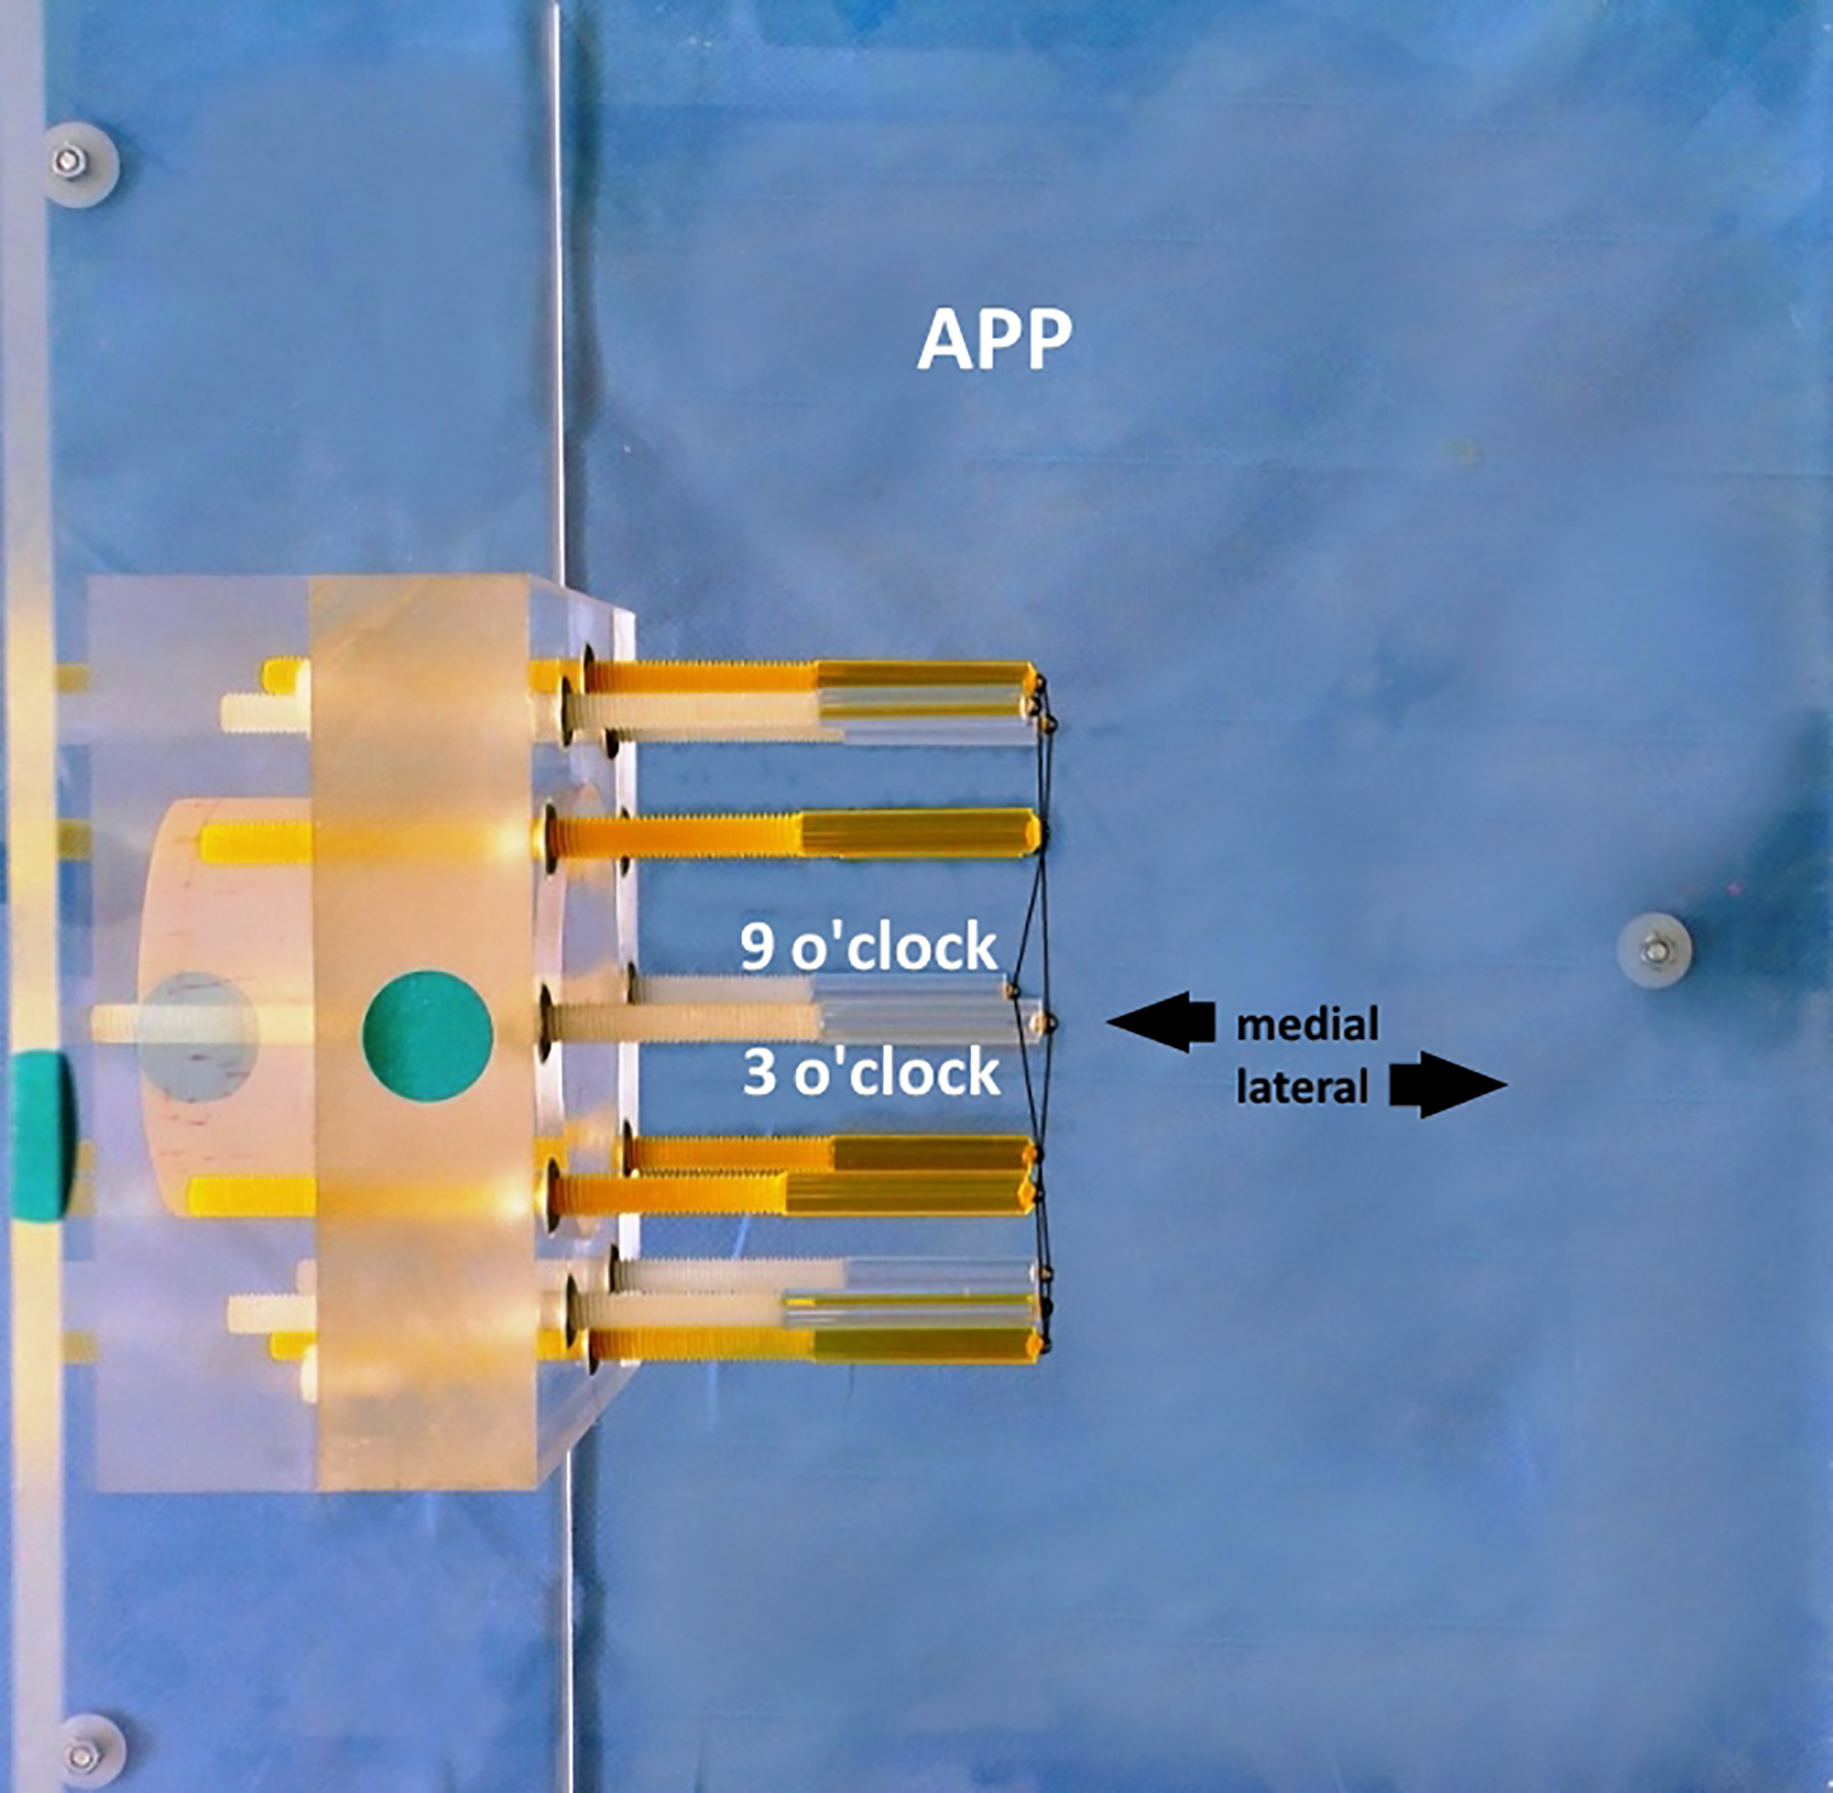
Measurement of the acetabular morphology by detection of the angle 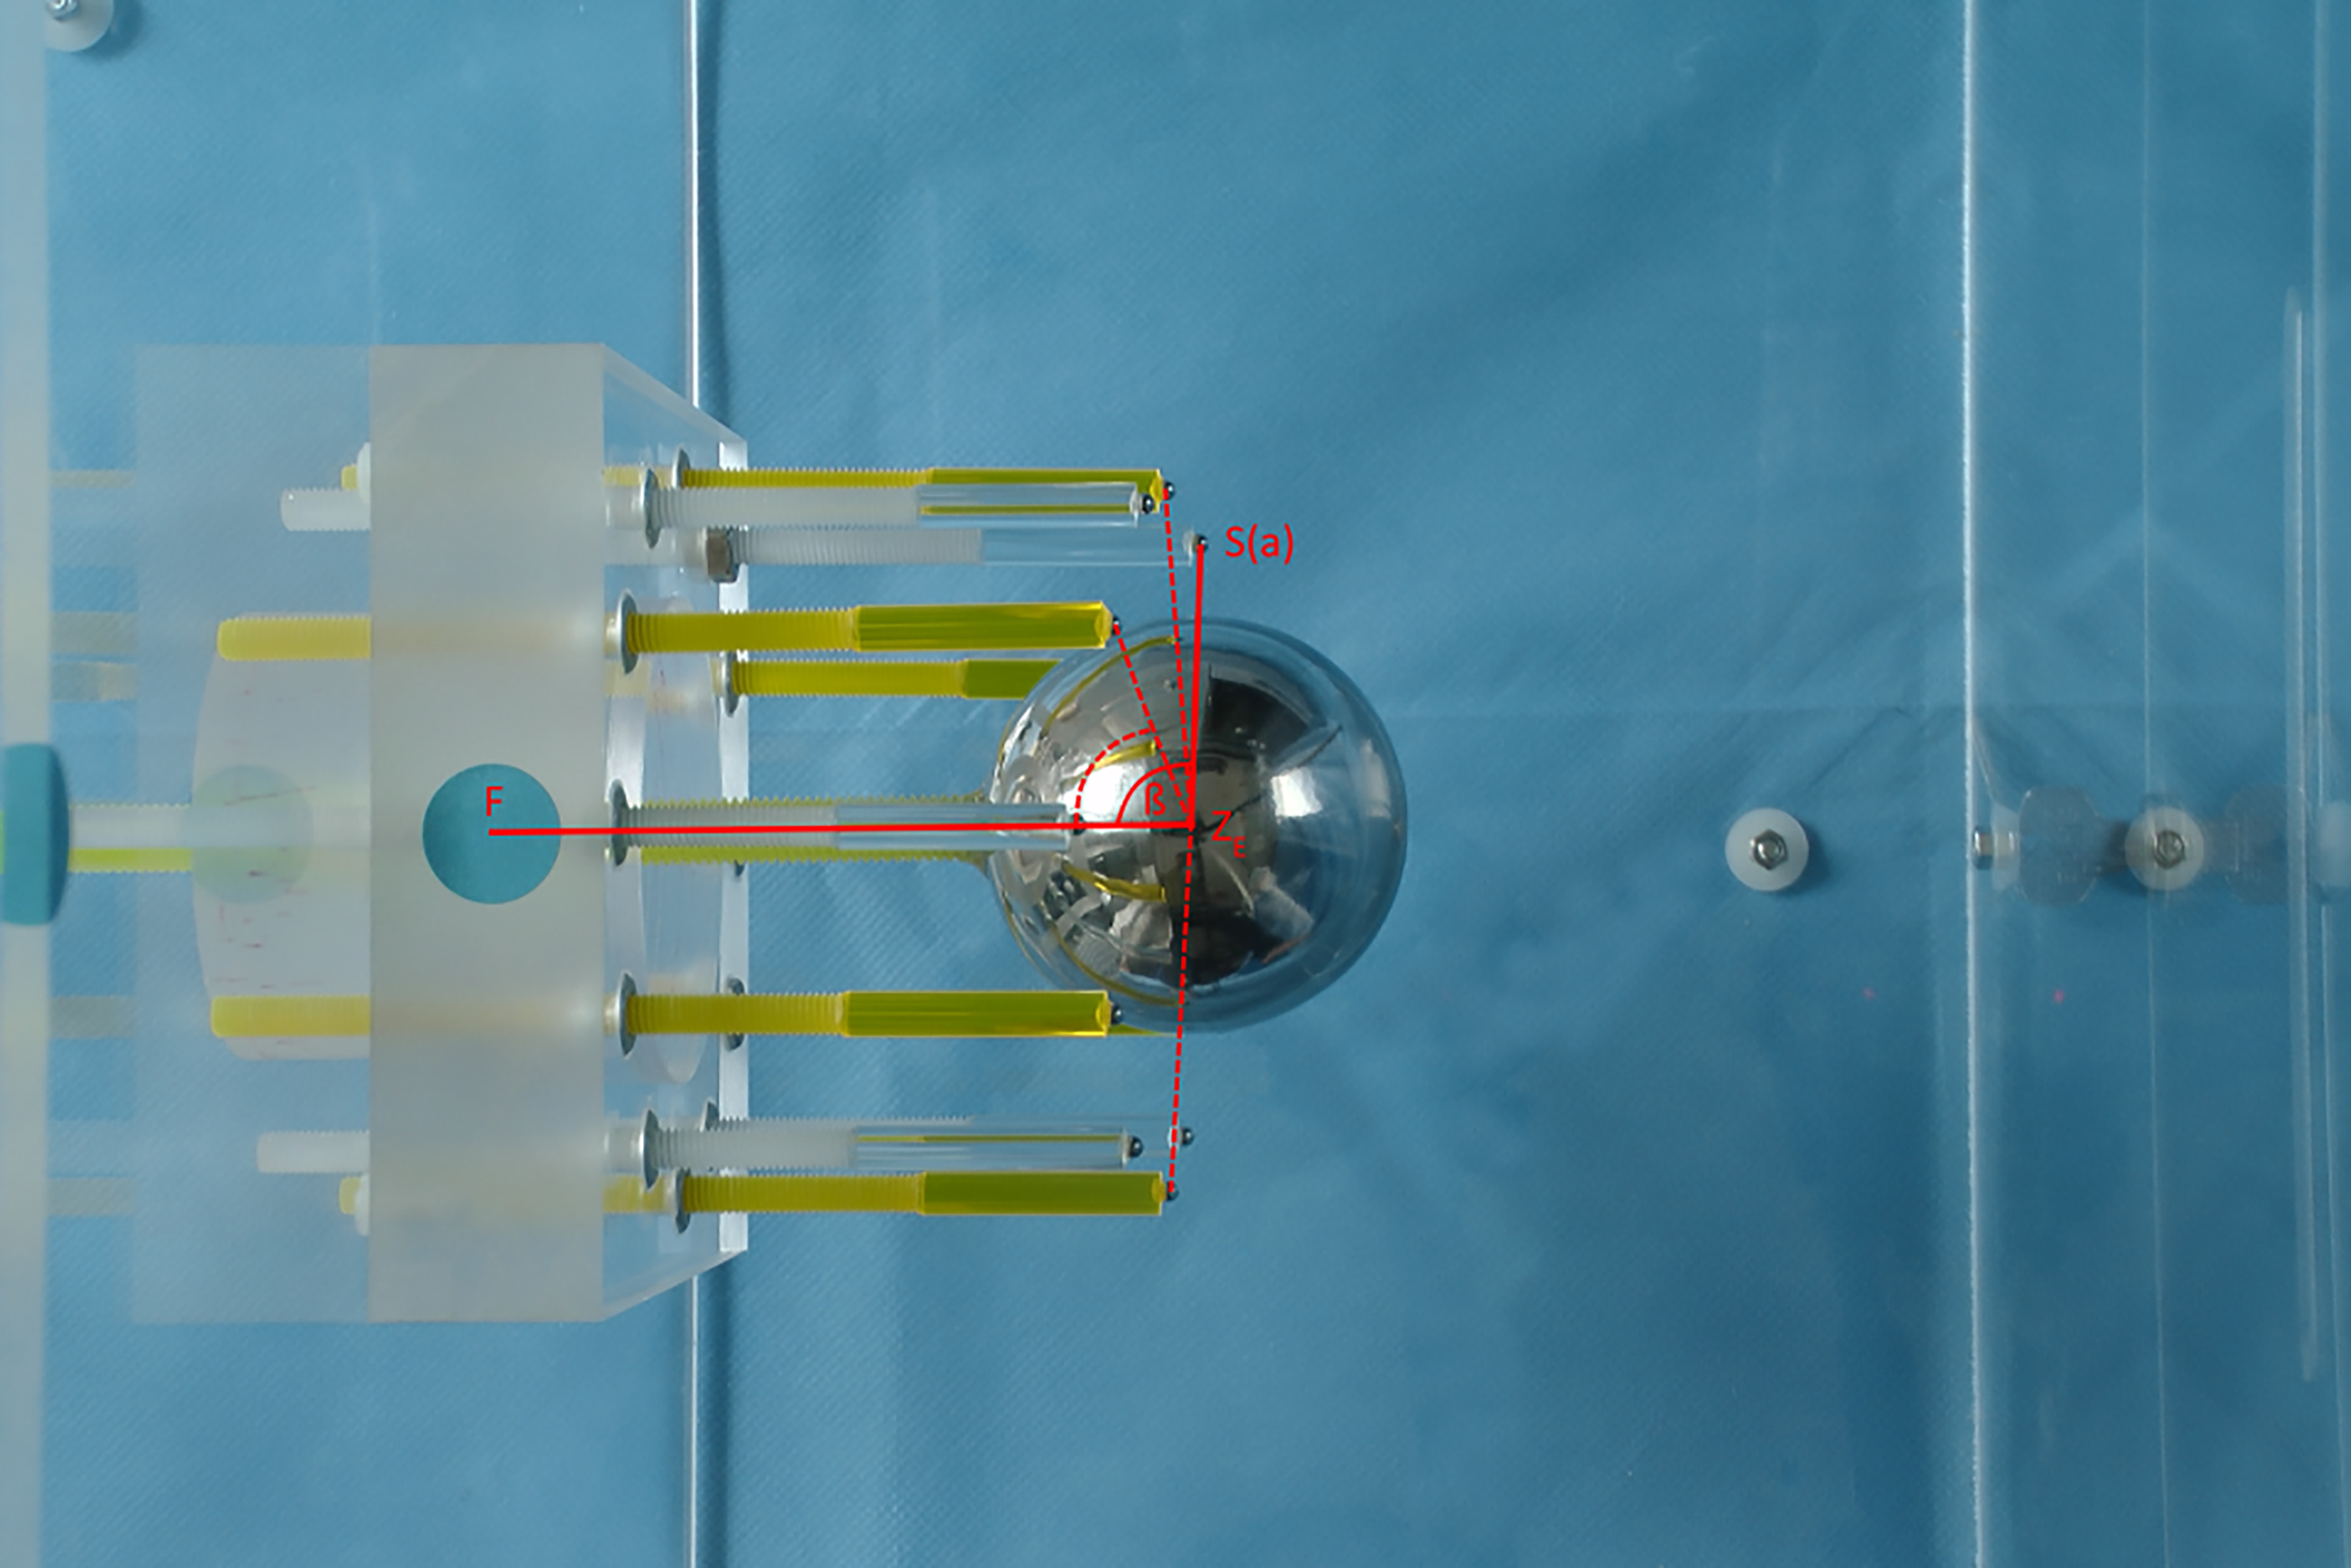
Simulation of the medial part of the true acetabular coverage referring to the frontal anterior pelvic plane (APP). 12 landmarks, representing the acetabular rim, were been placed in one plane perpendicular to the simulated APP. The landmarks of the starting position simulate a coverage of the femur head of 50%.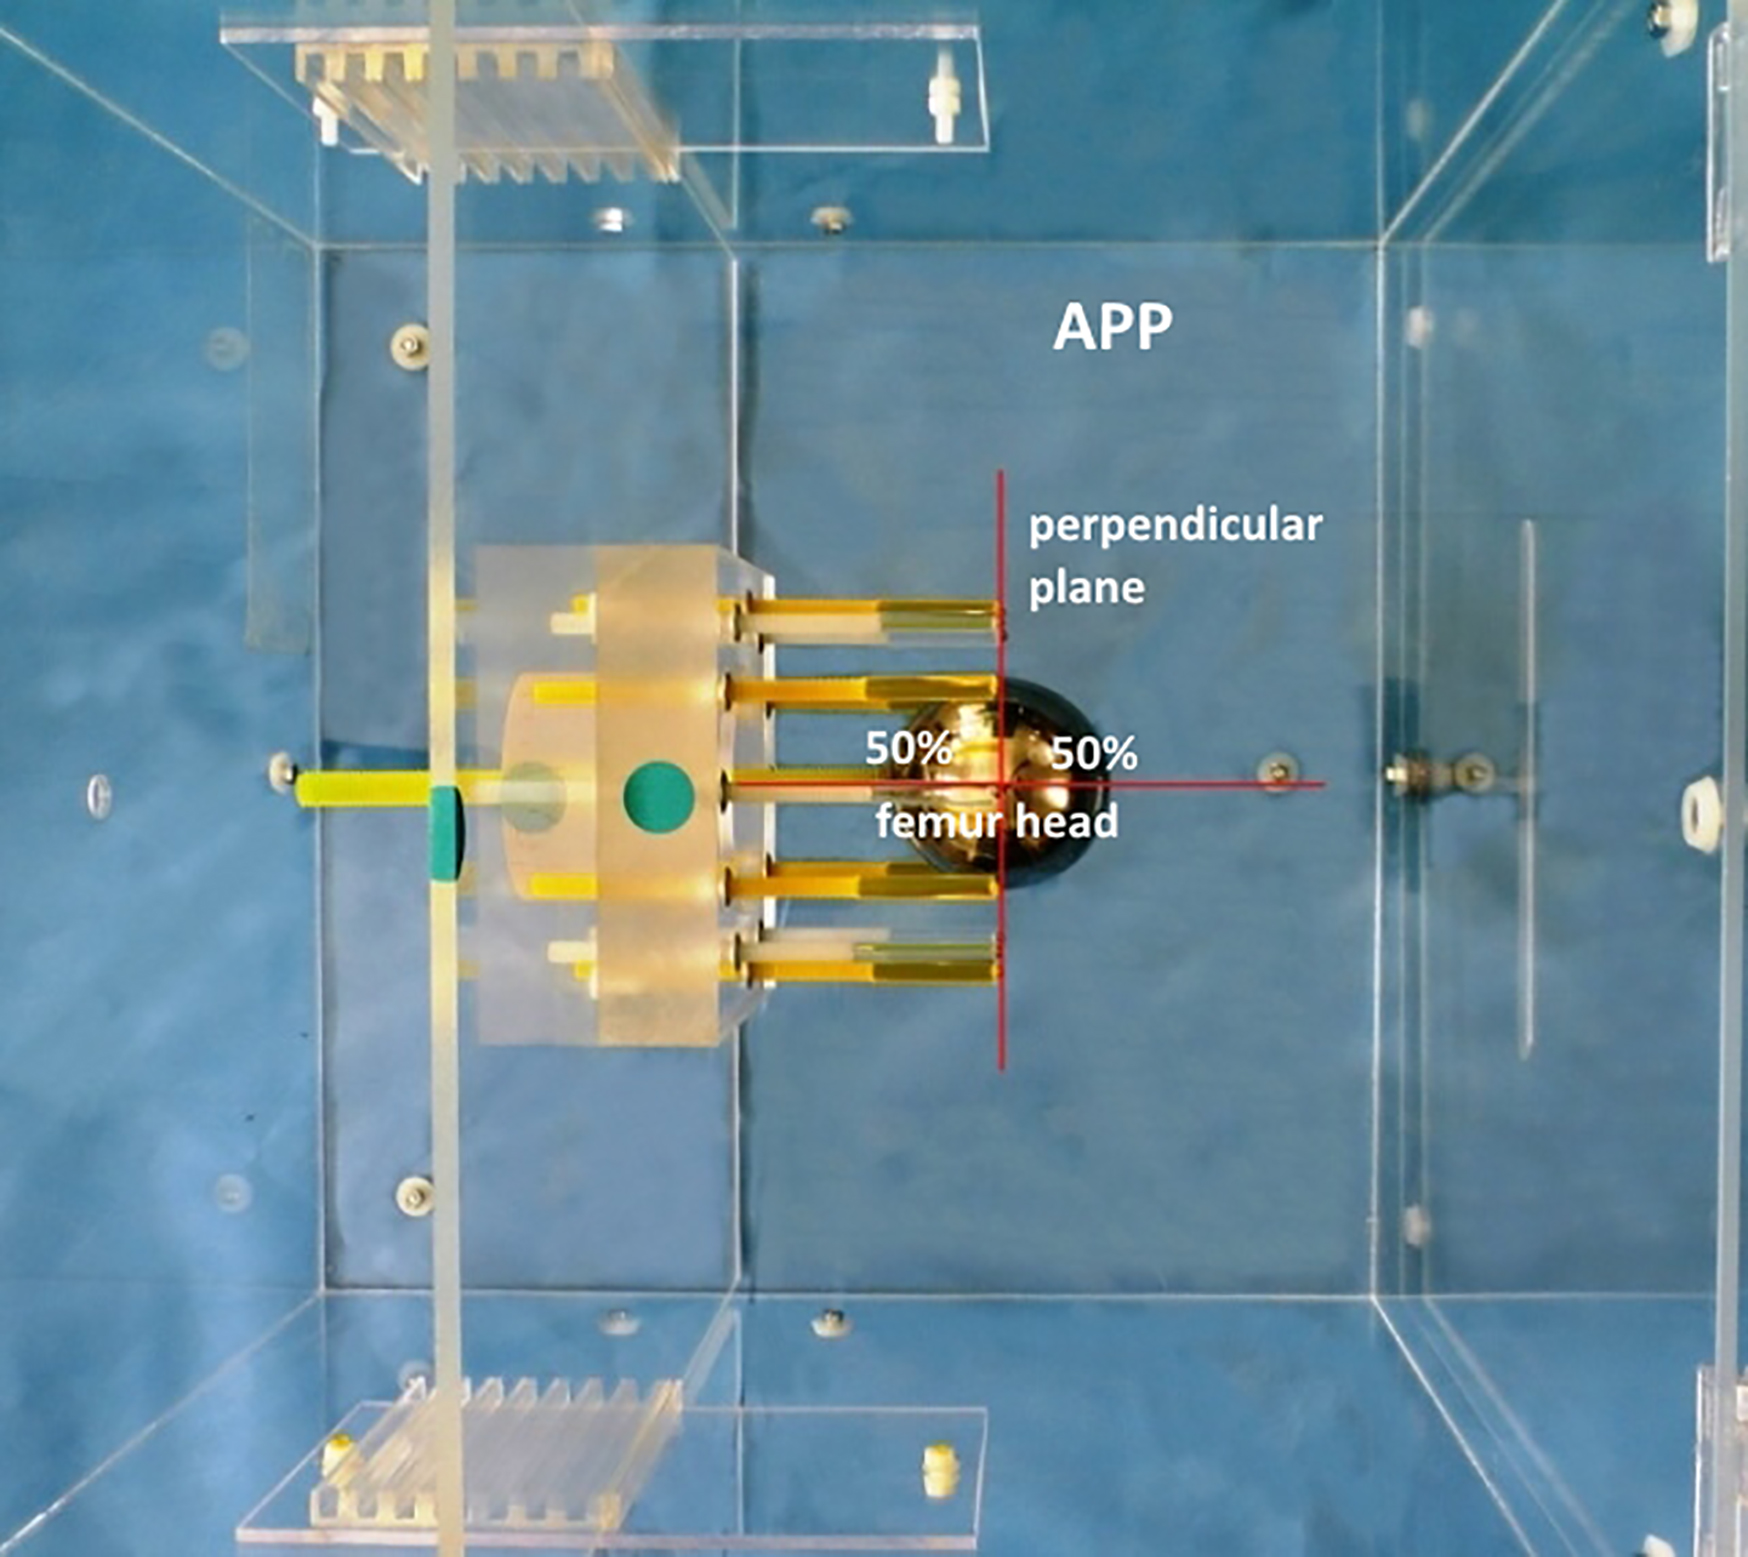
First, the projection of the COS, as found in plain radiographs, was simulated using our phantom model. In the basic position, the 12 markers defining the acetabulum were placed in one level plane, perpendicular to the APP. The landmarks in the 3 and 9 o’clock positions represented the anterior and posterior acetabular rim. These landmarks were manually adjusted in 1 mm steps, alternating the ‘9 o’clock marker’ medially and the ‘3 o’clock marker’ laterally, to simulate different intensities of a COS against the APP (Fig. 2). Our 3D CT evaluation script was then used to identify a COS through the projection of the anterior and posterior rim against the APP. With the phantom model, we simulated six different acetabular configurations. These consisted of a retroverted or anteverted acetabulum and different manifestations of crossover of anterior and posterior acetabular rim. Three different observers tested, twice each, whether the evaluation script revealed a COS.
Morphology
Next, the shape of the acetabulum was simulated in relation to the position of the femoral head. A sphere with a diameter of 4.5 cm was centred over the abstracted acetabular fossa and within the 12 landmarks representing the acetabulum rim. The acetabular landmarks were placed circumferentially around the centre of the acetabular fossa. The distance of the 12 acetabular landmarks from the acetabular fossa could be manually modified in increments of 1 mm. In doing so, the angle
Acetabular coverage
To describe the true acetabular coverage of the femoral head, the femoral head was evenly divided into eight sectors, as previously described. The acetabular cover was described by 12 landmarks representing the acetabular rim. The landmarks of the starting position simulated a cover of the femoral head of 50%. The landmarks were placed in one plane perpendicular to the simulated APP (Fig. 4). Different positions of the femoral head cover could be simulated with the six different APP settings. By altering the reference, in this case the variation of the simulated APP by 90
Computed tomography
The changes of acetabular coverage, morphology and COS obtained by adjusting the acetabular rim landmarks were measured by CT (Somatom Sensation 64, Siemens HealthCare Sector, Forchheim, Germany) using a standardized protocol (120 kV, 50 mAs, collimation 64
Statistical analysis
To determine the accuracy of our 3D CT evaluation script, the differences between the acetabular coverage and morphology measured digitally and manually were calculated and reported in the form of mean, standard deviation and range.
To validate the capability of 3D CT evaluation script to detect a COS, we simulated six different acetabular configurations. Three different investigators tested twice each whether the evaluation script revealed a COS. Thus, we obtained the sensitivity and specificity of the COS assessment.
For the intra- and interindividual agreement (reliability and objectivity) of the in-vivo and ex-vivo measurements, intraclass correlation coefficients were determined using Pearson’s product moment correlation coefficient (
Results
Phantom model
The differences between the acetabular morphology and coverage, as calculated using our 3D CT evaluation script, versus the values simulated by the phantom model are presented for each investigator in Table 1.
Acetabular morphology and acetabular coverage assessed with our new 3D CT evaluation script on a phantom model by three different observers
Acetabular morphology and acetabular coverage assessed with our new 3D CT evaluation script on a phantom model by three different observers
Values are expressed as mean
The 3D CT evaluation script showed an average accuracy of
For the ex-vivo phantom investigation, high intraindividual reproducibility for each of the three measurements could be shown, with respective intraclass correlation coefficients ranging from
The interindividual reproducibility for each of the three investigators was excellent and showed intraclass correlation coefficients ranging from
We calculated the presence or absence of the COS in reference to the APP and found significant accordance between the COS simulated by the phantom model and the COS calculated by our 3D evaluation script (
In our study group, we identified a COS in three of ten patients, with a high reproducibility for each of the three investigators (
Discussion
The assessment of radiographic parameters and osseous projection signs indicating femoroacetabular impingement or developmental dysplasia of the hip using plain radiographs is highly inaccurate because of individual pelvic orientation [3]. In this study, we developed a simple and reproducible method for objective and accurate identification of acetabular coverage and morphology, COS and posterior wall sign. Moreover, the reliability, objectivity and accuracy of this 3D CT evaluation script was tested using a phantom model. We obtained high reliability, objectivity and accuracy with our new 3D CT evaluation script.
Former studies exist that have calculated the acetabular morphology, femoral head cover and acetabular orientation in a normal population, as well as femoroacetabular impingement and developmental dysplasia of the hip [5, 8, 9, 10]. These studies reported on intra- and interobserver reliability but, to our knowledge, no controlled testing of the accuracy has been made so far. However, our results on intra- and interobserver reliability are only partly confirmed by the current literature. Janzen et al. [11] calculated the cranial acetabular morphology in 10
Altogether our results about reliability are comparable to those of other studies. Dandachli et al. [7] reported an interobserver reliability of acetabular cover and orientation in a normal population and in patients with developmental dysplasia of the hip of 0.96 and an interobserver error of 0.3
While the mathematical principles of calculating the acetabular morphology are comparable, there are some methodical differences in the set-up of these calculations. Dandachli et al. [7] used 20 landmarks, representing the superior rim of the acetabulum, which were projected on the femoral head. Then the femoral head, with the acetabular landmarks, was projected onto a horizontal plane. Through this method, it was possible to estimate the coverage of the femoral head as a percentage of the upper half of the femoral surface area.
However, owing to the projection of the landmarks on a plane, a distinct calculation of the surface was not possible, as in our study. Moreover, assessment of the coverage in the peripheral parts is markedly imprecise. Owing to the projection of a curved surface on a plane, the coverage assessed in the centre does not correspond to the coverage as assessed in the periphery. Minimal measuring errors would lead to markedly different results in assessing the acetabular coverage.
The calculations were made with standardized X-ray and CT images to enable a reliable assessment of the COS using the software Hip
To date, the assessment of the COS is made on the a.p. pelvic X-ray. Reports on diagnostic accuracy of the COS and posterior wall sign are controversial, because they can be influenced by different factors, such as pelvic tilt, picture quality, incorrect film focus distance or incorrect centring of the X-ray.
In conclusion, our refined 3D CT technique for acetabular coverage measurement could show high reliability and accuracy. It is a precise and helpful tool in diagnosis, quantification and surgical planning for hip pathologies, such as developmental dysplasia of the hip and femoroacetabular impingement.
Conflict of interest
None to report.