



Abstract
BACKGROUND:
Foot deformities are serious problems in the elderly as they increase the risk of falling.
OBJECTIVE:
This study aimed to examine the relationship between foot plantar pressure during gait and hallux valgus (HV).
METHODS:
Foot-pressure data were recorded using an F-scan II system. We analyzed the entire waveform of plantar pressure during gait from 37 healthy adults using principle component analysis (PCA), conducted using a 370
RESULTS:
The PCA clarified that the 2nd, 3rd, and 5th PCVs (PCV 2, 3, and 5) were related to HV (
CONCLUSIONS:
The larger plantar pressure of the HV group around the hallux area during walking compared with the non-HV group is a dominant difference in plantar pressure features due to HV.
Introduction
Foot deformities are a serious social problem for the elderly because they increase the risk of falling [1, 2]. Hallux valgus (HV) is one of the most common foot deformities. It has been reported that approximately 23% of adults aged 18–65 years and 35.7% of adults over 65 years of age have HV [3]. Surgery intervention, which requires huge cost, is the most commonly used treatment for HV. Therefore, the prevention of foot deformities such as the HV before the onset of symptoms is important, and a method to understand the foot condition of an individual is needed.
HV affects plantar pressure during walking. Martínez-Nova et al. reported that a patient group with mild HV tended to have greater plantar pressures around the hallux area during walking compared to a control group [4]. Therefore, several plantar-pressure-related parameters, such as the peak of the pressure value, timing of plantar pressures, and time integral, are used for evaluating foot condition [5].
Although previous studies provided various insights into the plantar-pressure features of people with HV during walking, these studies analyzed only a portion of the whole gait data. Nigg et al. [6] recently noted that the success of this approach depends on the selection of variables made by the investigators, and the approach can fail in obtaining potentially interesting results in the large portions of data left unanalyzed. On the other hand, principle component analysis (PCA) has recently attracted increasing interest in biomechanical studies on overall human gait features [6, 7, 8, 9, 10, 11, 12]. PCA is a statistical multivariate analysis method that summarizes information on multiple correlated variables by using a small number of uncorrelated parameters (principal components). PCA creates principal component vectors (PCVs) and a set of principal component scores (PSCs) for each PCV. Each PCV corresponds to an axis of variance, and a PCS projects the data input into each PCV. Movements with dominant differences (large variances) arise in lower PCVs and vice versa. Moreover, the waveforms related to each PCV can be reconstructed by adding it to or subtracting it from the average vector. Therefore, we considered that PCA would provide further information on the plantar-pressure characteristics of people with HV during walking.
The objective of this study was to clarify the characteristics of plantar pressure in patients with HV by using PCA. By focusing on the whole gait data, we hypothesized that not only the peak values of plantar pressure, which were reported by the previous study, but also the time-series characteristics may be features that describe the HV gait pattern.
Demographic data on the subjects
Demographic data on the subjects
Subjects
Thirty-seven subjects (all female; mean age of 47.2
Experimental protocol
Gait experiments were conducted to measure the plantar pressure of participants during walking. The data were collected using the F-scan II plantar pressure measurement system (Nitta corporation, Japan). This system can measure plantar pressure by using an insole-type pressure sensor with a maximum of 955 sensing points [13]. Each participant wore experimental shoes in which F-scan II sensor sheets were installed. Plantar pressure data were calibrated based on the individual’s body weight (kg), and the insole sheets were calibrated according to the instructions in the F-scan II user manual. The plantar pressure data during gait was recorded at 100 Hz. After the calibration protocol, each participant was asked to walk at their normal speed along a 10-m walkway for 10 times.
Calculation method of the hallux valgus angle (
HV is defined by the HV angle, which is greater than or equal to 20
Data analysis
Based on previous studies [16, 17, 18] and the anatomical foot structure, raw plantar pressure data were summarized for the following seven areas: (1) heel, (2) lateral midfoot, (3) center midfoot, (4) lateral forefoot, (5) center forefoot, (6) head of first metatarsal, and (7) great toe. The pressures of each area were time-normalized by the stance phase duration determined from the plantar pressure and divided into 51 variables. Thus, each trial corresponded to a dataset of 357 variables (i.e., 51 time points for 7 areas).
We applied PCA to a correlation matrix of 357 variables calculated from 370 data points (five trials
Independent
Results
Hallux valgus angle
In the investigation of the HV angle, 21 of the 37 participants were classified as having HV in one or both feet, and 16 were classified non-HV. The mean HV angles of the HV group were 26.1
Results of main PCA
Results of main PCA
*
Plantar pressures recombined from the PCS of PCV 2, 3, and 5. Areas of foot plantar pressure are as follows: (1) heel, (2) lateral midfoot, (3) center midfoot, (4) lateral forefoot, (5) center forefoot, (6) head of first metatarsal, and (7) great toe.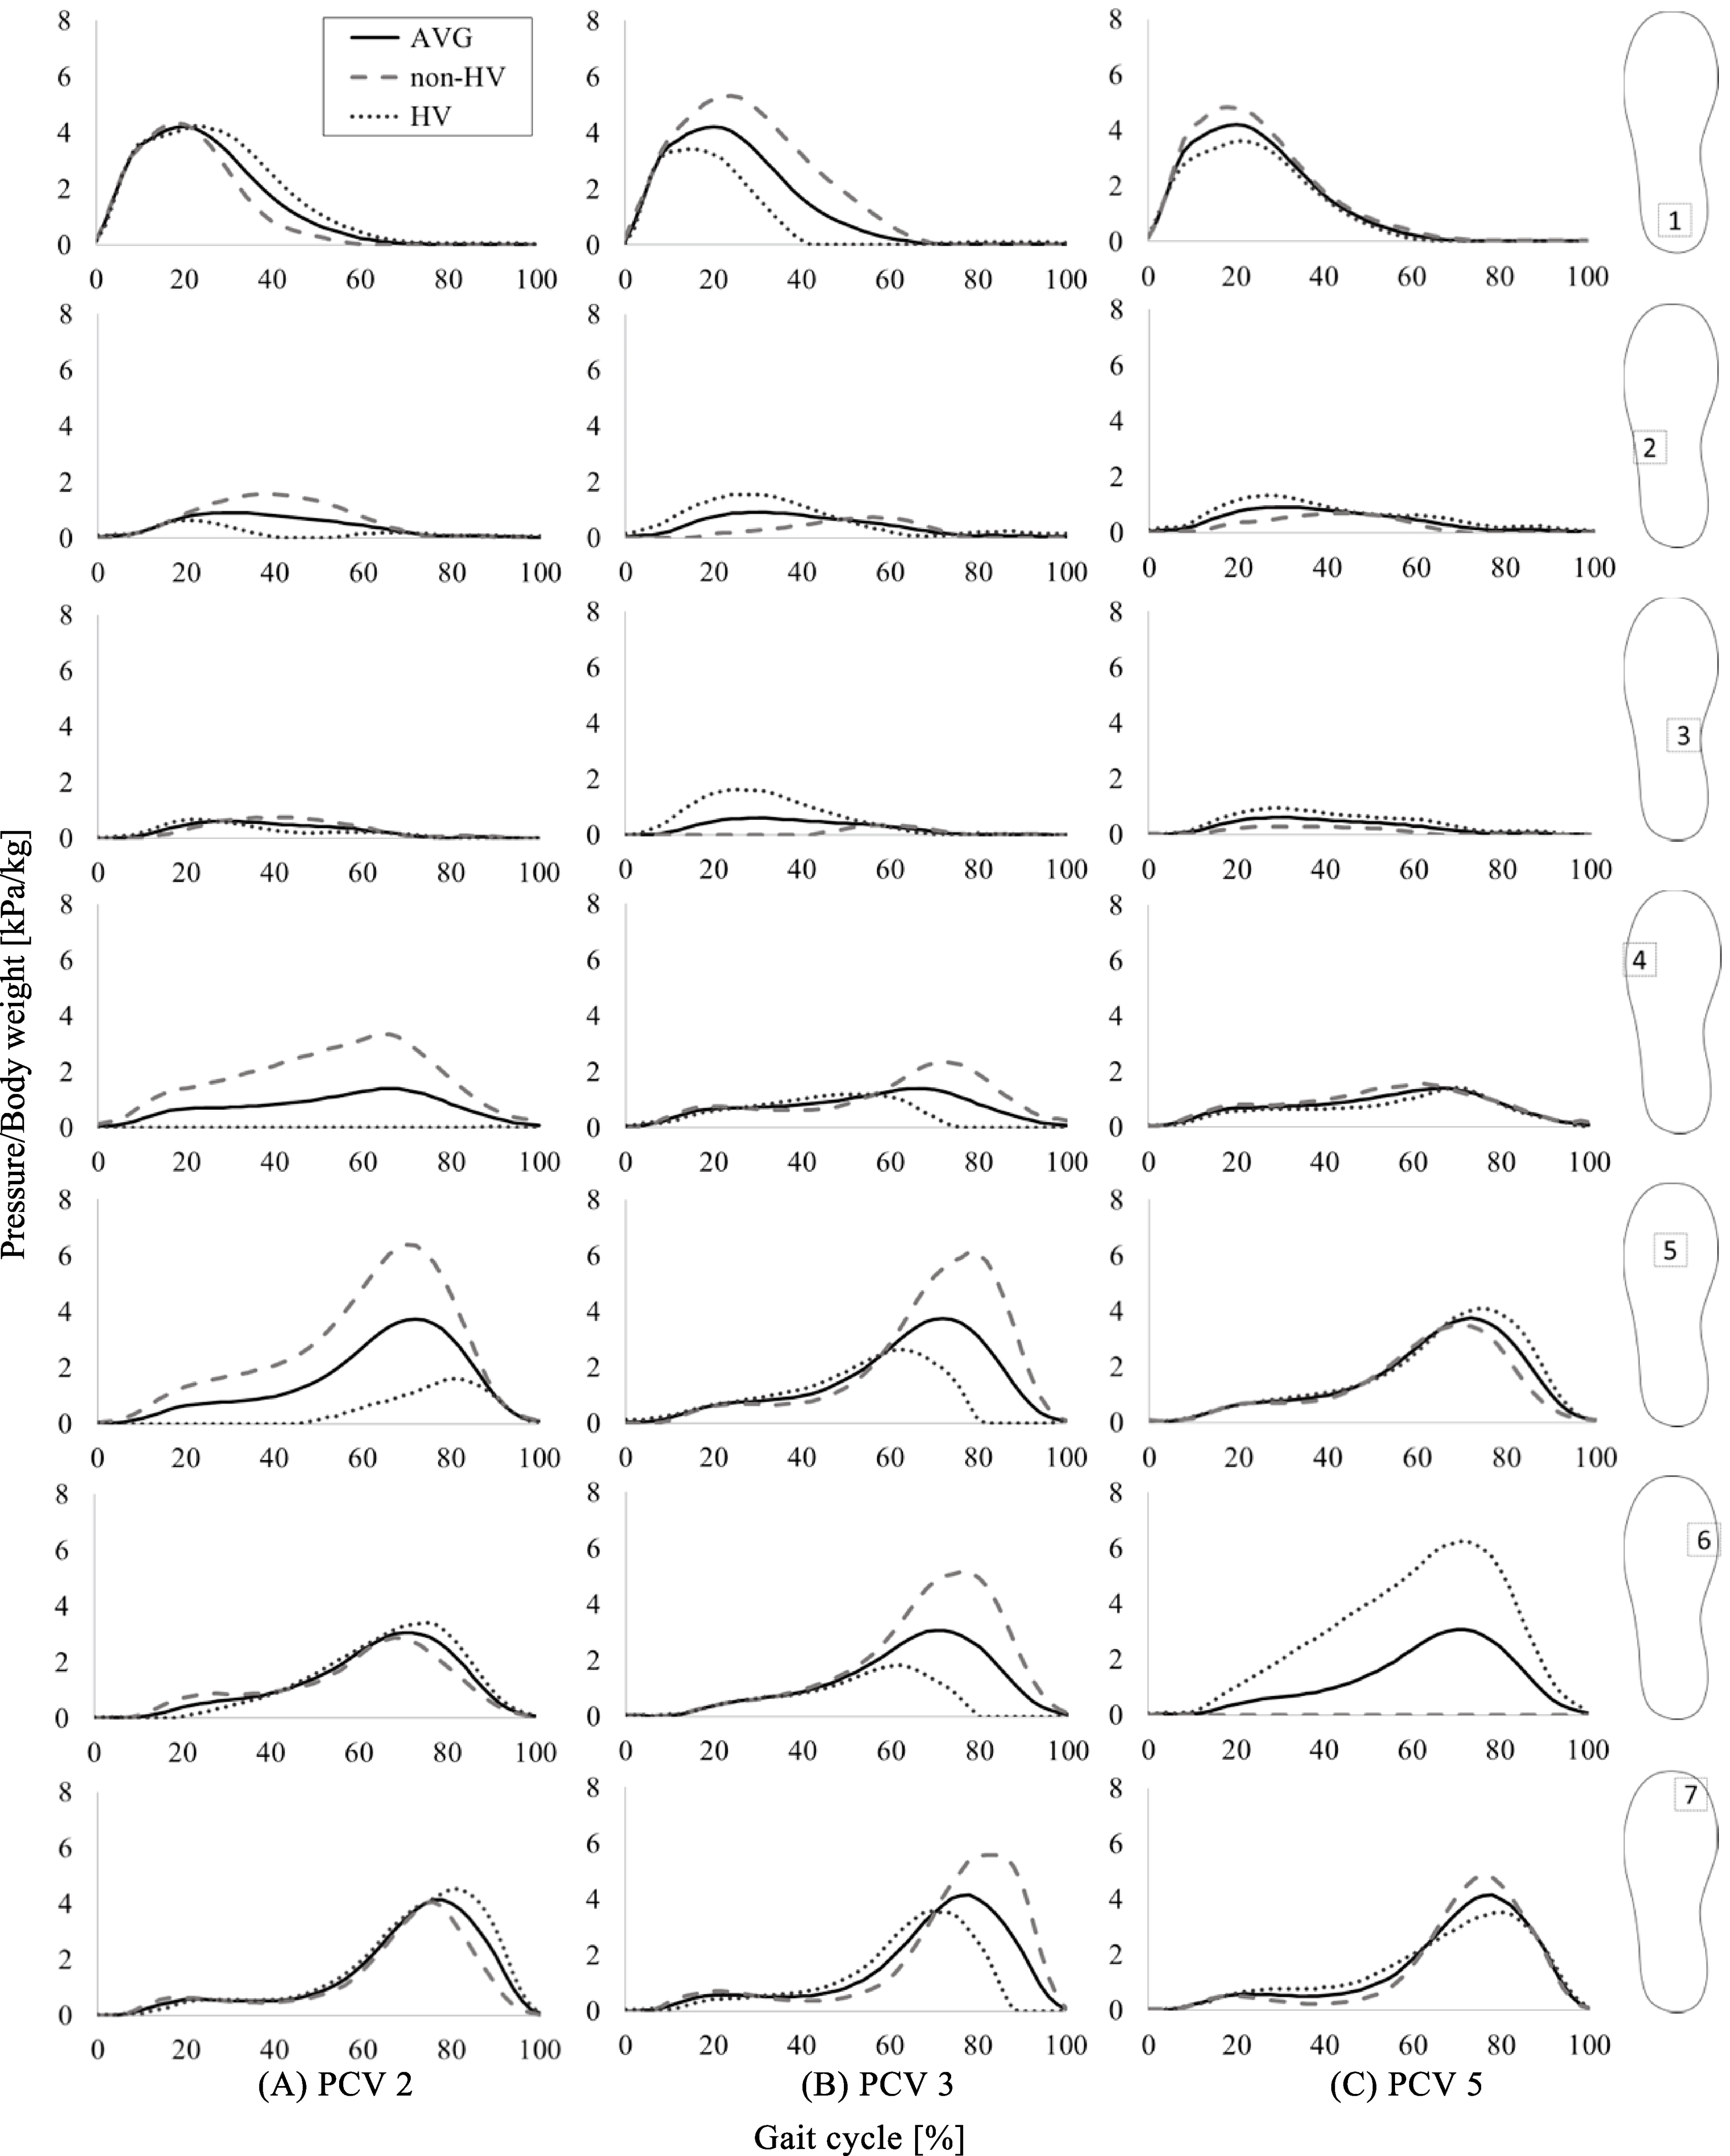
The PCA results revealed that the first 38 PCVs explained more than 90% of the plantar pressure data (Table 2). Of these PCVs, this study focused on the first five, each of which explained more than 5% of the total variance. The first five PCVs explained nearly 51% of the variance. The explained variance and the results of the t-tests are summarized in Table 2. PCV 2, PCV 3, and PCV 5 showed significant differences between the HV group and the non-HV group. On PCV 2 and PCV 3, the non-HV group had a greater PCS compared to the HV group (
Figure 2 shows the reconstructed plantar pressure waveform from the PCS of PCV 2, PCV 3, and PCV 5. Black solid lines indicate the average. The gray dashed lines in Fig. 2 indicate the reconstructed waveform for large positive deviations (
In PCV 2 (Fig. 2A), the HV group tended to exhibit slightly larger plantar pressures compared to the non-HV group in areas 1 (during the mid-stance phase), 6 (during the late-stance phase), and 7 (during the late-stance phase) and smaller pressures compared to the non-HV group in areas 2, 4 and 5 during the entire stance phase. On PCV 3 (Fig. 2B), the non-HV group tended to show larger plantar pressures compared to the HV group in areas 1 (during the mid-stance phase), 4–7 (during late-stance phase). On PCV 5 (Fig. 2C), the HV group tended to exhibit a larger plantar pressure compared to the non-HV group in area 6 during the entire stance phase.
Discussion
The aim of this study was to clarify the characteristics of plantar pressure features of patients with HV by using PCA. For the PCSs of PCV 2, 3, and 5, significant differences were observed between groups.
It has been reported that a patient group with mild HV tended to indicate a significantly larger maximum plantar pressure around the hallux area during walking compared to a control group [4]. Such a feature was observed throughout the stance phase in the reconstructed waveform of PCV 5 (area 6) in this study. In PCA, plantar pressure features with dominant differences arise in lower-numbered PCVs. Therefore, we can conclude that the larger plantar pressure of the HV group around the hallux area during walking compared to the non-HV group, as reported in the previous study. This is one of the dominant differences in plantar pressure features during walking related to HV.
Further, we found that the non-HV group showed a larger plantar pressure compared to the HV group in the heel area in the mid-stance phase (PCV 3). Similarly, compared to the HV group, the non-HV group has larger plantar pressures in the mid-foot area (PCV 2 areas 4 and 5, and PCV 3 areas 5, 6 and 7). These features were not reported in previous studies and may potentially be used in the evaluation protocol of one’s foot condition. PCA could analyze not only the peak values but also the entire waveform of plantar pressures. According to the above results, the constructed waveform of plantar pressure differences have features of the HV group, and it can be thought that changes in PCA are related to changes in plantar pressure.
Certain considerations must be acknowledged when interpreting the results of the current study. First, the design of this study is retrospective research. Longitudinal research may be needed to fully understand the mechanisms by which daily plantar pressure features affect HV. Second, in order to focus on the subjects’ normal walking pattern, the subject was asked to walk naturally at their usual speed. Further research may be needed to consider the effects of walking speed on plantar pressures because the comparability of our experiment is restricted. Third, judgments concerning the significance of differences were made based on whether the
Conclusion
In the present study, we found a significant difference between the presence or absence of HV and plantar pressure during gait by using PCA. Statistical analysis clarified that PCV 2, 3, and 5 among 38 generated PCVs are related to HV. We found that 1) the HV group tended to exhibit a larger plantar pressure around the hallux area compared to the non-HV group, as reported in a previous study, and 2) the non-HV group tended to exhibit a larger plantar pressure around heel area and mid-foot area compared to HV group. In conclusion, these features may potentially be used in the evaluation protocol of foot condition to prevent foot deformities such as hallux valgus.
Footnotes
Acknowledgments
This work was supported by JSPS KAKENHI Grant Number 16K16478. The authors would like to thank all subjects as well as Ms. Yuko Kawai and Ms. Miho Ono for their support in data acquisition and analysis.
Conflict of interest
None to report.