
Abstract
BACKGROUND:
The study of the brain network based on the basis of the resting-state functional Magnetic Resonance Imaging (fMRI) provided some promising results to investigate changes in connectivity among different brain regions because of Alzheimer’s disease (AD).
OBJECTIVE:
In addition, the graph theory has been utilized as an efficient tool in diagnosing Alzheimer and in finding the developed differences in the brain as the result of this disease.
METHODS:
This study considers 16 areas of the brain, which play a major role in the development of AD. Accordingly, the time series and the correlation matrix were yielded for each of these areas. Then, by using threshold we obtained functional connectivity from correlation matrices along with the brain graph parameter for Normal Controls and AD groups were obtained in order to compare the existing differences.
RESULTS:
The differences of characteristics among healthy individuals and patients suffering from Alzheimer has been investigated in this study through the formation of brain graphs for 16 areas and the utilization of data on Normal Controls (13 persons) and patients suffering from Alzheimer (13 patients).
CONCLUSIONS:
Some of the properties of the graph are the characteristic path length, the clustering coefficient, the local and global efficiency yield of ability to separate the two groups which may be used to diagnose Alzheimer.
Introduction
The world’s population is aging rapidly and the current rate of Alzheimer cases standing at 36 million is expected to rise to over 65 million by 2030. Primary care physicians and specialists alike will encounter older adults with dementia at an increasing frequency during their careers. Alzheimer carries significant implications for patients and their families as well as the society as a whole; therefore, it is imperative for well-rounded physicians to have a solid and more comprehensive understanding of this disease. Alzheimer which accounts for approximately 50%–80% of all dementia cases is in fact a progressive and interruptive disease which literally degenerates the nervous system. In terms of histopathologic, the neuropathological hallmarks of AD are the accumulation of amyloid-
Moreover, the graph theory can effectively describe the different aspects of the brain network by calculating the integration and segregation measures. The neurodegenerative process of AD includes changes in the functional connectivity between various regions of the brain [7]. The rs-fMRI is a non-invasive method that is used to diagnose Alzheimer where changes are examined and measured using MRI when the patient is in the resting state. Rs-fMRI, in principle, measures the brain activity by quantifying the blood oxygen level-dependent signal, whereby an increased oxygen level is observed in activated regions of the brain due to increased blood flow. Various rs-fMRI studies have reported the existence of resting-state networks which are characterized by spontaneous fluctuations in the blood oxygen level-dependent. A network that is related to AD and has increasingly received attention is the default mode network (DMN) [8] which is also known as the ‘task-negative’ network (anti-correlated to ‘task positive’ network).
AD compromises primary brain targets, such as the DMN by disrupting their functional activity [10], as well as the functional connectivity between primary targets and the remaining parts of the brain. Some studies have reported that functional changes appear well before the changes in structural MRI become evident [11]. The preliminary evidence of disrupted functional connectivity and its associated with AD have led researchers to hypothesize that proper quantification of the functional connectivity across different brain regions can capture the global distribution of the abnormalities present in AD and can further aid in AD classification [12]. Furthermore, graph hypothesis has been applied in many studies on a large scale to diagnose various brain diseases. Graph theory offers at least two important advantages in comparison with other network approaches [13]. First, it provides for each node quantitative measurements that incorporate connectivity information from the complete network, reflecting the integrated nature of local brain activity. For example, the hubs can be defined as nodes that make information processing in a graph more efficient and increase a network’s robustness to random failure [14]. A second advantage of graph theory is that it provides a general language that enables direct comparison of graphs that describe different types of data (e.g. functional connectivity vs. anatomic connectivity). For these reasons, graph theory seems to be promising framework to disentangle how various pathological processes in AD such as special patterns of cortical atrophy and functional disruptions are associated with each other and why the disease propagates along specific routes.
Methods
As mentioned previously, this study considers 16 areas of the brain, which are actively involved in the development of Alzheimer include the contortion of the dorsolateral of the left superior frontal gyrus, dorsolateral of the right superior frontal gyrus, left middle frontal gyrus, orbital part of the left middle frontal gyrus, opercular part of the left inferior frontal gyrus, right olfactory cortex, right medial superior frontal gyrus, right insula, right posterior cingulate gyrus, left calcarine fissure and surrounding cortex, right lingual gyrus, right supramarginal gyrus, left caudate nucleus, left middle temporal gyrus, right middle temporal gyrus [15].
Data acquisition
Resting fMRI data and structural MRI scans were acquired with 3.0 T Philips scanners. The rs-fMRI images obtained through the utilization of EPI have the following parameters:
Time of repetition (TR)
All images have been obtained at 140 functional volumes. For the purpose of this study, 13 AD patients (age range of 63–83) and 13 Normal Controls (age range of 65–83) were selected.
Data pre-processing
The objective of conducting data pre-processing is to eliminate the unwanted variables and improve the relative performance of signal to noise ratio, and also prepare the data for statistical analyses. Accordingly, the tool box SPM12 was used to carry out the pre-processing of the fMRI data. The pre-processing includes the correction of difference in time intervals among the slices of any volume of brain that has been subject to imaging in order to eliminate time delays during imaging between respective slices in conjunction to the correction of head motion by taking into account six transitional and rotational parameters. After the pre-processing stage, quality control is performed to measure the quality level and ensure suitability and obtain the maximum head motions of three transitional parameters and three rotational parameters for the next step. Consistently, data with QC of less than one is suitable for processing. Note that to ascertain proper quality for the next step, the QC values of less than one were also considered for this study.
Analysis of brain networks
Most of the rs-MRI studies conducted previously have contained large scale networks which include a rather large area of brain in order to find differences in brain functions between healthy individuals and AD patients. Accordingly, not too many researches have been carried out on rs-fMRI signal characteristics. For example, DMN which has been examined in various studies contain a huge area of the brain [16]. Consistently, the areas of the brain which based on the conclusions of previous studies play a major role in the development of Alzheimer have been studied more exclusively in this research to extract the brain voxel time intervals as well as the time series correlations in areas directly affecting this disease. Finally, functional connectivity among in these areas and in each area within the AD was obtained to compare the Normal Controls and AD patients. For this purpose, first 16 areas [15] which have the greatest interference in AD including the left superior frontal gyrus, right superior frontal gyrus, left middle frontal gyrus, orbital part of the middle frontal gyrus, opecular part of the right inferior frontal gyrus, orbital part of the left inferior frontal, right olfactory cortex, right medial superior frontal gyrus, right insula, posterior cingulate gyrus, left calcarine, right lingual gyrus, right supra-marginal gyrus, left caudate nucleus, left middle temporal gyrus and Right middle temporal gyrus were taken into consideration [15]. To parcellate each area, the intended ROI was divided up in distances of 21
Calculation of graph properties
To calculate the most efficient characteristics, different graph properties were calculated in this study. Two measures of functional segregation, namely the clustering coefficient and the local efficiency (open and close loops) and two measures of functional integration including the characteristic path length and global efficiency as well as a small world network parameter were studied. Also, in this study graph properties were calculated based on Brain Connectivity Toolbox [19].
Functional integration parameters
The path length (L) is the most common functional integration parameter which is often utilized. Characteristic path length of a network is defined as the mean of the shortest geodesic distances between any two nodes [17]. The global efficiency (Eglobal) measures the ability of a network to transmit information at a global level and is defined as the average inverse shortest path length; it is the overall yield of information exchange across the network where information is exchanged simultaneously [20].
Functional segregation parameters
The binary clustering coefficient (C) of a particular node is the proportion of the number of edges that exists between neighbors of that node relative to the number of all possible edges between neighbors. The overall clustering coefficient in a network which is indicative of the presence of clustered connectivity around individual nodes, can be calculated by averaging the clustering coefficient across all individual nodes [22]. The ability of a network in transmitting information at the local level can be determined by measure of local efficiency. Accordingly, the local efficiency (Elocal) can be defined as resist of a network against defeat in a small scale. Also, the local efficiency of a special inverted vertex is the shortest path which connects all the neighbors to this vertex [21].
Results
The study of the human brain’s network in order to find differences due to a disease by using the graph theory necessitates the examination of the graph parameters and their theoretical properties. Consistently, some of the most fundamental graph properties in the current research were obtained through the study of two groups, namely Normal Control and AD patients. The following are the conclusion of this study.
Characteristic path length values in NC and AD groups
Characteristic path length values in NC and AD groups
Clustering coefficient values in NC and AD groups (closed and open loops)
The characteristics path length in the brain graphs for the two groups of Normal Controls and AD patients was calculated, whereby the results (Table 1) indicate that the characteristic values along the path in the AD patients are higher than that of Normal Controls. In fact, AD causes an increase in the length because of the loss of internal brain network connectivity. The measurement of the path which is directly related to the intensity of the disease has been measured using the Mini Mental State Examination (MMSE), whereby the longer paths are associated with cognitive impairments [15].
Examination of the clustering coefficient
As mentioned previously, the clustering coefficient is used as the local connectivity parameter to measure the level of existing “cliques” in the graph. High clustering is accompanied by the reinforcement and strengthening of the network which is displays flexibility against network damages. Therefore, decrease in the rate of clustering and strengthening is expected in Alzheimer which means that the examination of clustering rate can be used effectively to diagnose Alzheimer. The results obtained from the clustering coefficients were calculated as closed- and opened-loops for the Normal Controls and AD patients, and thereby the lower clustering coefficients were found to be lower in the AD patients than Normal Controls (see Table 2). Accordingly, it can be deducted that Alzheimer results in lower clustering. In fact, this reduction in brain clustering coefficient can be reflected the atrophy processes which define similarities in brain morphology in all AD patients.
Examination of the local and global efficiency
The local and global efficiency have a reverse relation coupled with the characteristic path length which explains the lower rate of the two respective efficiency as the result of increase in the length of the path. In fact, the obtained results all point to this hypothesis. As illustrated in Table 3, the overall local and global efficiency for the open and close loops evidencing a decrease in the efficiency due to Alzheimer have been obtained for both groups in this study.
Small-worldness
A great number of real world networks including the human brain have the small world properties which possess the mixed properties of random and regular networks. Small world networks are highly clustered like regular networks yet have small characteristic path lengths like random graphs. Humphries and colleagues introduced the measure of small-worldness as a ratio of network clustering coefficient and characteristic path length compared to their corresponding random network values. Consistently, 100 random E-R graphs were constructed for the current study, and their mean average were subsequently calculated and considered as the equivalent random brain graph for each of the Normal Control and AD patients alike. Furthermore, pursuant to the conclusions obtained by Garney and Humphries, Eqs (1)–(3) were utilized in this study [22].
Accordingly, a network is referred to as the ‘small world’ in which is following
Global efficiency and local efficiency values in open and closed loops in NC and AD groups
Small world values in NC and AD groups
The data examined in the current study satisfy the small world condition, and as a result these networks are ‘small world’. However, in one of the sets of data for AD patients (No. 6), the
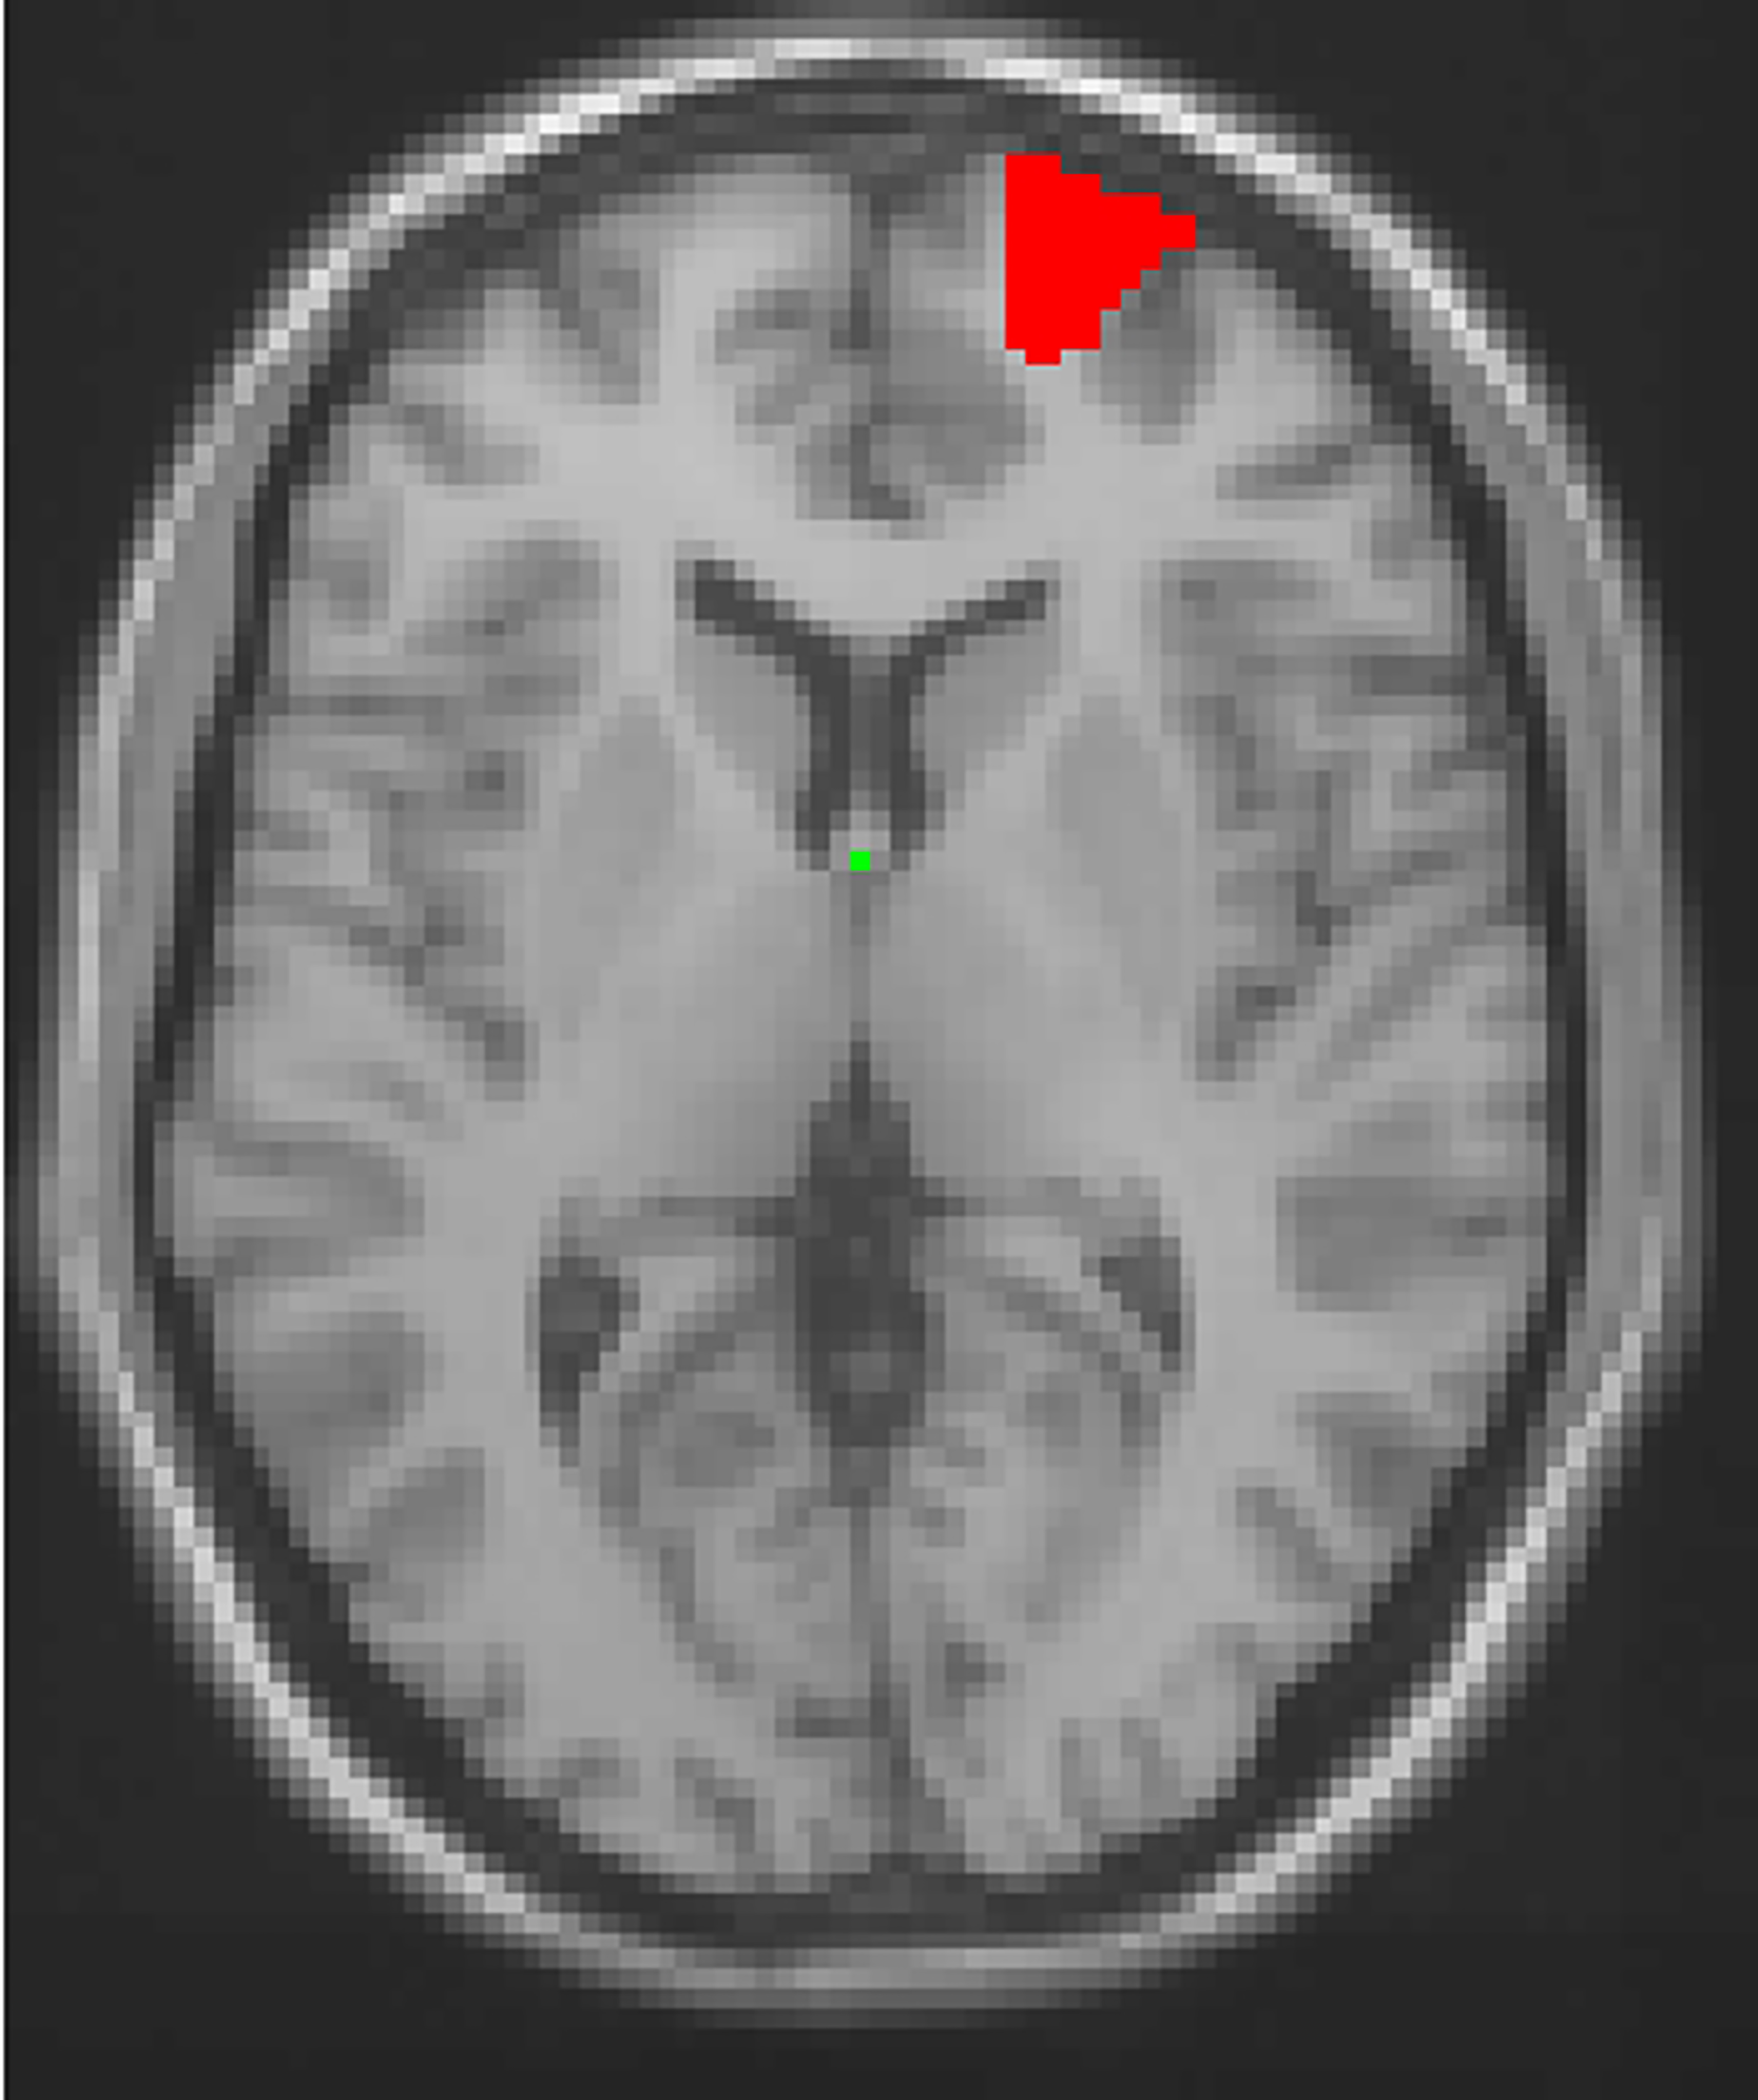
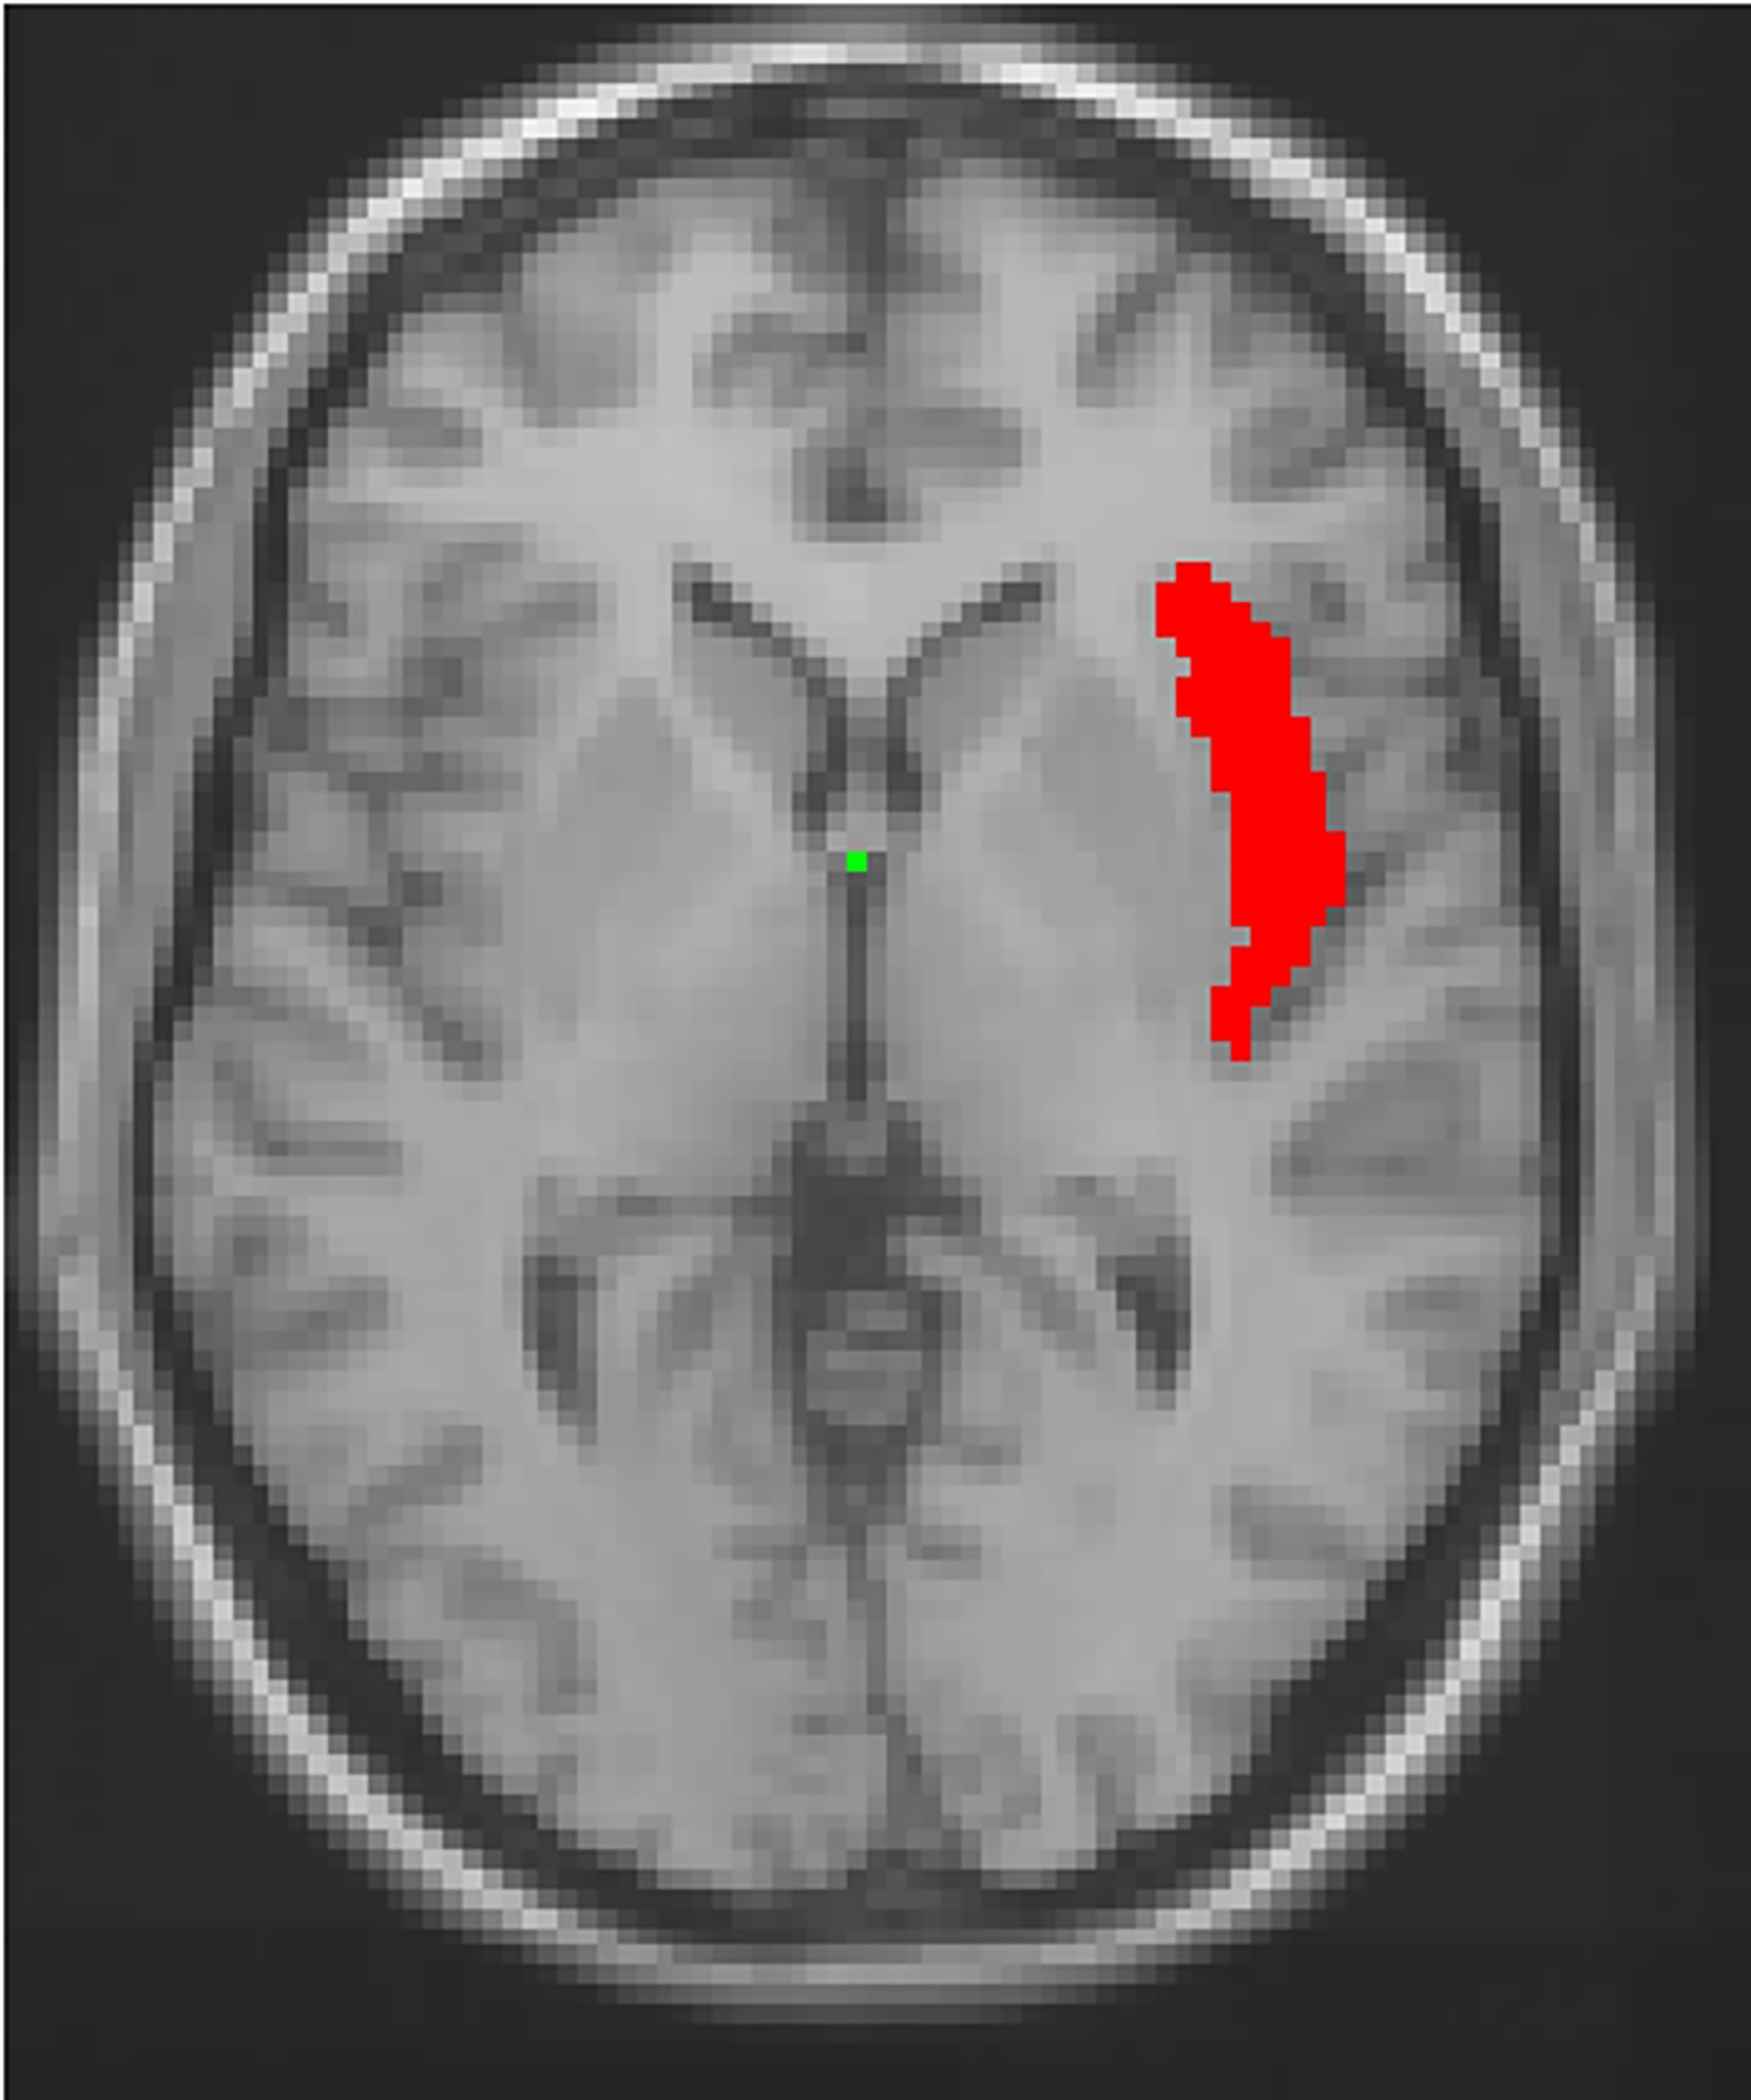
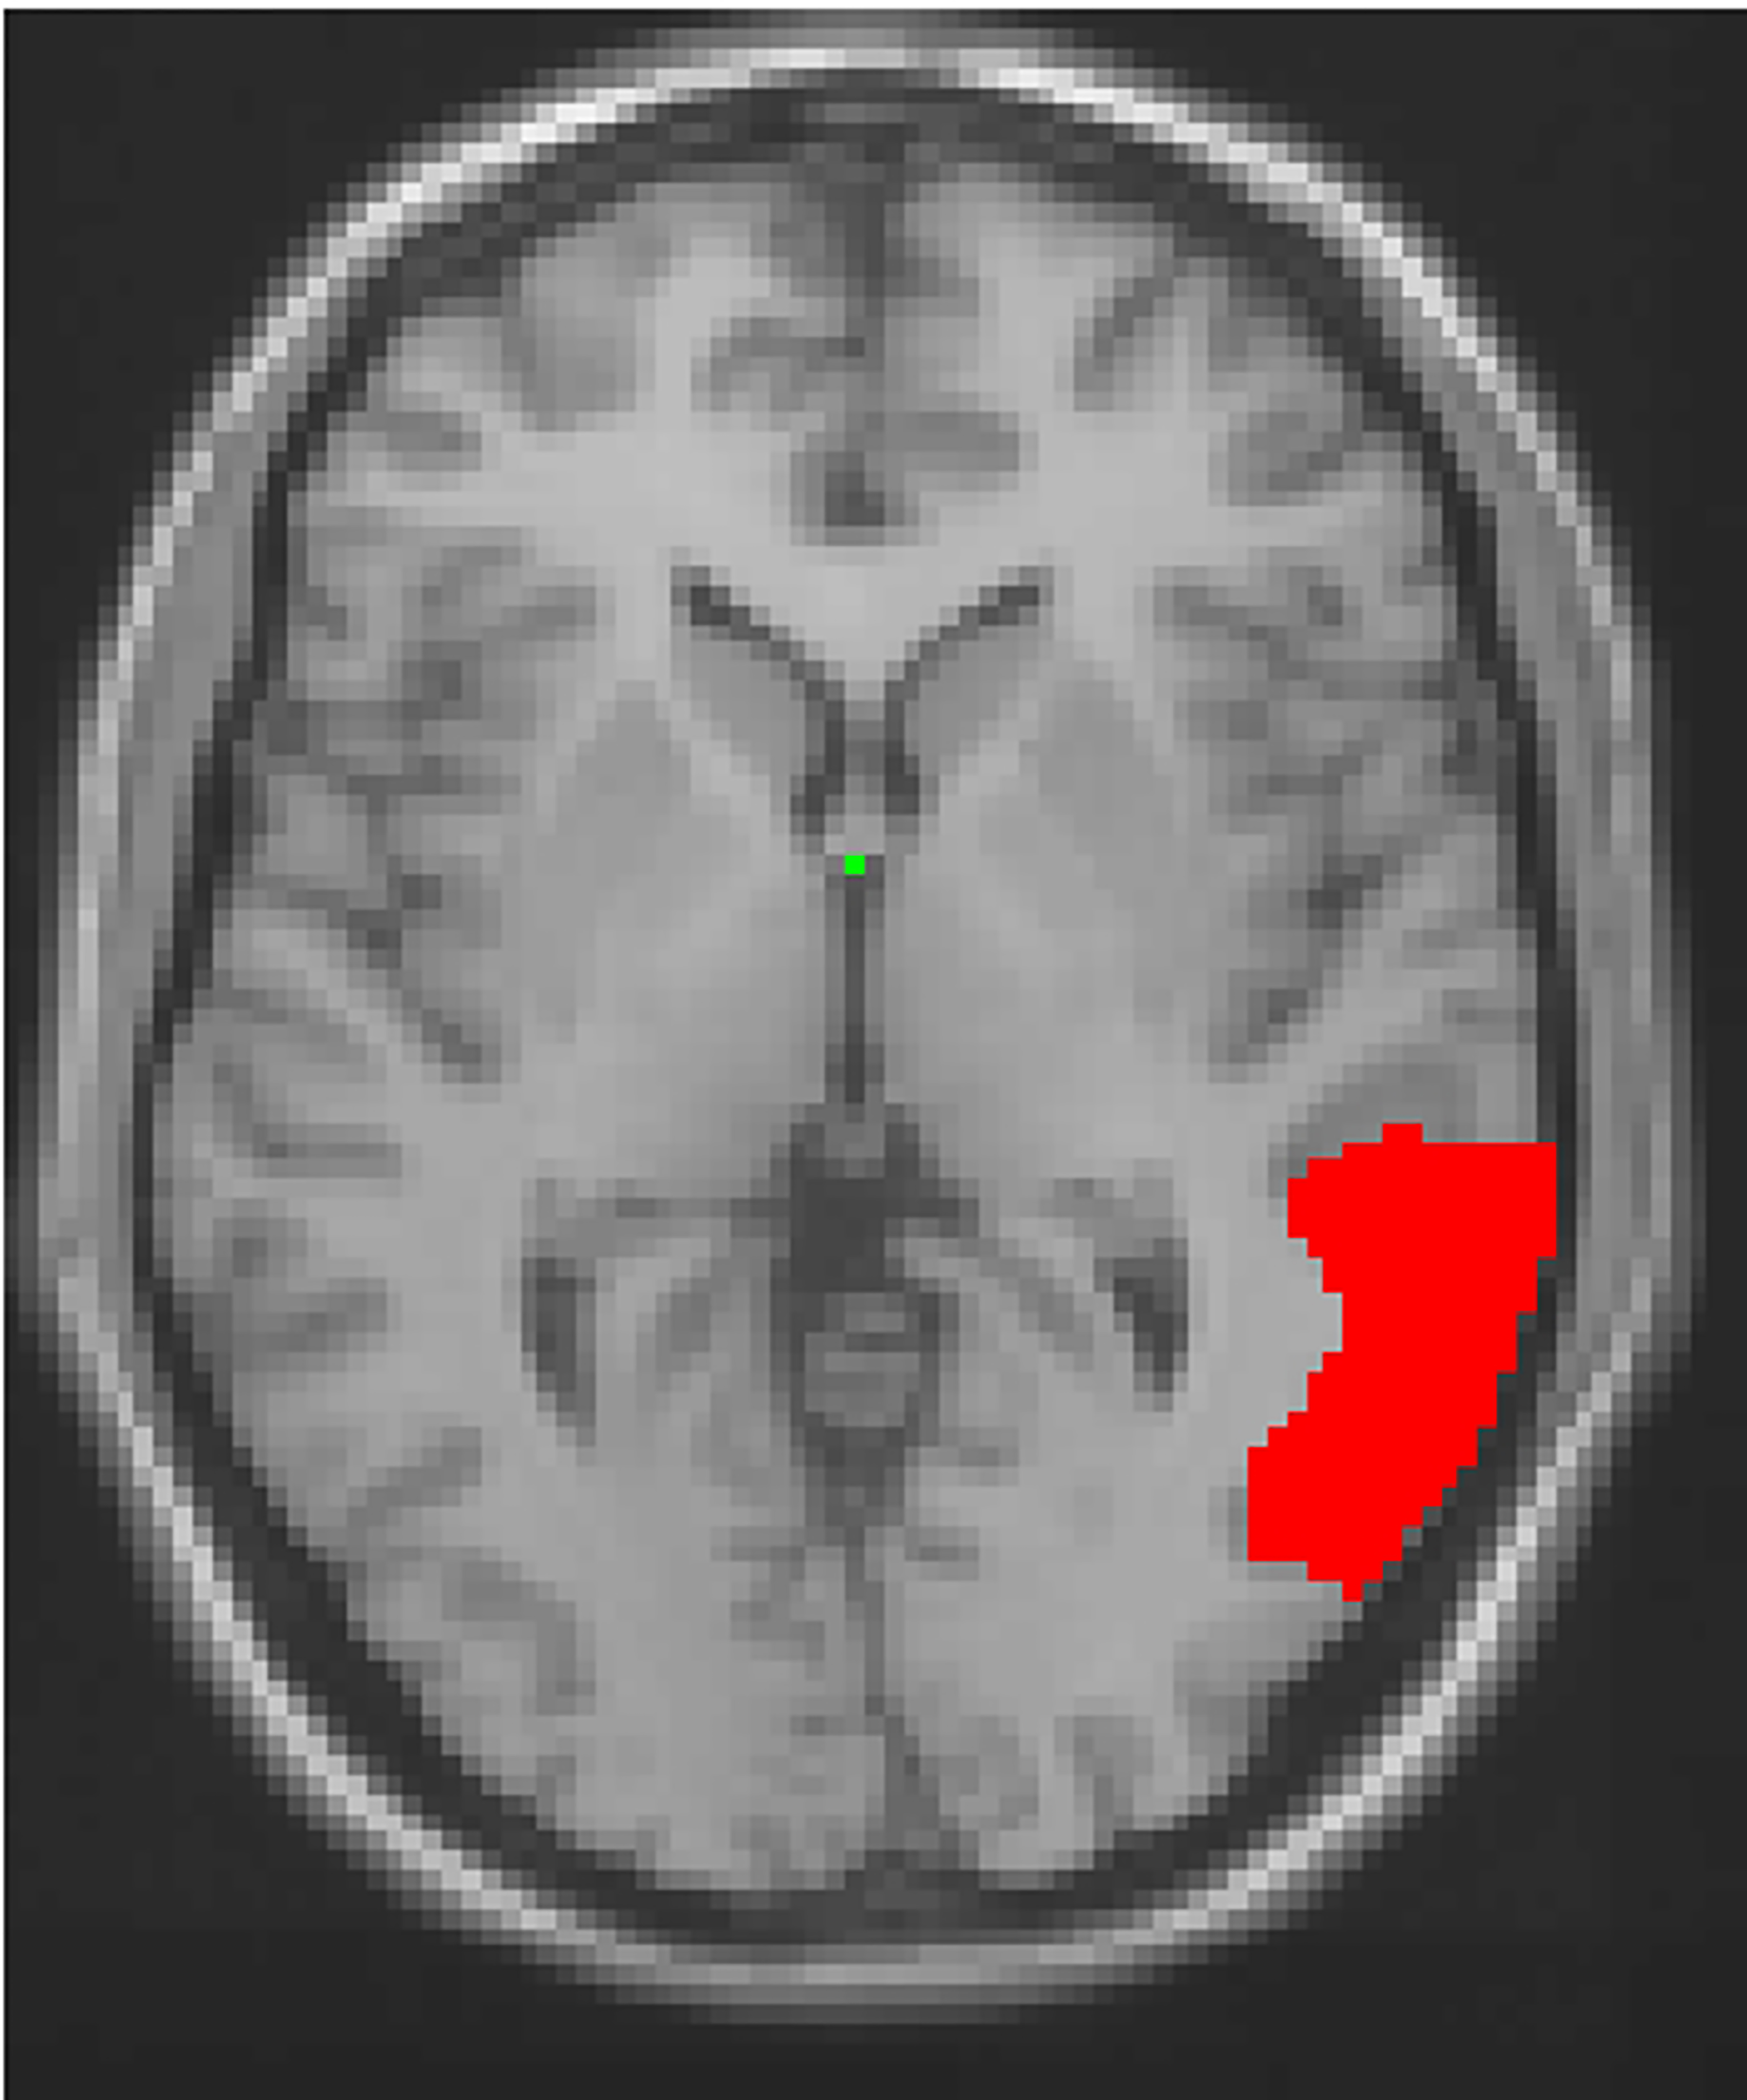
We have analyzed the brain network in this study to find the major changes in patients suffering from AD. Additionally, we have also investigated whether the theoretical graph properties yielded from complex brain networks can effectively separate NC group from AD patients. Furthermore, the brain’s functional network was created through the utilization of rs-fMRI signal correlations taken from different areas of the brain. So far, all the rs-fMRI studies conducted in the past have only examined the relatively large scale networks which include a large part of the brain to establish the differences in brain functions among Normal Control and AD patients, whereby only a handful of such studies have actually taken smaller scale rs-fMRI networks into consideration. For example, DMN which has been the subject of extensive studies entails a large area of the brain. Accordingly, 16 areas which are highly involved in the development of Alzheimer were selected for the current study. Although, these 16 areas were also selected in part because almost all of the previous studies only focused on 7 areas which is less than the total areas identified for this study. Therefore, these 16 areas which can be seen in Figs 2 to 16 and had more interference in AD were selected for the purpose of the study.
Left superior frontal gyrus. Right superior frontal gyrus.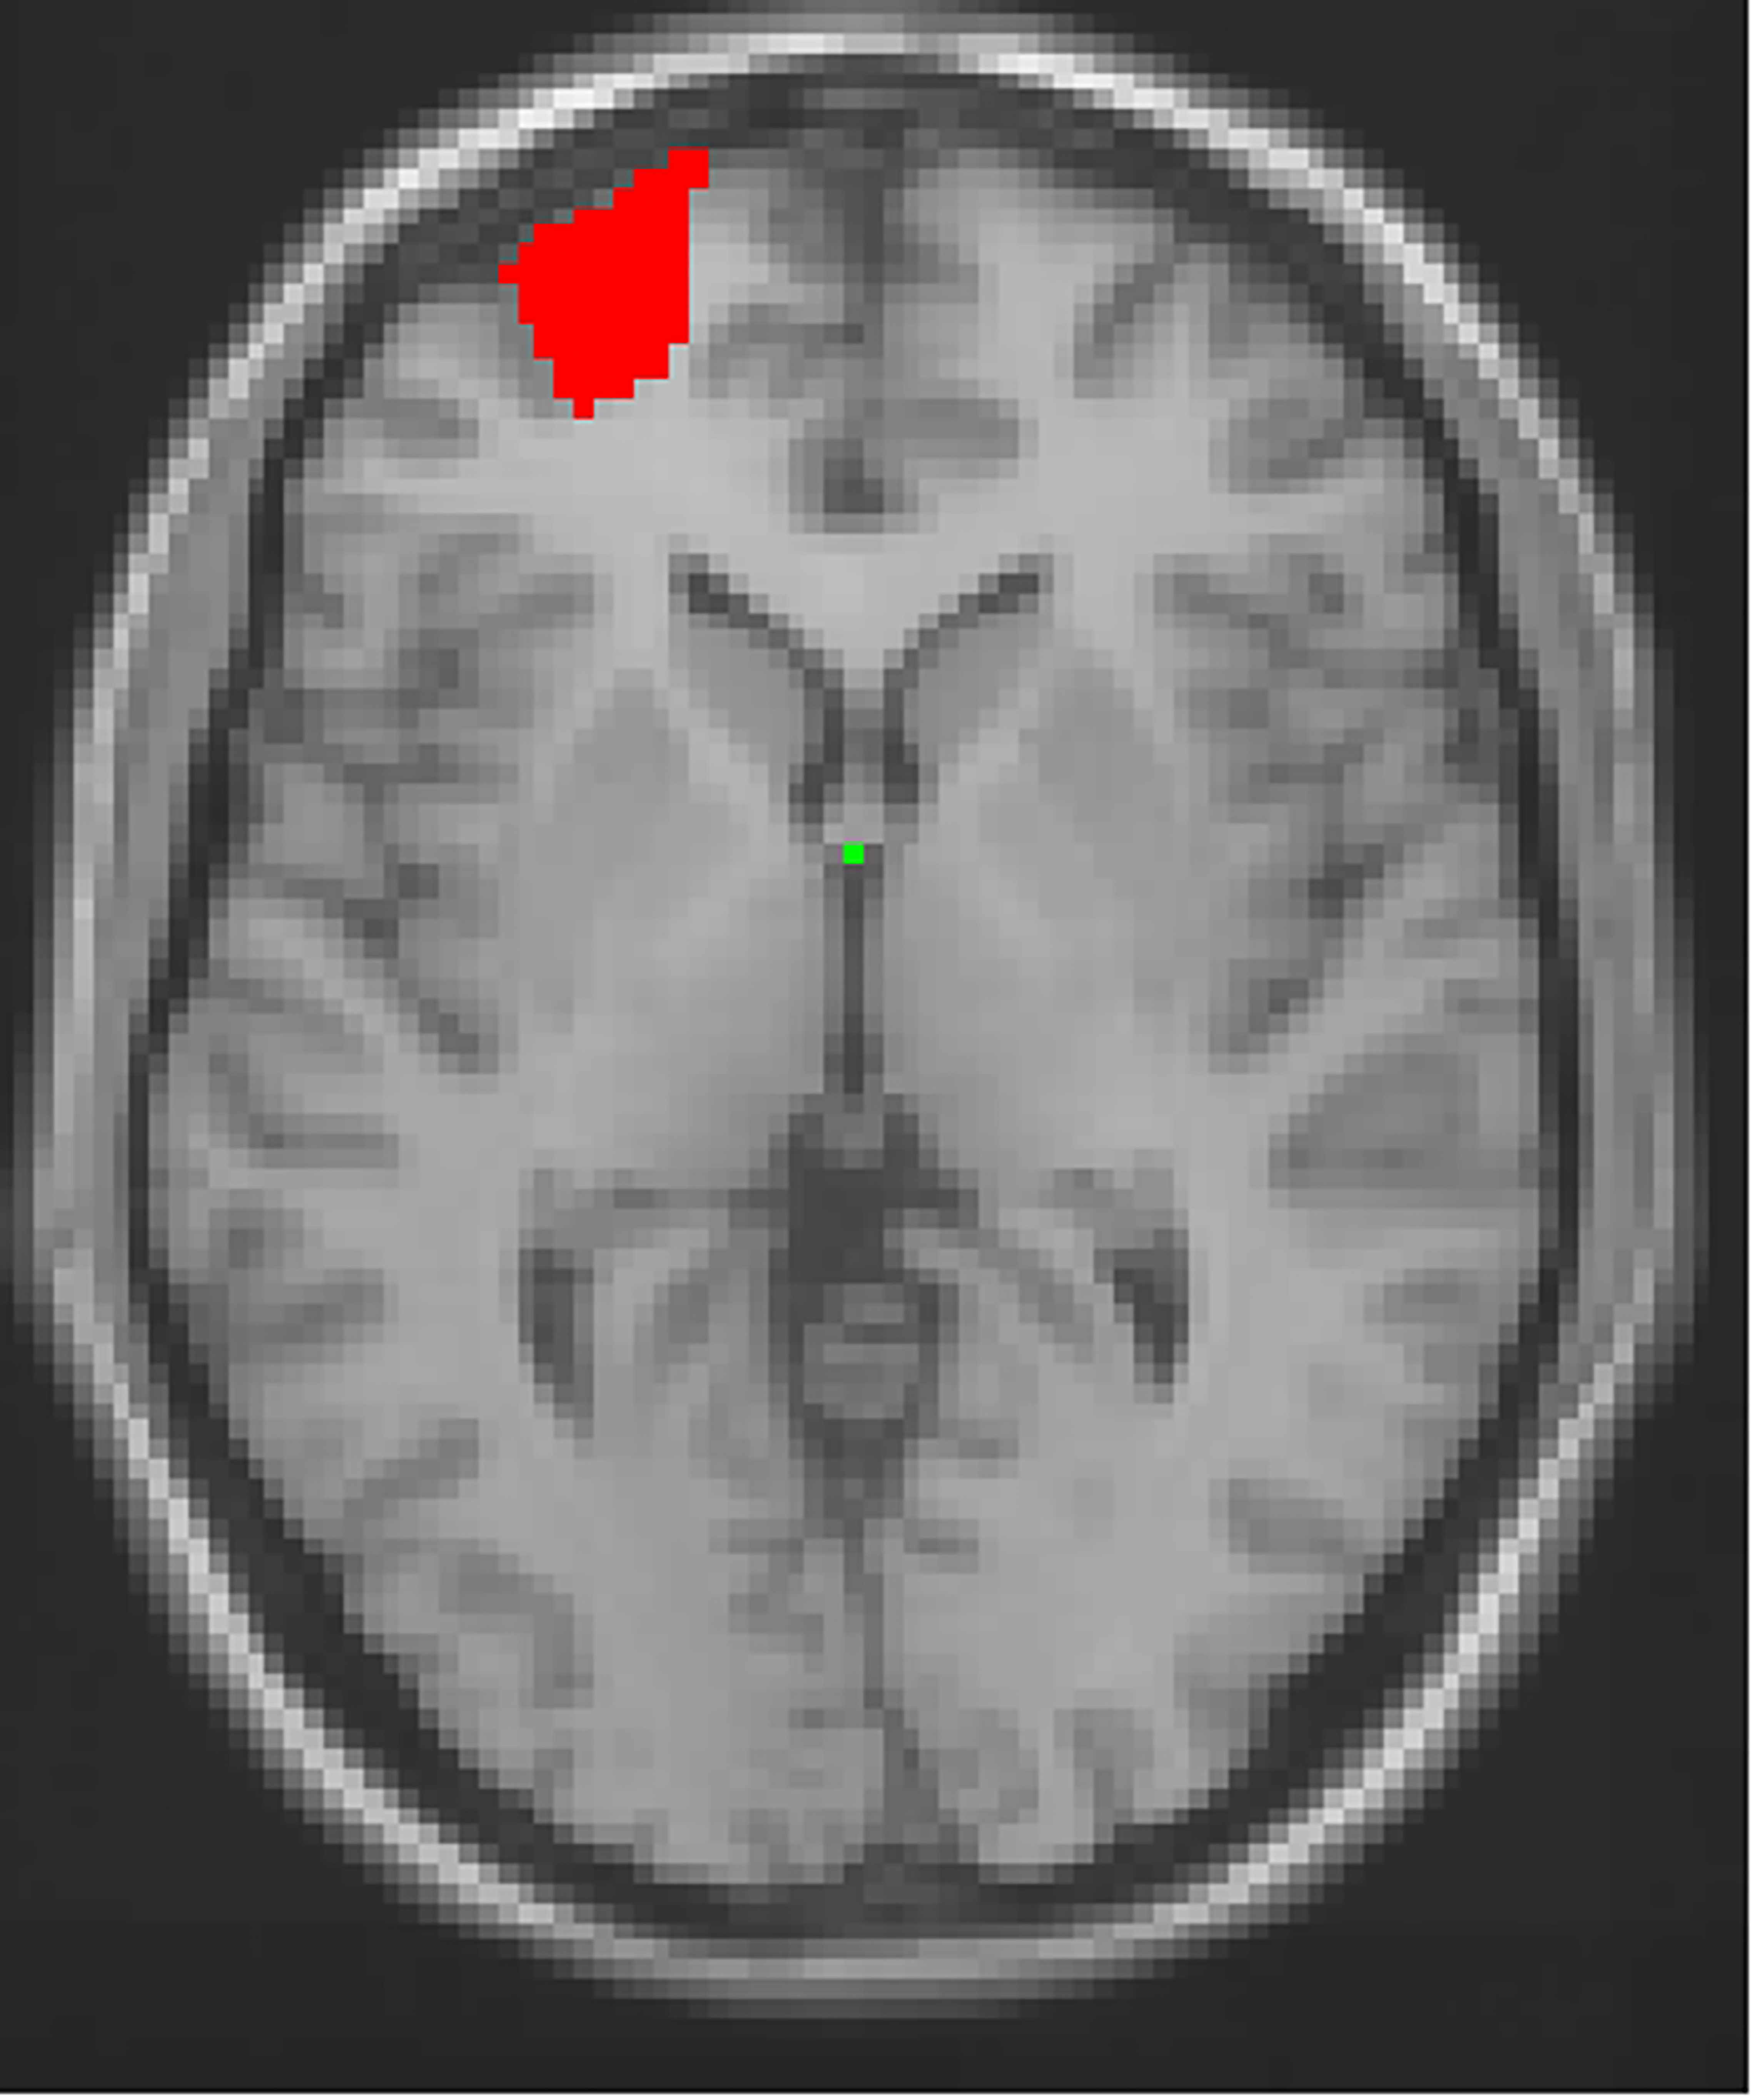
Orbital part of the left middle frontal gyrus. Orbital part of the right middle frontal gyrus.

Right middle temporal gyrus. Right medial superior frontal gyrus.

Right olfactory cortex. Right superior frontal gyrus.

Posterior cingulate gyrus. Right insula.
Left calcarine. Right lingual gyrus.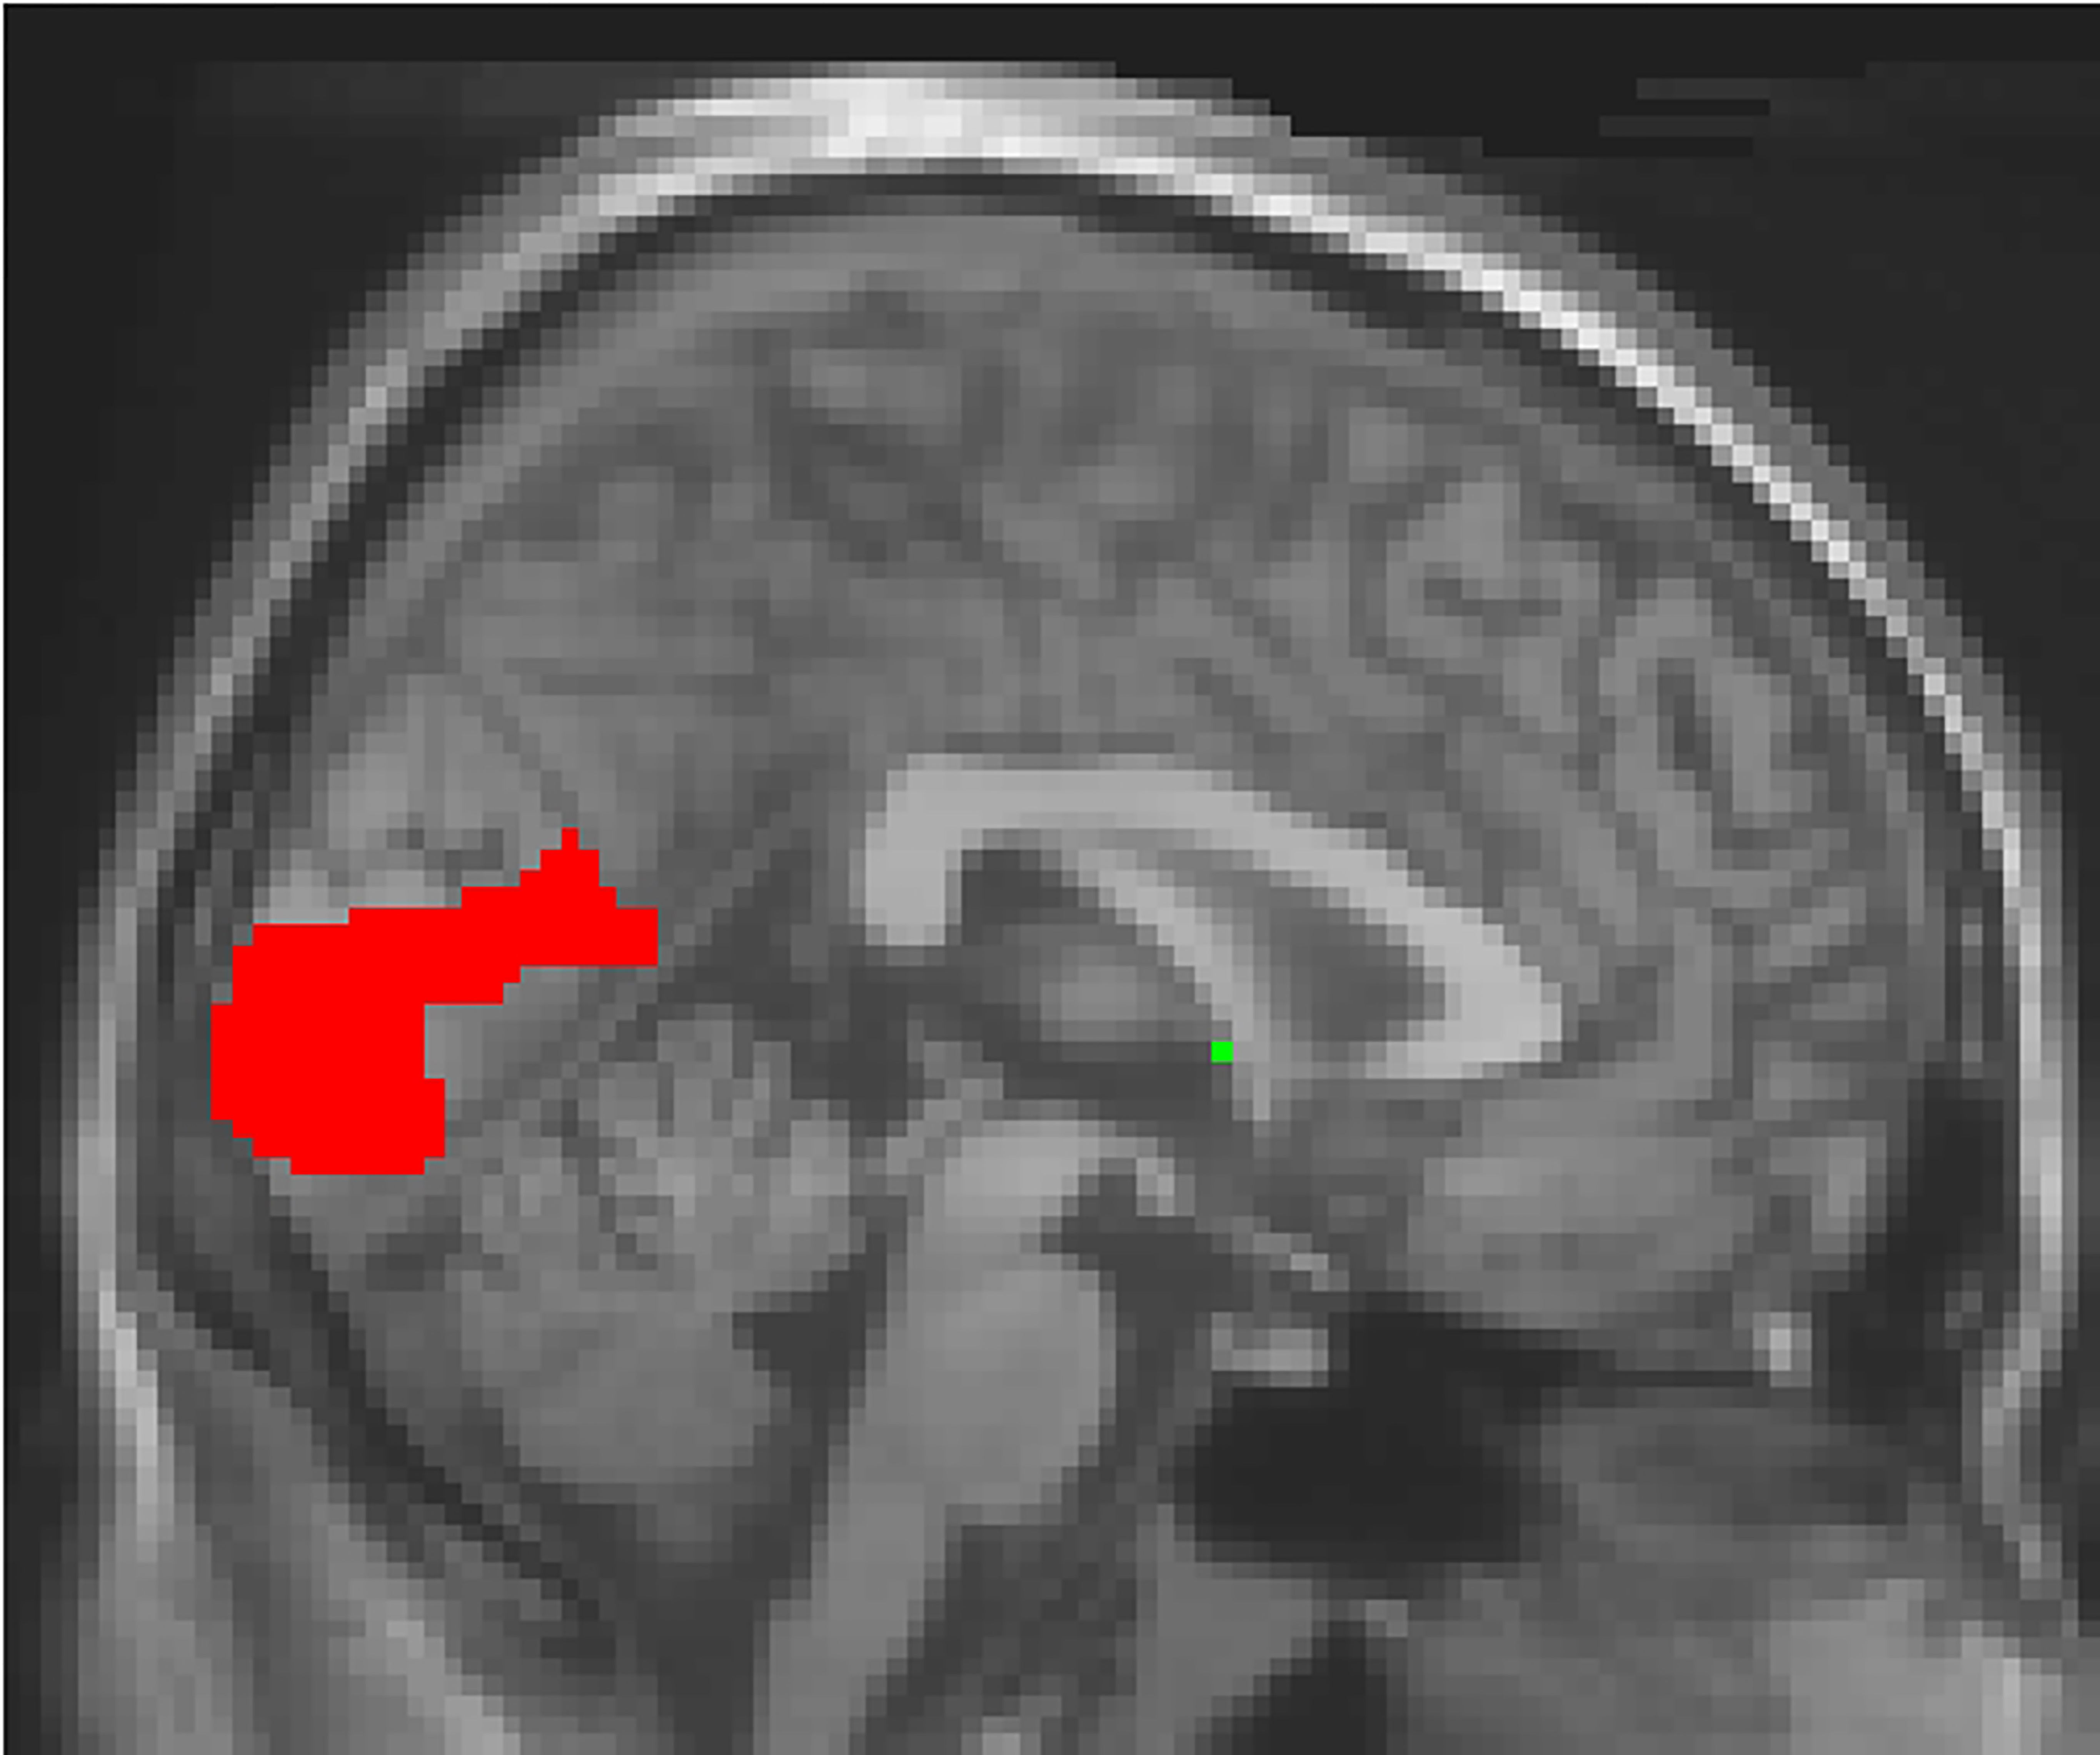
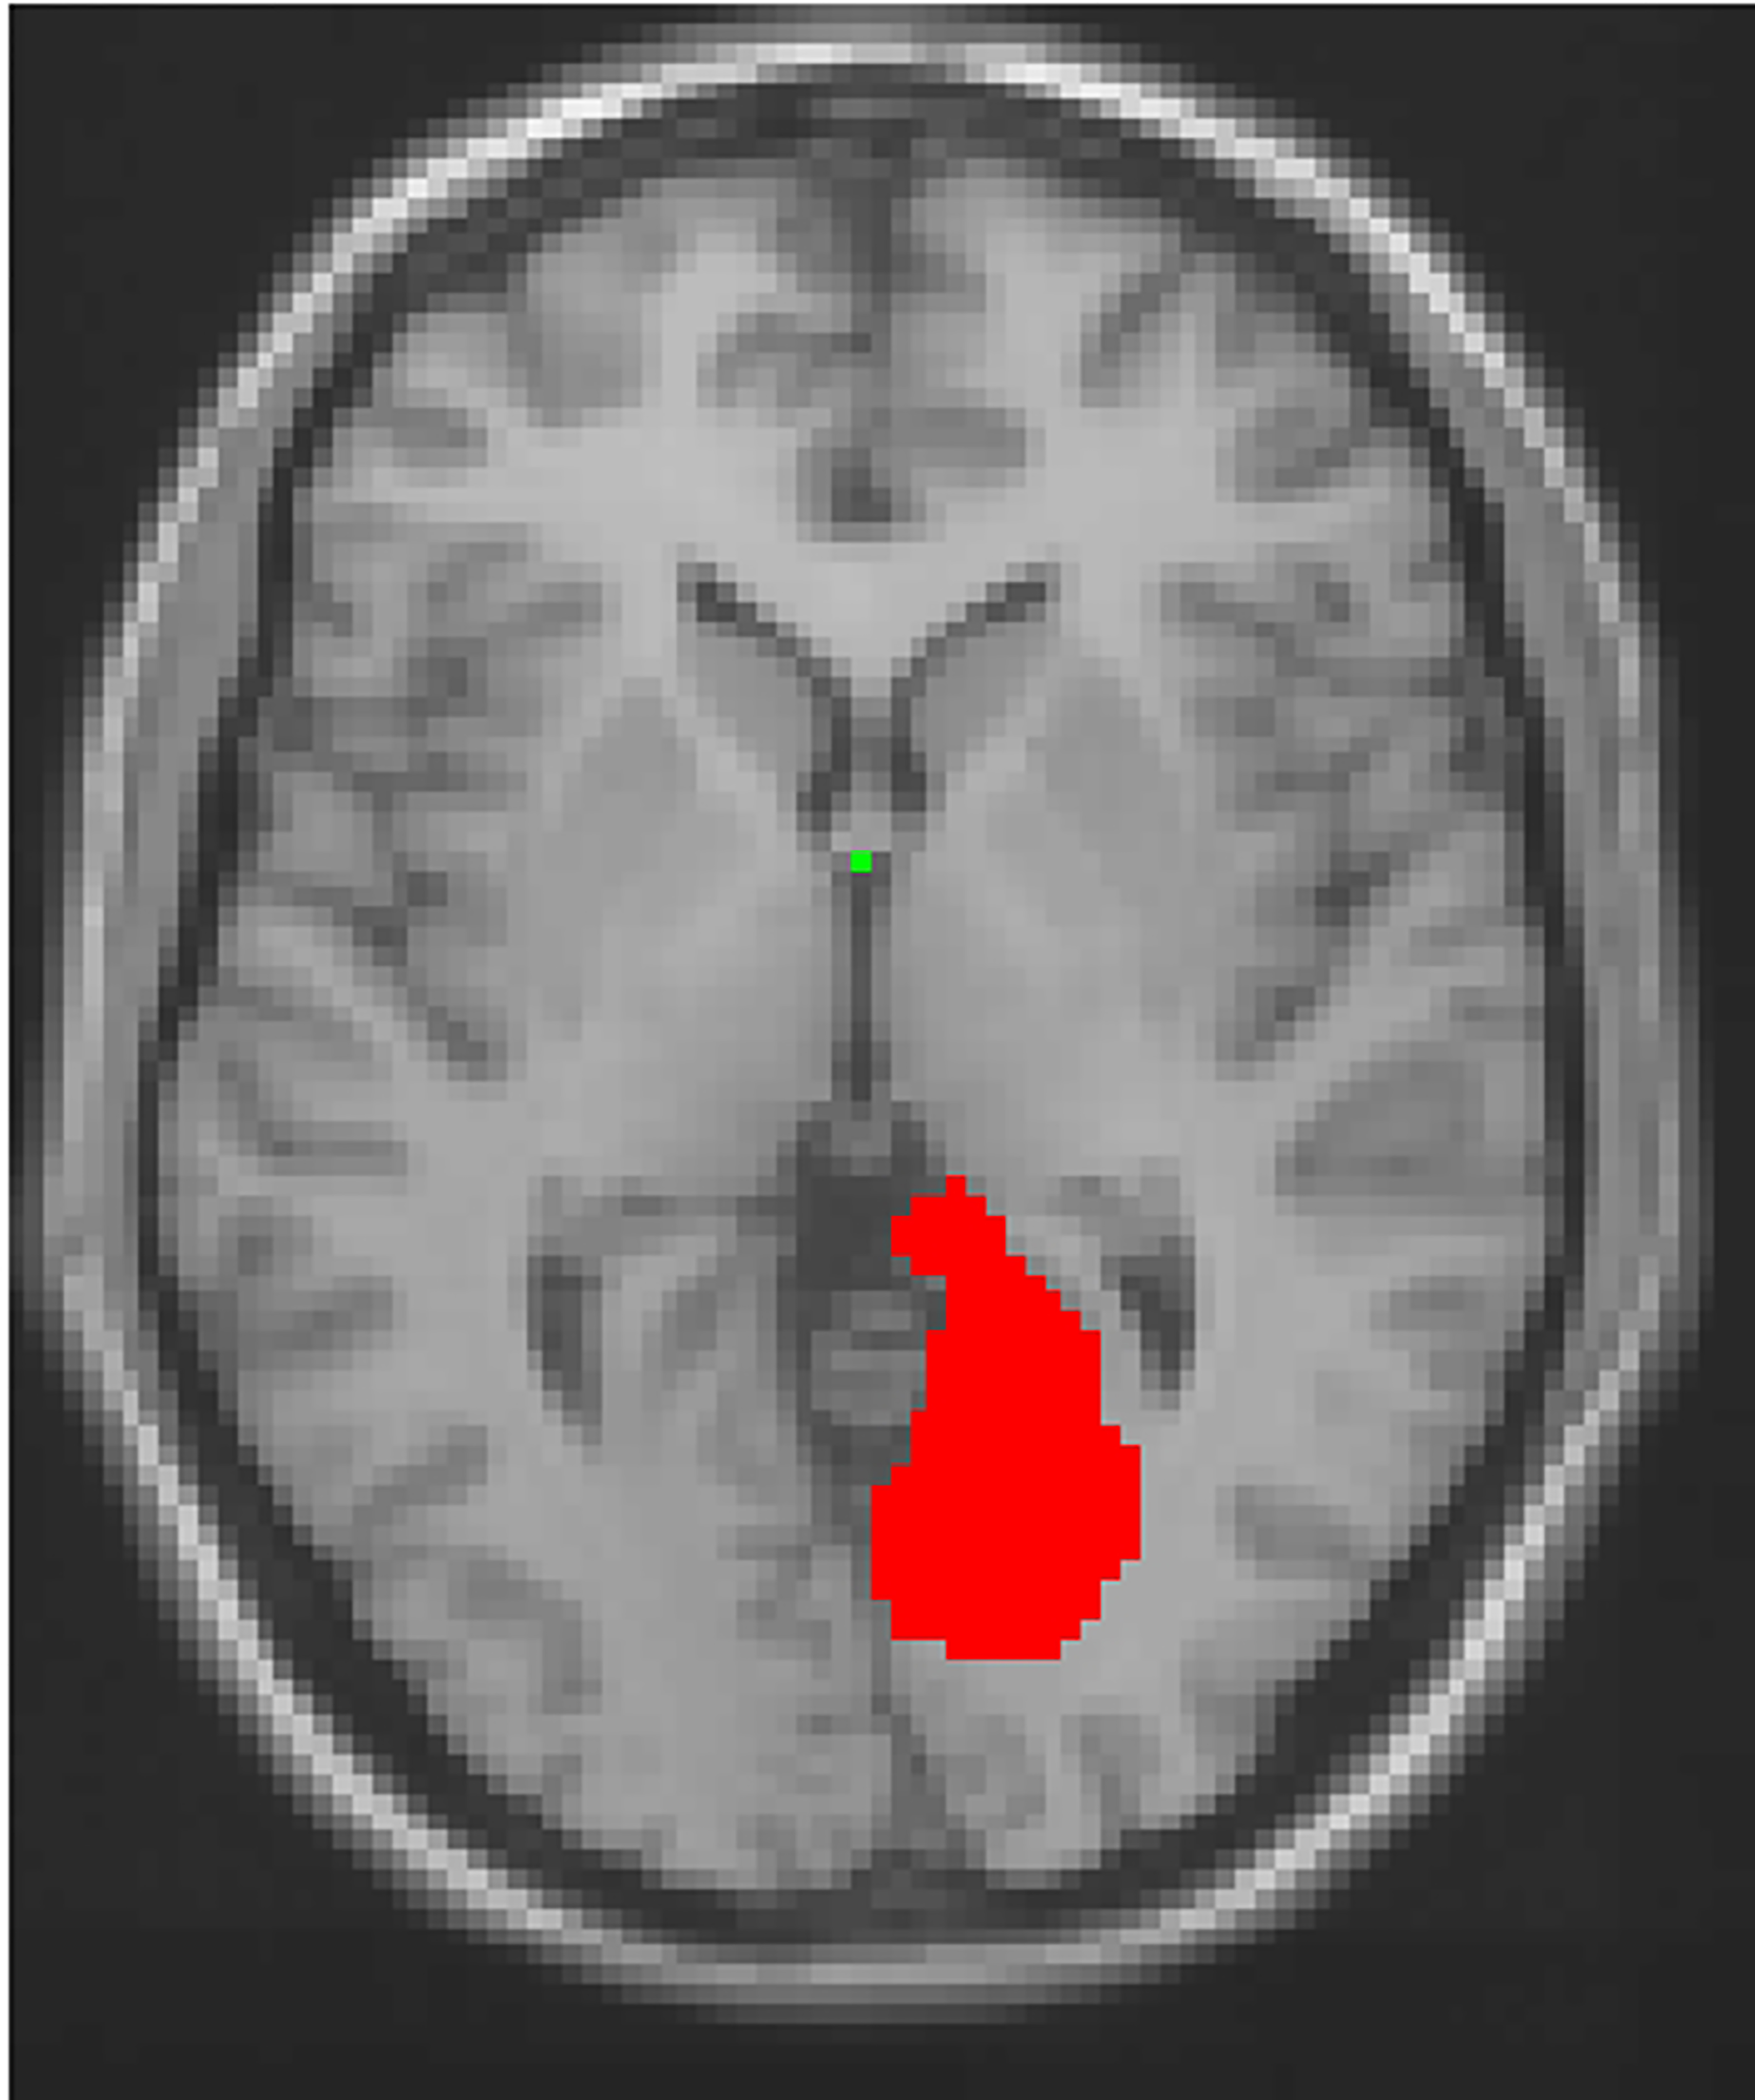
Left caudate nucleus. Right supramarginal gyrus.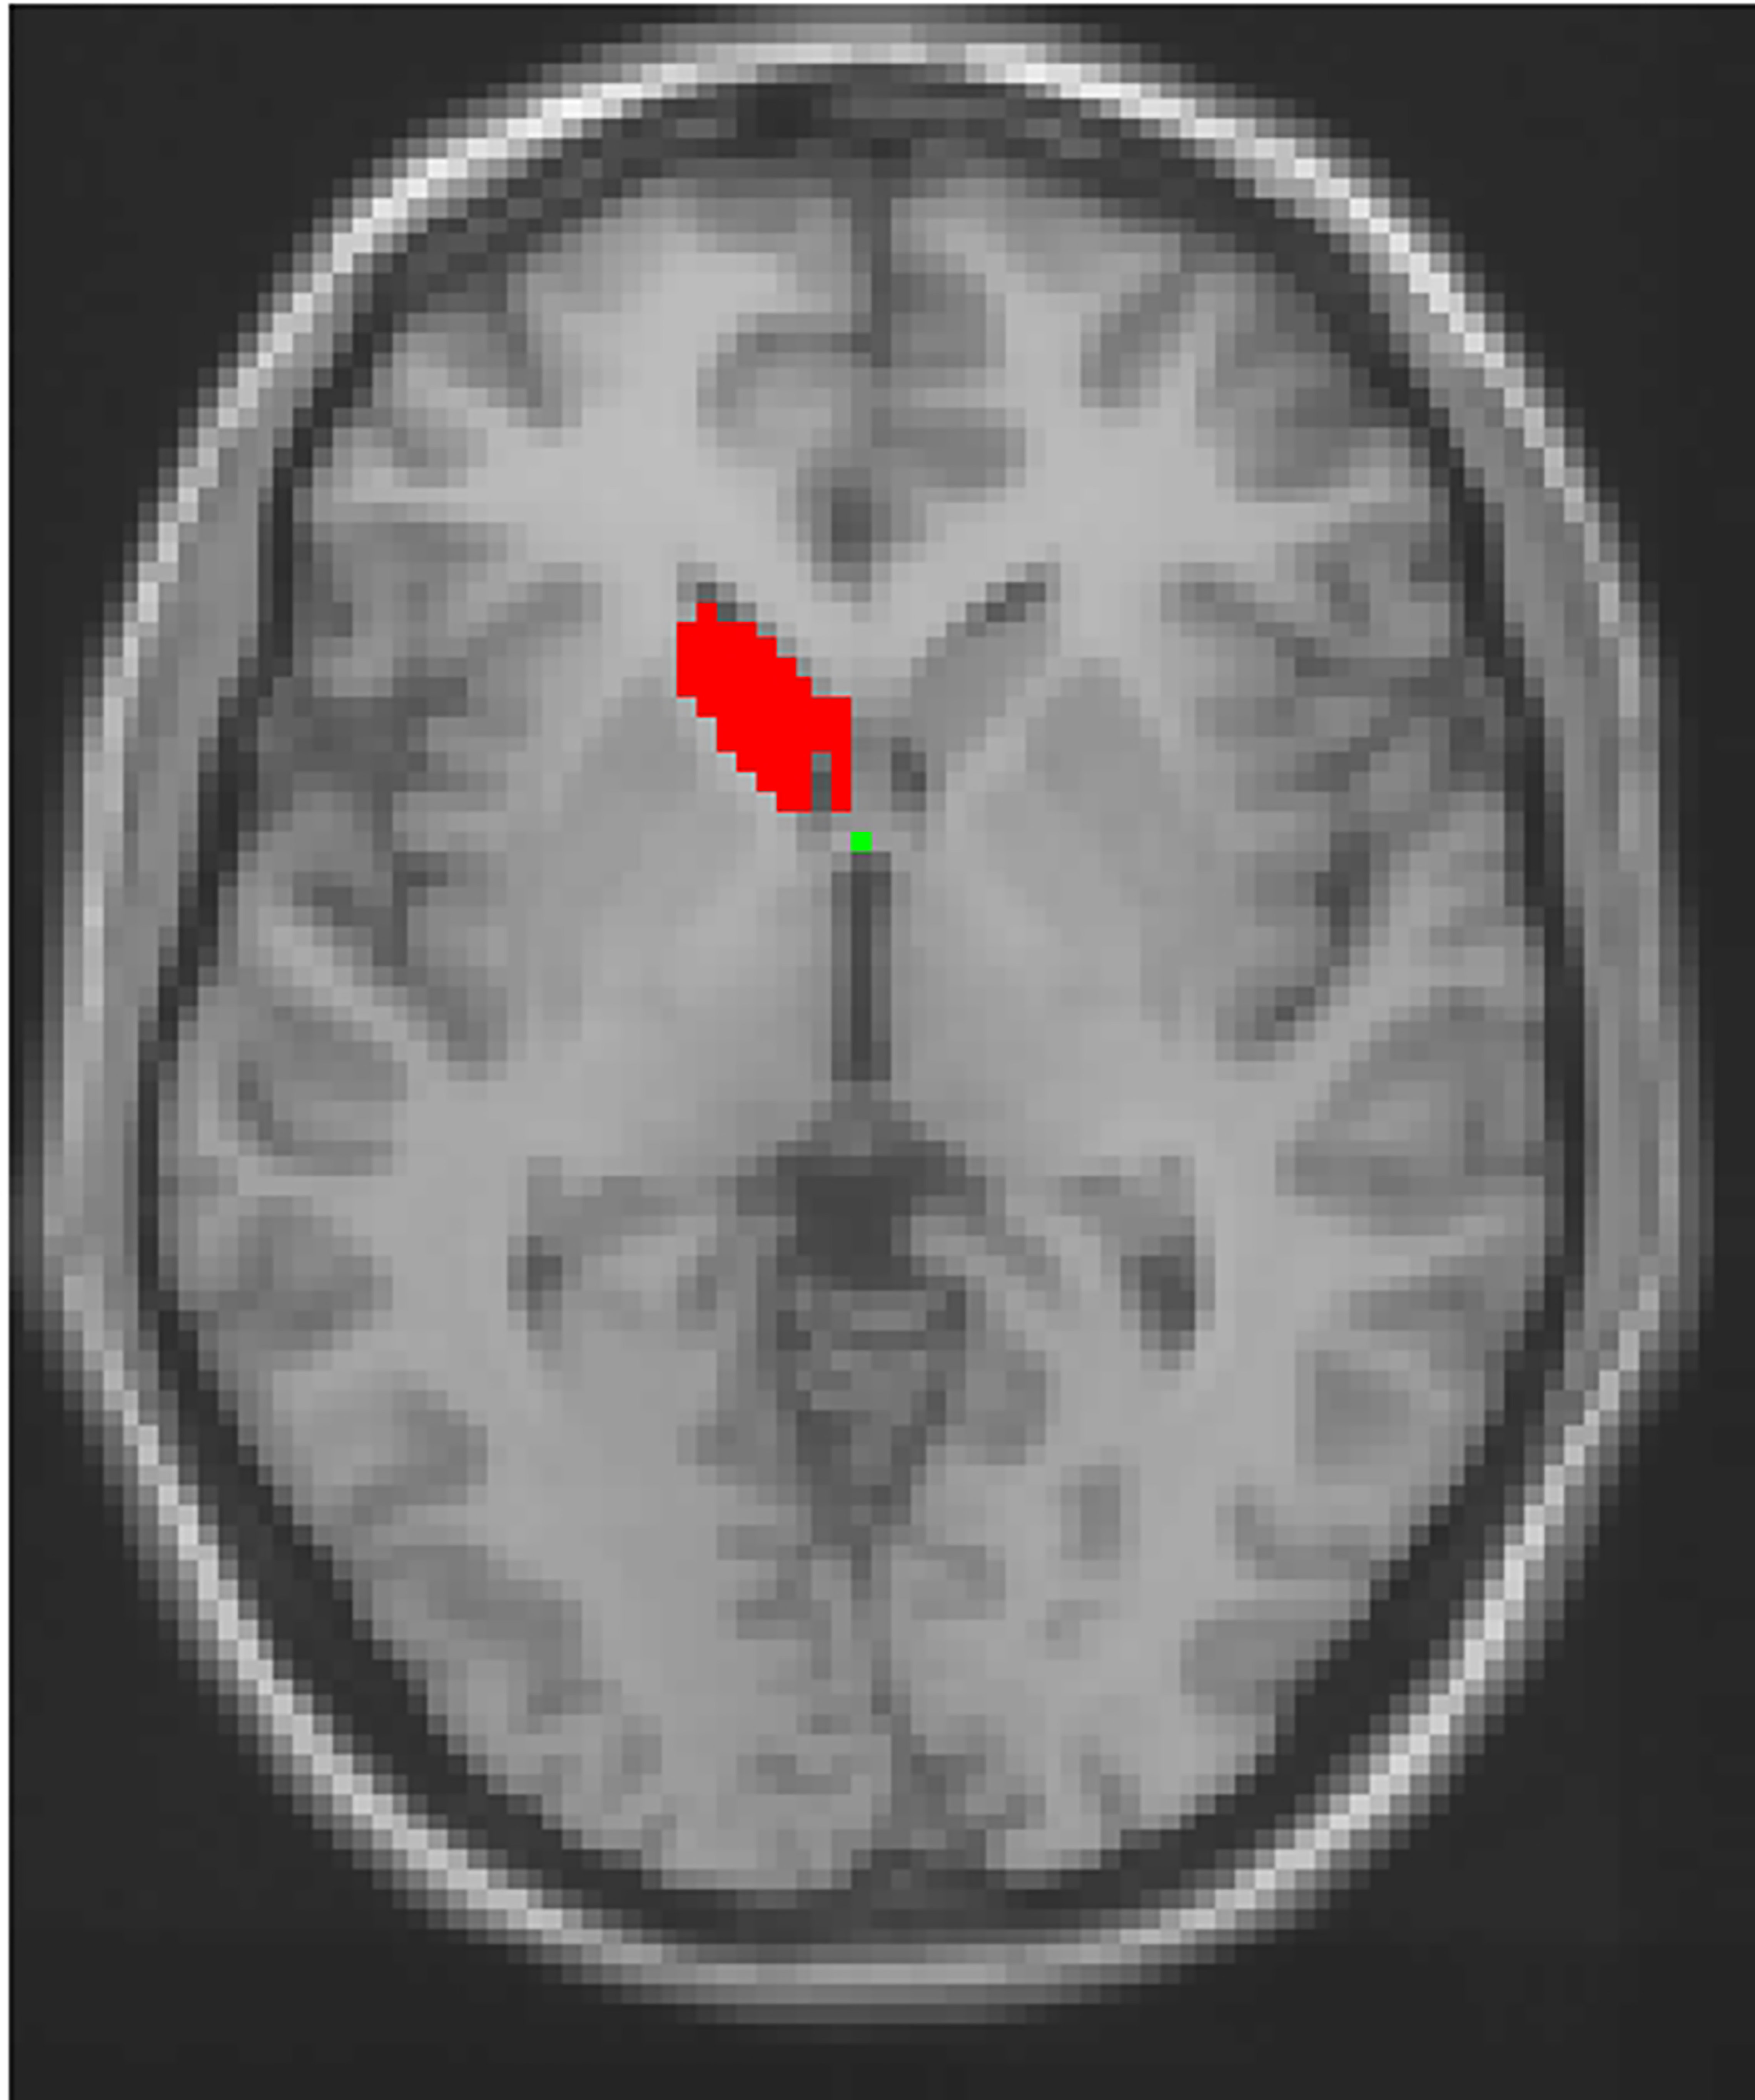
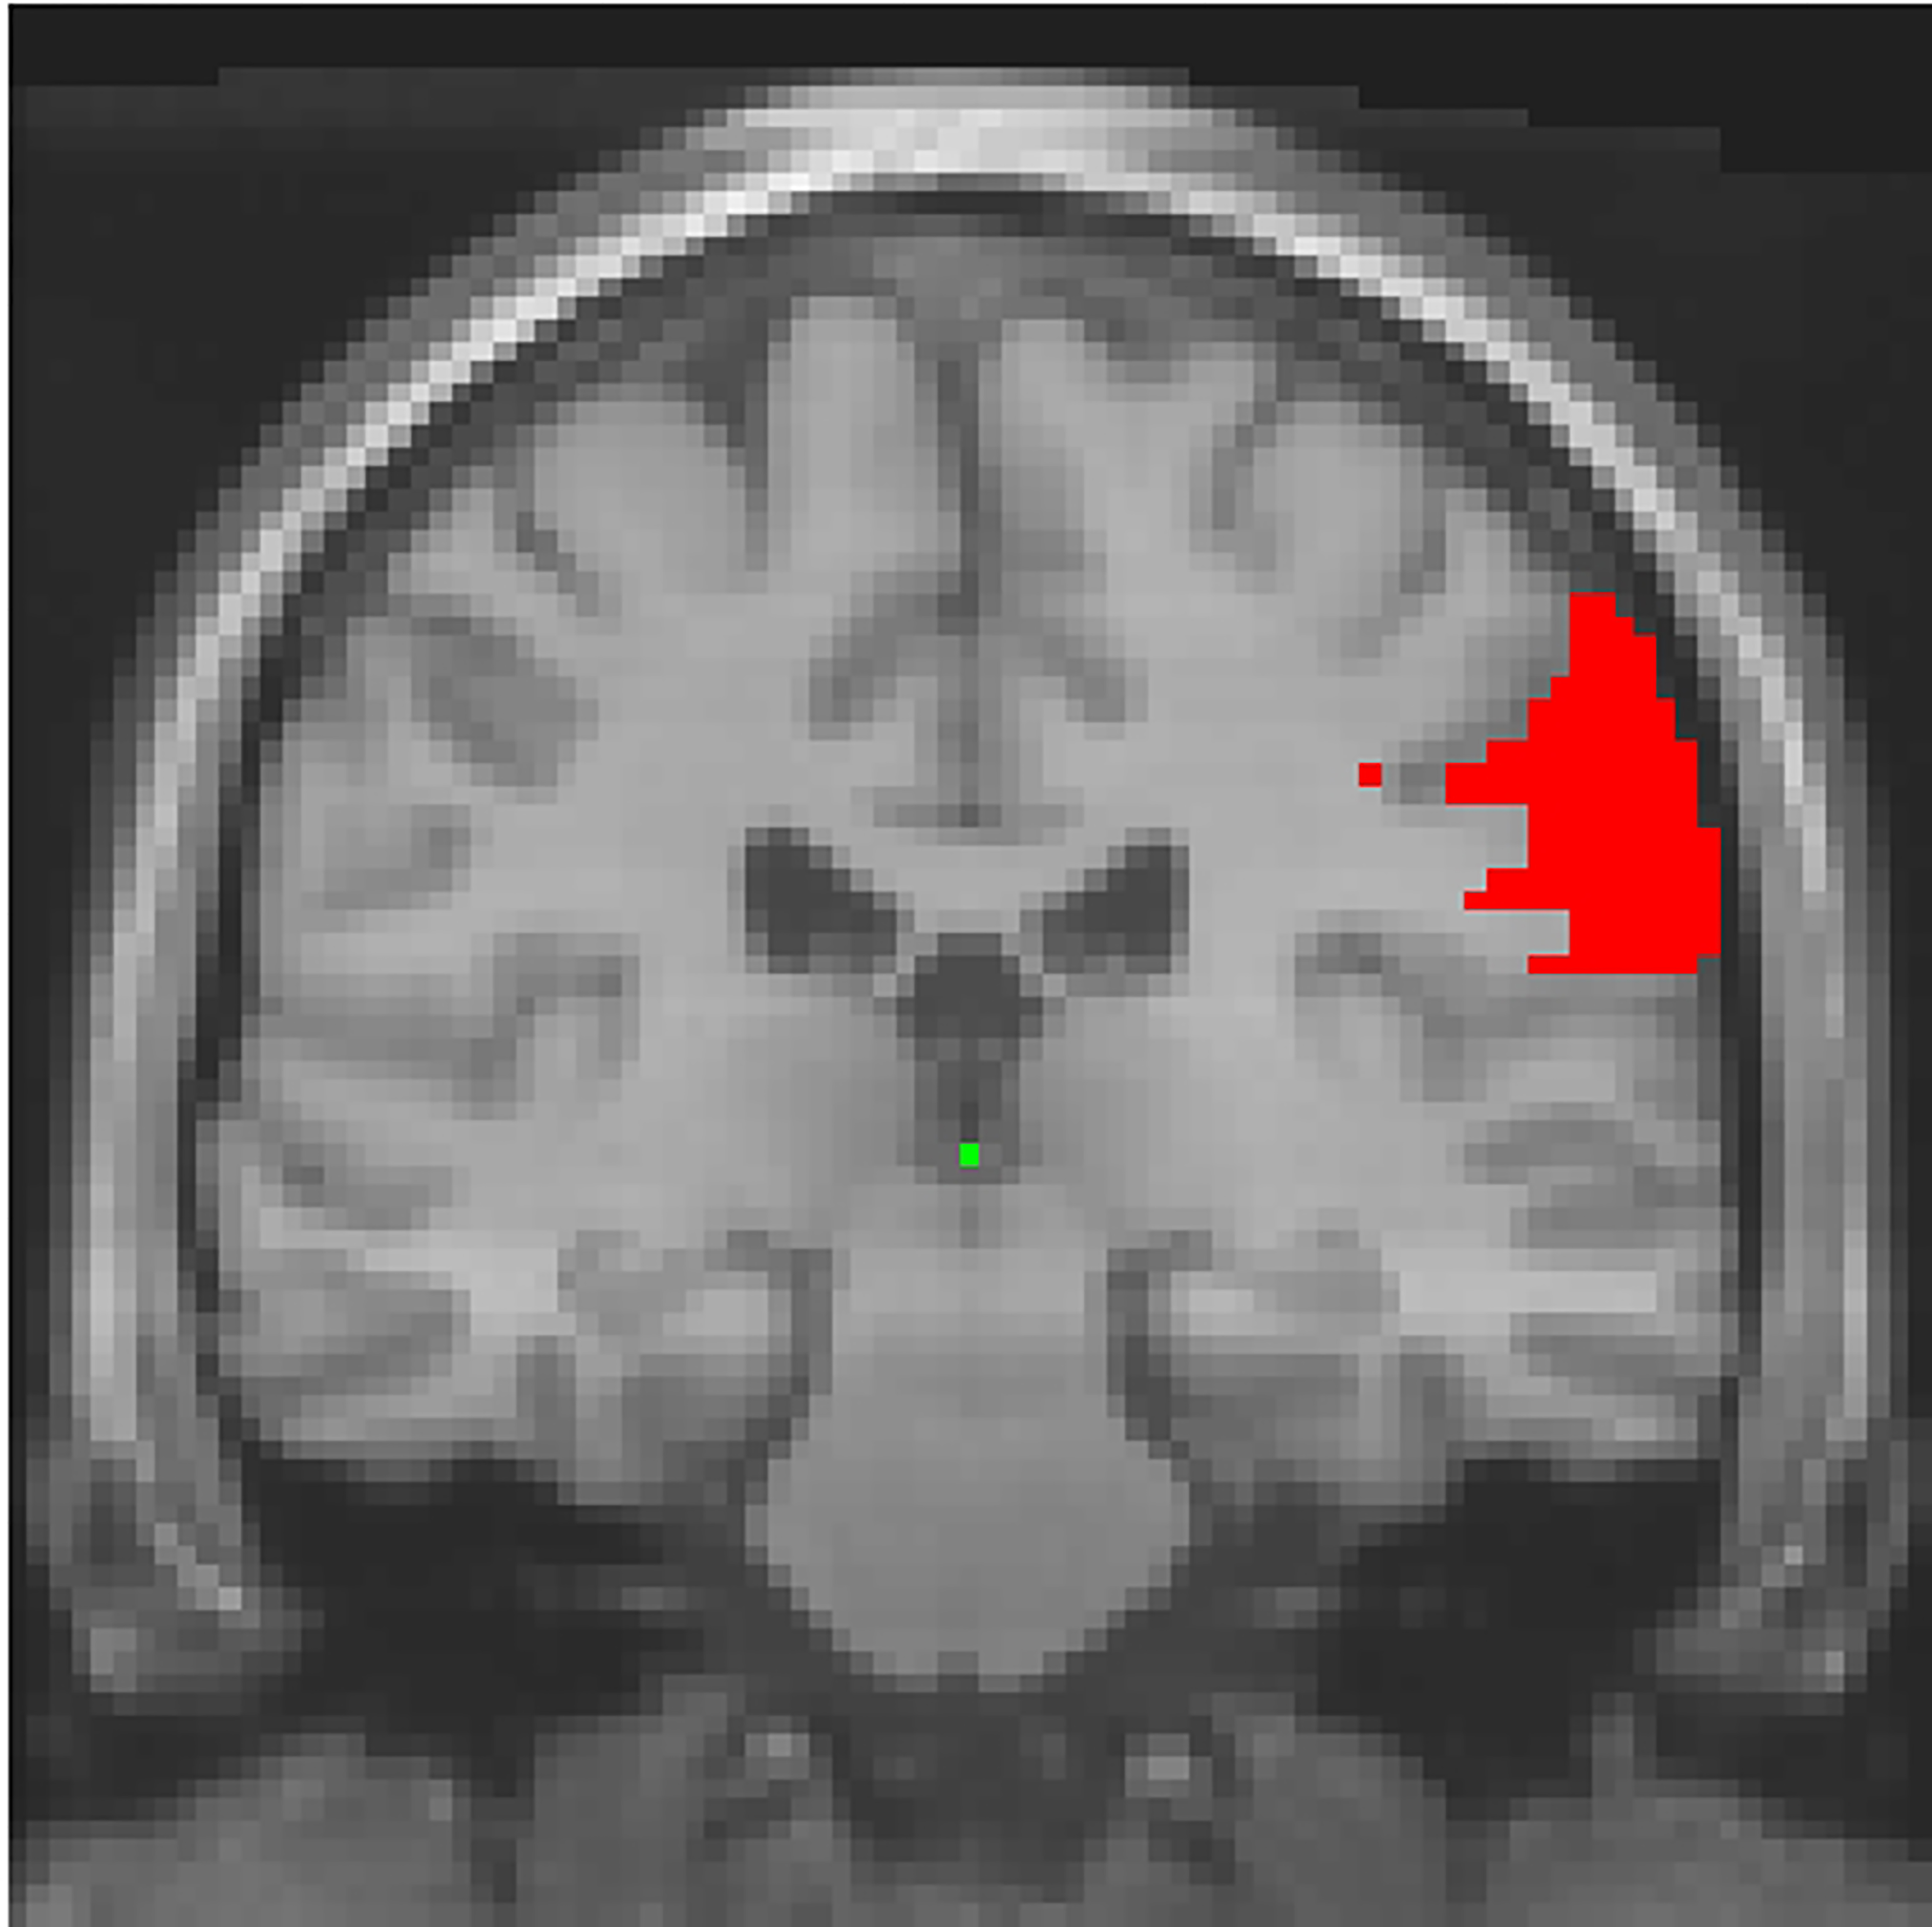
Left middle temporal gyrus. Right middle temporal gyrus.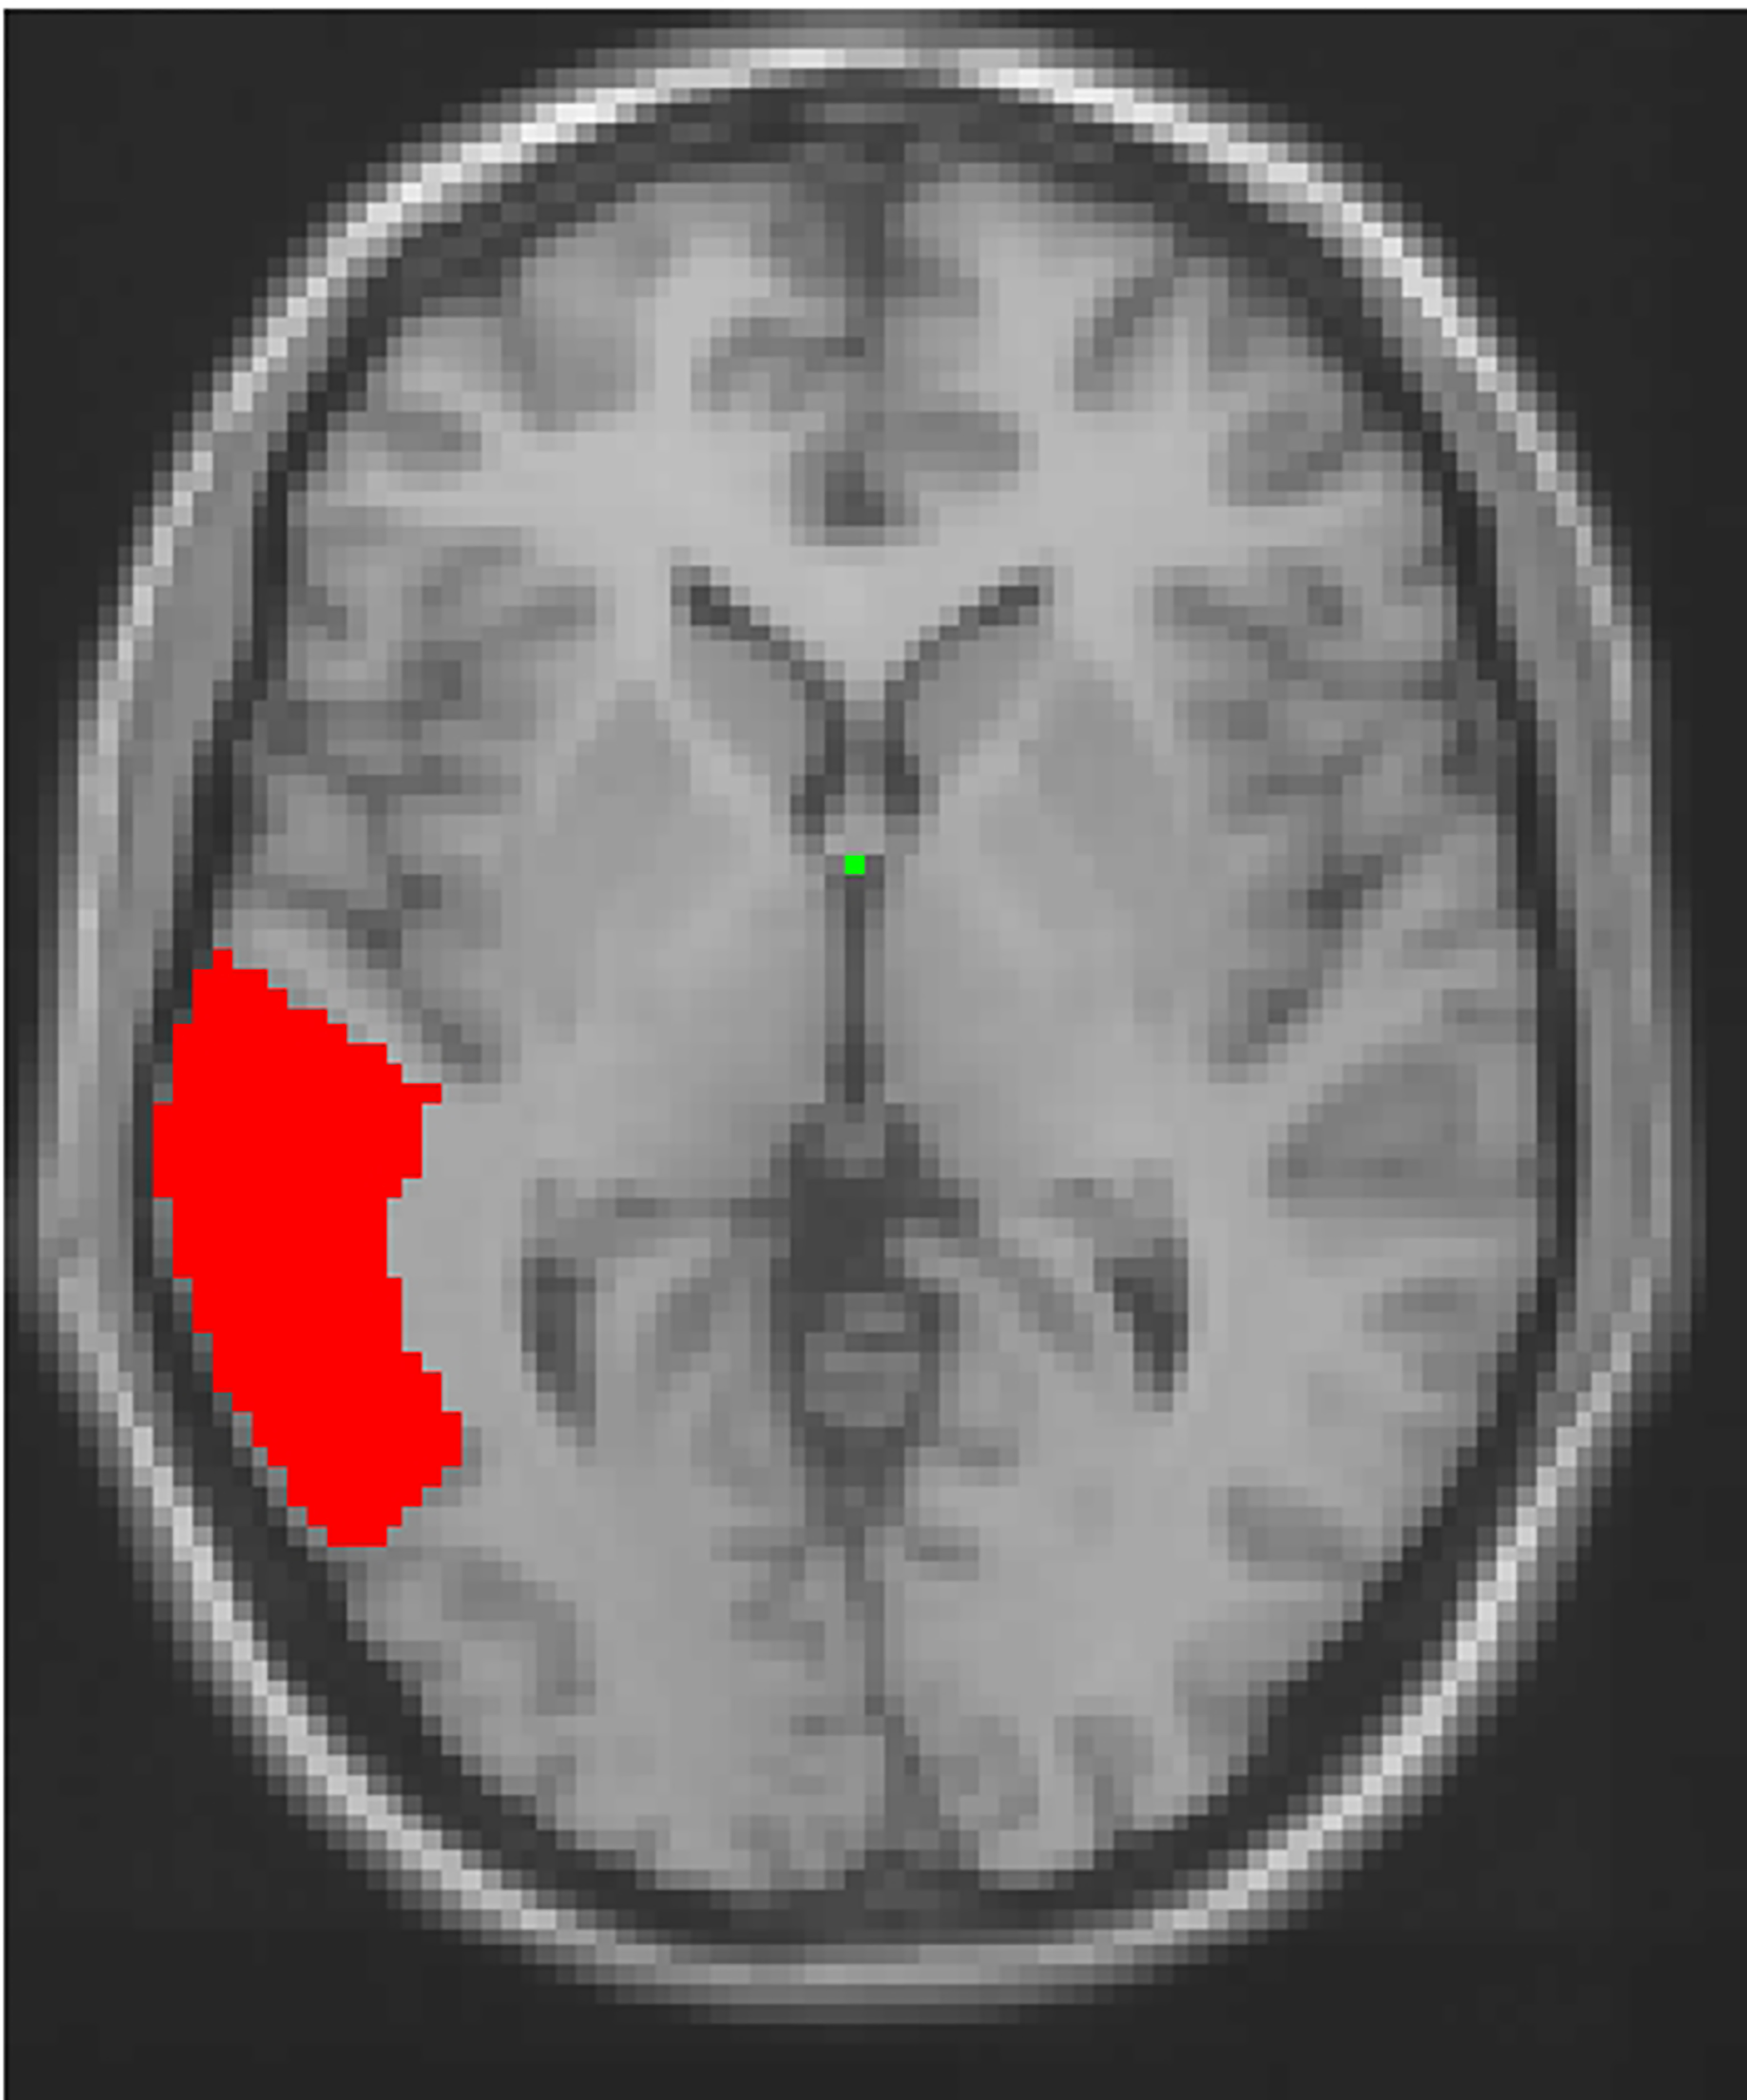
The results indicate that the characteristic path length increase because of the loss of functional connectivity among the 16 areas due to AD, whereby the degree of heterogeneity in Alzheimer becomes more random. Additionally, results of the previous studies report the abnormal path as consequence; hence, six out of eight studies have reported an increase in characteristic path length caused by Alzheimer. Moreover, results of four other studies reveal that the increase in path characteristic is indicative of rise in randomness [24]. Thus, it can be concluded that the results of this study are consistent with the results of studies that have been carried out previously. Another noteworthy point is the current study’s focus on areas, particularly those that typically show AD pathology, where there is no conformity between AD patients’ graphs. These areas play a crucial role in sensory integration of the temporal, parietal and frontal that connect other areas through long range cortical connections. In fact, loss of connectivity in such areas can lead to the elongation of the path in brain graphs. Another, graph parameter which was also considered in this study is the clustering coefficient. The clustering coefficient yielded from AD patients were less than that yielded from the Normal Controls. Accordingly, based on the obtained results, decrease of the clustering coefficient due to Alzheimer can be reflective of the atrophy process which is very similar brain cortex morphology in AD patients. Also, three studies out of eight found an increase in the clustering coefficient in AD, whereas the other two studies showed a decrease [24]. Furthermore, the analysis of the rs-fMRI graphs indicate an overall clustering coefficient reduction in the AD patients’ brain networks and efficient processing of local information in comparison to Normal Controls in the same age range [23]. Local and global efficiency tend to decrease in AD patients due to the elongation of the path length which is totally compatible with the findings of previous studies [24]. The small world brain network properties have also been considered in this study, whereby the condition of the small world properties of brain network has been met and satisfied (small world parameter value of higher than one); consistently it should be pointed out that only one AD patient had a small world parameter of less than one (approximately 0.93) which is caused by increase in randomness and loss of small world properties. However, the findings of previous studies claiming the loss of small world properties due to Alzheimer could not be proven in this study [25].
In this study, we implemented the classification of NC and AD groups, in accordance with the graph theory approach over rs-fMRI data. Accordingly, we applied some of the most fundamental graph properties containing useful information for identifying Normal Control from AD patients and showed that they are capable of separating the two aforementioned groups of individuals, and can therefore readily be used to diagnose Alzheimer. Nonetheless, one of the weaknesses of the current study is the small size of the examined data, and more research is needed for the assessment of larger sets of data before the method proposed in this study can be used in clinical applications.
Footnotes
Conflict of interest
None to report.