
Abstract
Gestational diabetes mellitus (GDM) is defined as glucose intolerance that is diagnosed in pregnancy period, leading to possible complications for both mother and fetus during pregnancy. The aim of this study was to build an objective method to evaluate diabetes mellitus (DM) risk from past GDM data recorded 15 years ago and find a short list of most informative indicators.
The dataset consists of demographic, lifestyle, clinical, genetic and pregnancy related information recorded 15 years ago. Due to the large time gap data are limited and have missing values (MVs). Follow-up tests were performed to see if DM or impaired metabolism has developed after pregnancy with previously diagnosed GDM. The research steps involve pre-processing data to evaluate MVs, finding most informative attributes and testing standard classification algorithms to combine in to most effective voting meta-algorithm. Initially the attributes and records with large number of MVs were rejected. A small percentage (2.04%) was imputed using regression based methods. The data set was prepared for two scenarios: classification in two classes (1-healthy; 2-impaired metabolism including DM) and three classes (1-healthy; 2-impaired metabolism; 3-DM).
Voting meta-algorithm combining best algorithms of 21 from five different groups including Bayesian, regression, lazy, rule, and decision trees makes classification more objective and not depending on preferences. Relative frequency of occurrence (RFO) analysis of attributes combined with voting meta-algorithm helped finding optimal amount of attributes giving best possible classification result. The algorithm applied to two class data set with 12 selected attributes produced accuracy of 75.85 and AUC
Meta-algorithm based classification of limited anamnestic GDM related data for DM prediction is proving to be effective. Testing multiple algorithms and performing RFO analysis appears to be natural and objective way of selecting most informative attributes and evaluating their importance.
Introduction
The prevalence of GDM is increasing worldwide, intensified with elder maternal age, ethnicity, obesity, family history of diabetes, and sedentary lifestyle [1, 2]. GDM is diagnosed in pregnancy, and increases the risk of complications for both – the mother and the fetus [3, 4]. Recognised risk factors include obesity and family history of T2DM which are steadily increasing in the general population [5]. It is estimated that GDM affects around 7% of all pregnancies worldwide although prevalence is difficult to estimate as rates vary from study to study because of a lack of accepted diagnostic criteria and differences in screening procedures [4]. Other systematic meta-studies also show that there are higher related risk of T2DM for women with GDM [6].
In addition to adverse outcomes during pregnancy and birth, the consequences of GDM extend beyond pregnancy with affected women having a seven fold increased risk of type 2 diabetes mellitus compared to women who have not had GDM [6]. Rates of T2DM after a diagnosis of GDM vary depending on the population and length of follow up, but have been reported to be as high as 70%. Women are thought to be at the greatest risk of developing T2DM in the first five years following a pregnancy with GDM, with incidence of T2DM plateauing at around 10 years. Although women who have had GDM are at an increased risk of T2DM, research has shown that by making lifestyle changes they can prevent or delay progression to T2DM [4]. GDM increases maternal and their offspring risk of T2DM, obesity and cardiovascular disease. Recent research indicates that high glucose levels or over nutrition during pregnancy can result in a ‘metabolic programming’ effect on the fetus, predisposing the child to early onset diabetes or obesity [7].
There are several recommendations of post-partum screening among health organizations. Normally first post-partum test is performed after weeks and if normal – annually. The standard tests include 75 g 2-hour glucose or fasting blood glucose test. The sensitivity and specificity data of those strategies do not exist [8]. The intensive studies involving machine learning methods mainly focuses on biomarker prediction and diagnosis of DM [9]. There are a limited number of studies of diabetes prediction in future for women with previously diagnosed GDM. However there is a lack of data related lifestyle, behaviour and inheritance including link with other pathophysiological conditions especially when talking about patients prior GDM. As DM develops after the GDM not in all women, there is a necessity of effective algorithm which is capable of classifying who of women are at highest risk for development of DM (even with limited anamnestic GDM related data with MVs) in to evolved pathologies during long period of time.
The missing values
When analysing anamnestic data, it usually comes with MVs. Some old records may be unclear to interpret while others are unknown or simply missing. The best case would be to avoid MVs in the data collecting stage, but in reality, especially in medical field and considering long time periods incomplete data is practically inevitable. For large datasets it would be simply possible to remove the records with MVs and leaving only complete data for further analysis. In small dataset removing all records with MVs can be critical, so softer approach to this issue should be used. The only way to soften the problem of MVs is to use an imputation method, which would fill the MVs with most probable data. If number of MVs in data set is high and not randomly distributed, there is a risk of oversimplifying the problem and producing invalid knowledge [10]. Classifying dataset containing significant amount of MVs can lead to series of difficulties such as loss of efficiency, complications in handling and analysis of data using standard tools and systematic bias rising between missing and complete data [11]. In the first stage of preprocessing the data having more than 10% of MVs are removed from dataset. According to Cheema if total percentage of missing values do not exceed 10%, the correlation between imputed and original data does not exceed 0.95 [12]. The remaining MVs can be imputed using one of several available methods. The most basic are statistical ones where MVs are replaced with mean of median of attribute values. They are least accurate, but easy and fast to implement. The more advanced method giving better accuracy and is K-Nearest Neighbor (KNN) imputation method, which computes the most similar instance of a given number of surrounding data when similarity is determined using distance function [13]. The regression based prediction models that try to predict the most probable attribute values from relations of existing data. They usually require preparation of data and predictors to specific cases and might not be suitable for small datasets with significant amount of MVs. In either case, the imputation is a synthetic process that normally doesn’t bring valuable information. The main reason of applying imputation to data with MVs is that it is easier to apply different classification algorithms. Also imputation allows avoiding bias errors that may rise due to possible correlation of MVs to class attribute [14]. The effectiveness of different imputation methods depend on classification algorithm used. One method closest to reality is using prediction based imputation [10]. For data with small number of MVs the regression based Iterative Robust Model-Based Imputation (IRMI) algorithm can be used, which iteratively fills missing attribute values, while remaining attributes serve as learning data. Algorithm is implemented in to VIMGUI package of R language which automatically adopts best regression model for the data [15].
Optimizing attribute set
The dataset with all possible attributes do not always mean best classification result. The higher dimension data may lead to negative effects like redundancy and noise. There are two method groups of selecting best performing attributes. One group is classifier independent where attributes are ranked by information input to target, other analyze correlation to find usefulness or redundancy [16]. It may be possible to find best attribute subset that works well with particular classifier, but with different classifier model wouldn’t be optimal. Second group of methods is more suitable for multiple classifier approach. One of the best practices is to use classifier-dependent attribute backward feature elimination method also known as wrapper. Wrapping allows eliminating attributes iteratively until smallest tolerable selected error rate is achieved [17]. In all tests default threshold of 1% is selected. Wrapper algorithm is robust and can be implemented before individual classification routines. The downside of wrapper method is that it cannot tell how attributes are ranked by importance [18]. Each algorithm may produce differing subset of attributes so they may need to be joined in to single subset when ensemble methods with multiple classifiers are used.
In this paper the main focus is to evaluate best voting meta-algorithm for prediction of evolving DM and impaired metabolism for women who have previously been diagnosed with GDM. The data were collected 15 and more years ago which have a limited number of possible attributes some having up to 30% of MVs. Recent repeated clinical tests have been made to find out if DM or impaired metabolism has been developed over the years. The data carries valuable long term information which may be used for predicting the evaluation of DM for women with prior GDM cases.
The aim of this study is to build an objective method and find the most informative attributes to evaluate DM and impaired metabolism risk from GDM complications recorded in remote past.
The tasks include following:
Processing MVs with minimal impact to classification error. Evaluating best performing classification meta-algorithm for DM prediction. Finding the minimal number of most informative attributes related with development of DM and impaired carbohydrates metabolism by classifying data in 2 and 3 classes.
Dataset analysis
The dataset was collected mostly in two time periods: 15 years old and more retrospective data was collected from women previously diagnosed GDM; and recently to detect if DM and impaired metabolism evolved. After pre-processing anamnestic data (when GDM was diagnosed) the final set consists of 151 patient records having 44 attributes. The attributes can be classified in to five groups including: demographic, the pregnancy related data during GDM diagnosis, clinical, genetic factors and lifestyle (Table 1).
Attributes and their short-codes used in dataset
Attributes and their short-codes used in dataset
39.4% of the women indicated that they did not follow any dietary and treatment recommendations during pregnancy. 46.3% of the participants followed dietary recommendations and 14.4% of the women received insulin therapy during GDM.
TCF7L2 is one of mostly researched gene in women having GDM [20]. The single nucleotide polymorphism (SNP) rs7903146 has shown strong associations with developing T2DM in different ethnical groups [21]. The relation has also been noticed of TCF7L2 SNPs rs290487, rs6585194 and rs7094463 between insulin resistance and insulin secrete for patients with diagnosed GDM [22]. Totally eight SNP related attributes have been included in the research dataset for analysis.
The largest part of data consists of lifestyle habits that relate to occupation, physical activity and eating habits which was acquired by filling questionnaire form.
The recent diagnostic data serves for class assignment:
For preprocessing clinical data the IRMI algorithm has been chosen in order to get best possible values for imputation. No other imputation methods have been tested since total amount of MVs in cleaned dataset is low (2.04%) which leads to minimal impact to results. Testing multiple imputation methods is beyond the scope of this research.
Waikato Environment for Knowledge Analysis (WEKA) data mining software, hosted by University of Waikato, has an extensive set of machine learning tools that may be used to run multiple experiments [23]. By analyzing included machine learning algorithms, total of 21 classifiers from five groups were selected for further experiments, including Bayesian, regression, lazy, rule based, and decision trees (Table 2).
Selected algorithms for research
Selected algorithms for research
Each algorithm has its pros and cons. The models of regression algorithms including support vector machine (SVM) have lower variance, but higher bias leading to underfit. Decision trees are prone to overfit but work well with categorical data. Bayesian algorithms are computationally fast, work well with large number of attributes but relies on independence assumption [24, 25].
The five best classification algorithms from different groups are selected by the highest area under ROC (AUC) value. Each selected algorithm is included in voting meta-algorithm where result are combined in to final prediction using averaging of results [26, 27].
In this study the wrapper and relative frequency of occurrence (RFO) [28] methods together were used to filter and rank attributes by importance. The proposed ranking method works in two stages: finding most informative attribute subsets for each standard algorithm using wrapper method. Then all subsets are combined in to single set by calculating RFO for each attribute as seen in Fig. 1.
Calculation RFO of attributes using two stage method: wrapper and RFO.
The attributes with highest RFO can be marked as most informative. The accuracy of this method may depend on number of classification algorithms used in the first stage.
During test stage, each classification algorithm is run iteratively within wrapper algorithm (Fig. 1) to find the smallest subset of informative attributes. As the optimization criteria the AUC parameter is selected since it represent better intuition between sensitivity and specificity [29]. Each algorithm performs a 10-fold cross-validation in order to get a more generalized and independent classification results leading to less overfitting.
Data preparation and processing missing values
The amount of MVs in dataset ranges from 0% to more than 30% on each attribute. More than 10% of MVs for a single patient record were considered to have high impact to final classification error, so they were rejected initially. The total amount of remaining MVs were 2.04%, and according to [12] imputation is suitable in order to get classification results close to possible true complete data. The final dataset consists of 44 attributes and 151 patient records.
The dataset with small amount of remaining MVs were imputed by regression based IRMI algorithm using VIMGUI package of R language. After imputing missing values, dataset was prepared for two test cases – classification in two classes and three classes. For 2 class setup 43.71% of records are assigned to class 1 (healthy); to class 2 (impaired carbohydrates metabolism including DM) 56.29% of records. For 3 class problem to class 1 (healthy) there are 43.71% of records assigned, to class 2 (impaired carbohydrates metabolism) – 15.89% of records and to class 3 (DM) – 40.4%.
Two class test results
Test results of every algorithm are represented in Fig. 2 box plot diagram where statistical distribution of 10 times cross validation is visible. Classification algorithms are compared by mean AUC parameter. Testing of algorithms shows that best performing is Logistic classifier having accuracy of 78.54% and AUC 0.85 with standard error 0.03. The selected number of optimal features is 15 (X1, X5, X7, X9, X11, X12, X13, X16, X17, X23, X,31, X40, X43, X44). The following high performing algorithms are Naïve Bayes, KStar and Hoeffding tree having AUC values of 0.83 with attribute numbers of 13, 13 and 11 respectively.
Box plot of performance of classification algorithms compared by AUC parameter.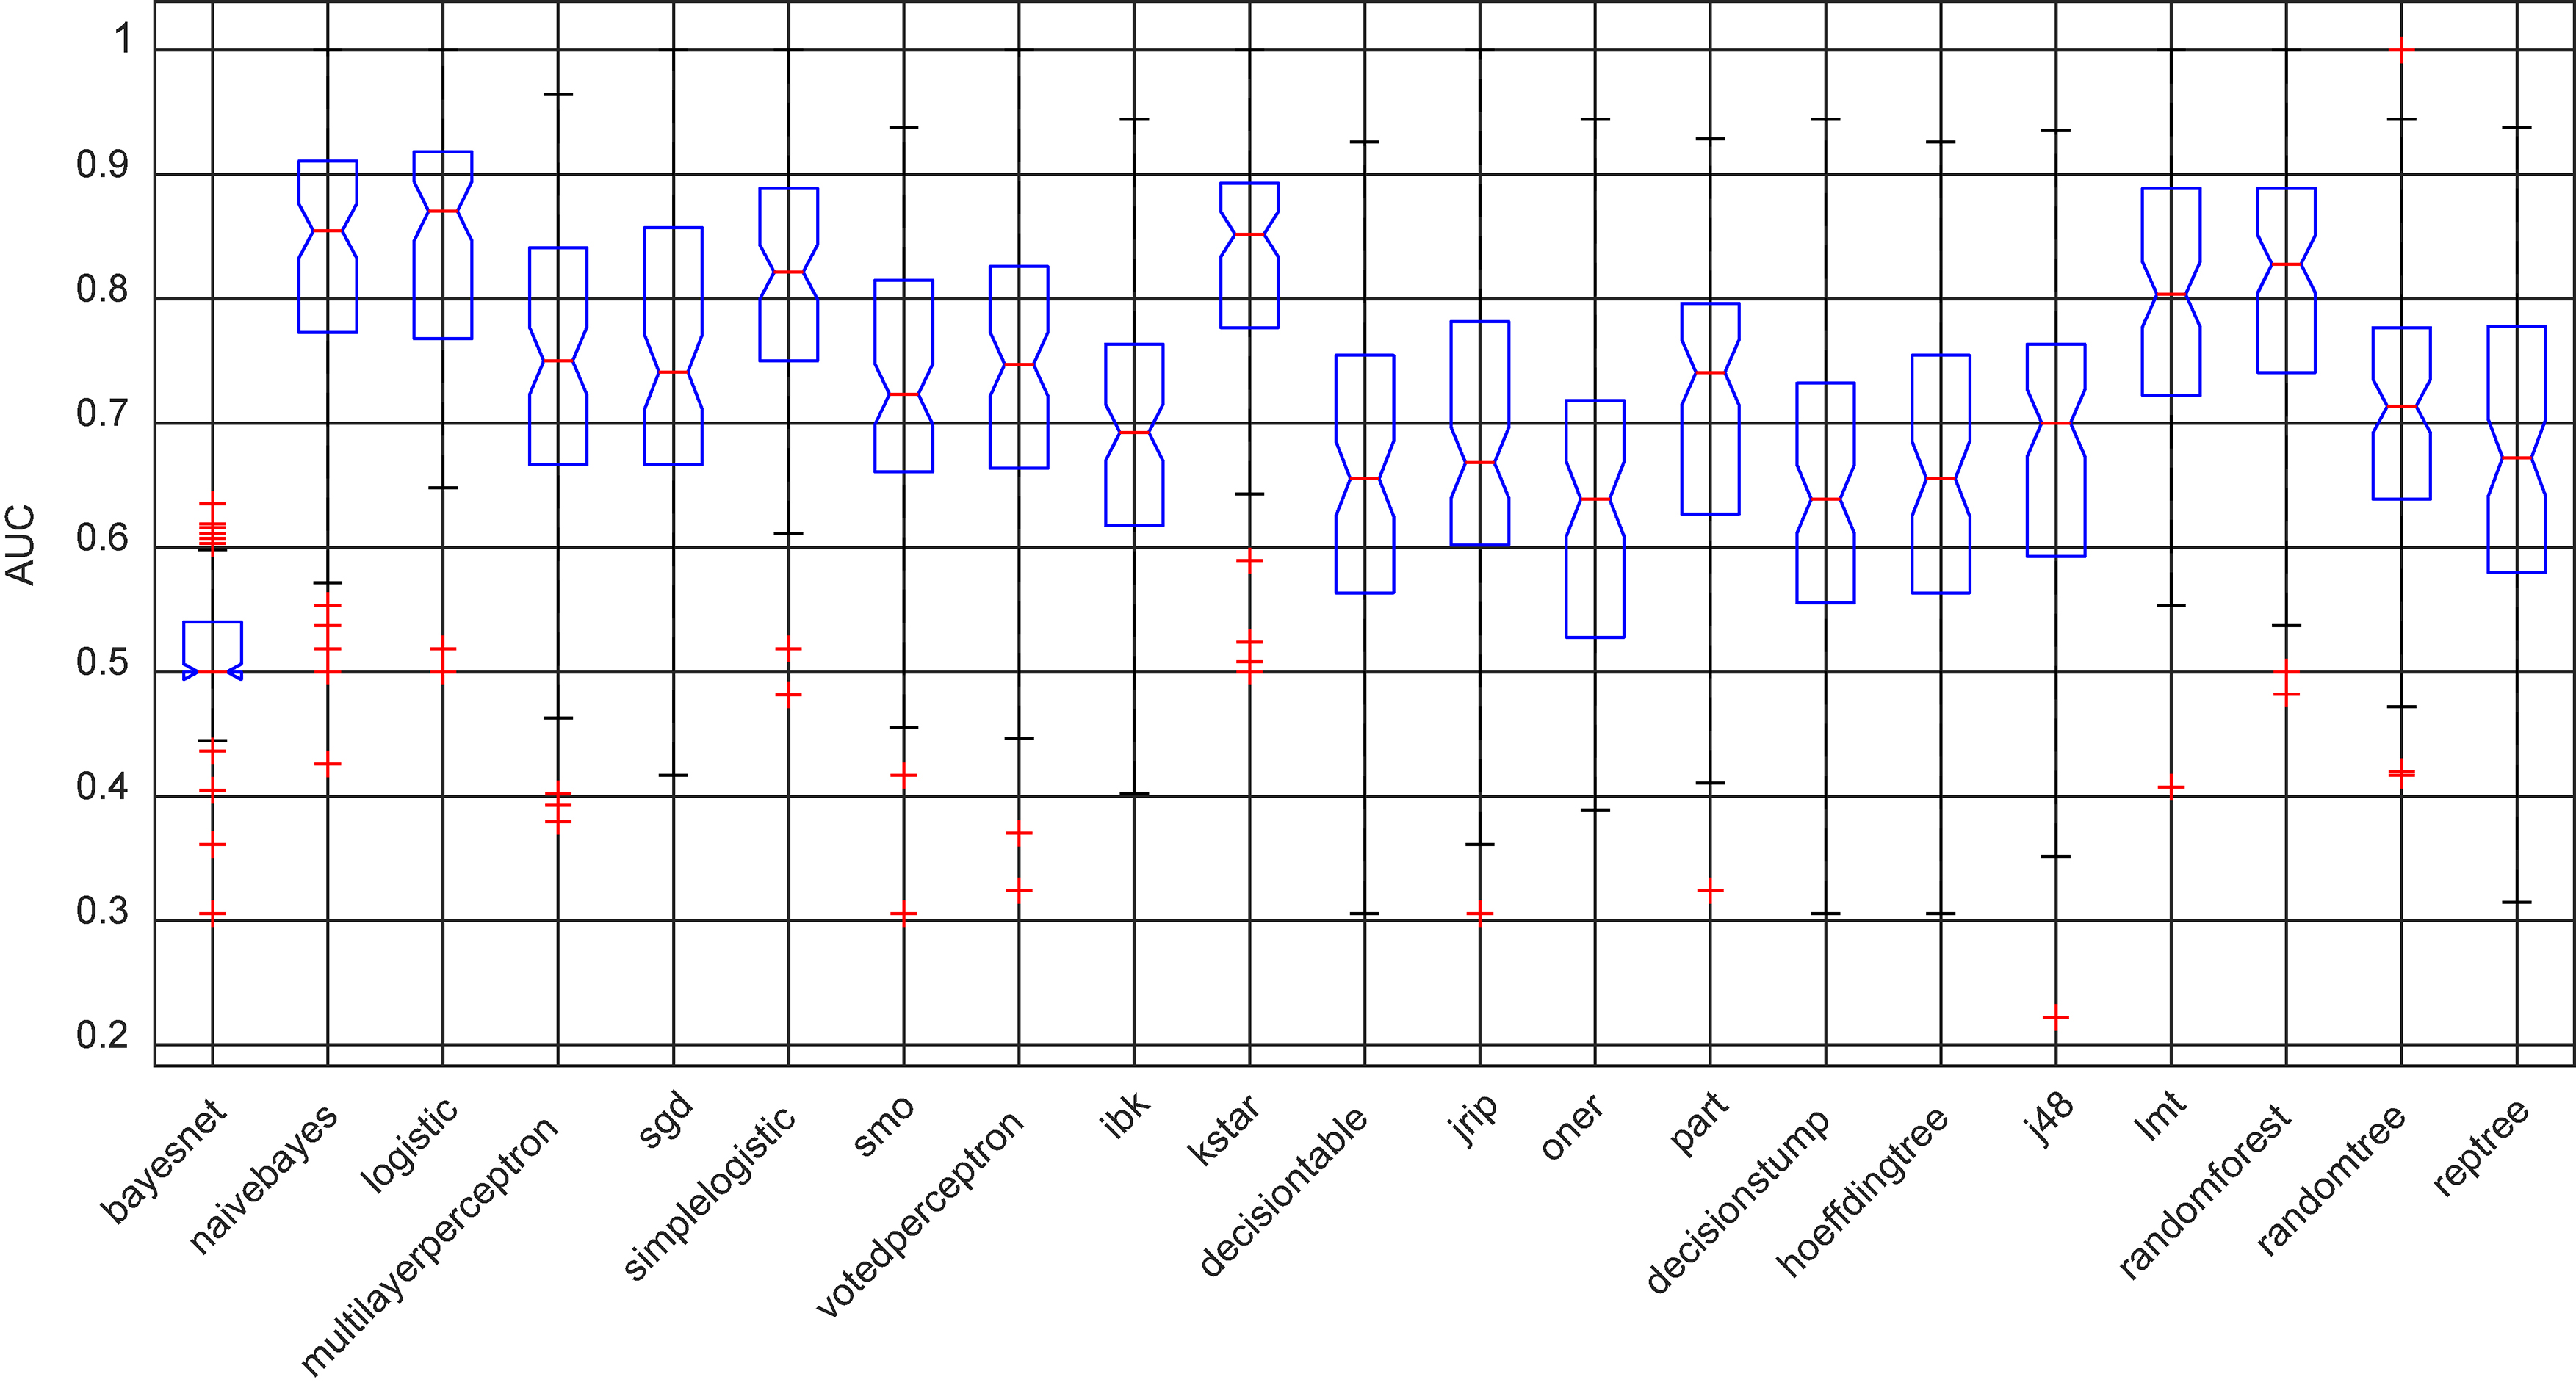
All 21 classification algorithms generated their own optimal set of attributes using wrapper method. RFO of attribute of all tested algorithms indicate the ranking by their importance. Evaluation of attribute appearance frequency indicates most informative ones while the rest – rarely appearing – can be omitted thus saving clinical resources.
Attribute RFO chart of all tested classification algorithms for two class problem. Axis x values indicate attribute index (see Table 1 for reference).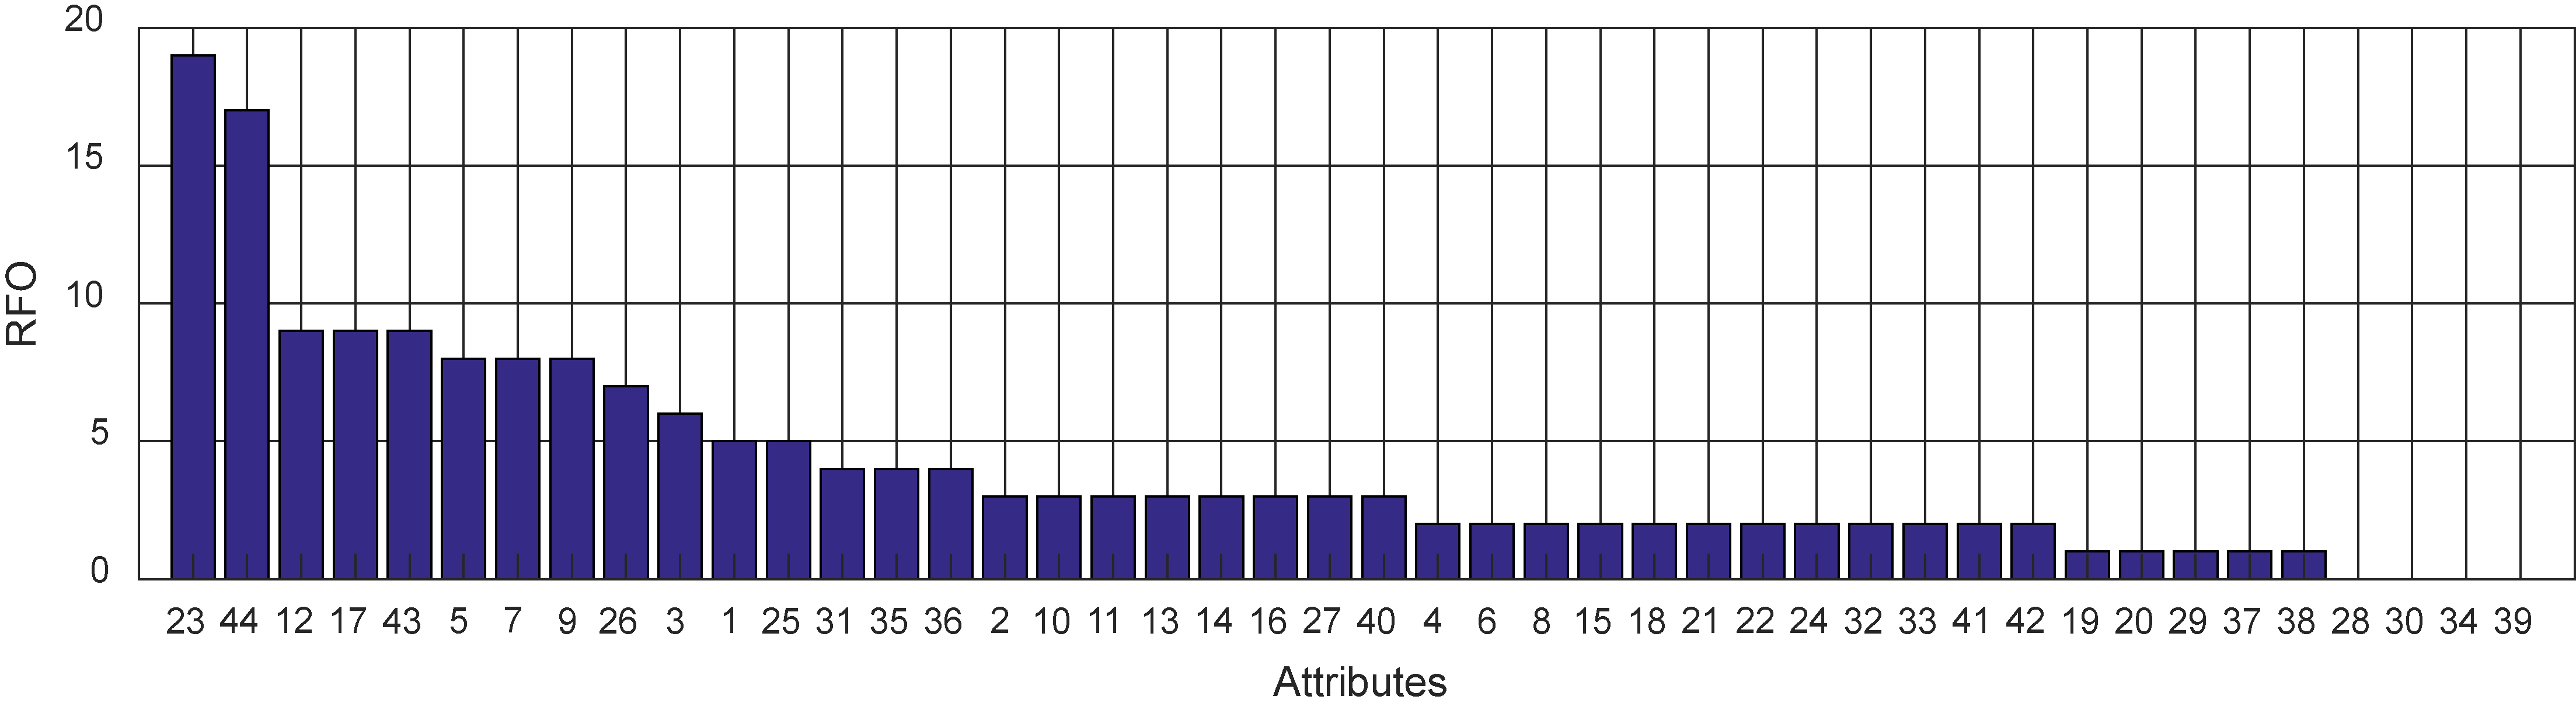
Box chart of performance of classification algorithms.
As can be seen in Fig. 3 the most commonly used attributes are X23 – ‘income level’ and X44 – ‘sugar consumption’ attributes that are selected by almost all classification algorithms. The following six are less than twice frequent in all classification algorithms. Further attributes are gradually losing their importance and few attributes (X28, X30, X34 and X39) are not even selected by any classification algorithm. The RFO analysis sorted attributes by their importance allowing to select most informative in order to reduce cost in decision making.
In the second scenario, the same dataset with three class attribute was tested. In this case the accuracy and AUC values came out lower. The best performing algorithm was Hoeffding tree (Fig. 4) with accuracy 63.57%, AUC
In the attribute RFO chart (Fig. 5) it can be seen that the leading attribute is X44 – ‘sugar consumption’ which was selected by all tested algorithms. It can be considered one of potential major causes of developing DM type 2. The other attributes appear moderately important and further loose importance Fig 6. In this case several attributes including X11, X13, X14, X15, X25, X29, X40 and X42 were also not selected by any algorithm and can be excluded from further research.
Attribute RFO chart of all tested classification algorithms for three class problem. Axis x values indicate attribute index (see Table 1 for reference).
In each test case the attributes were sorted according to their RFO. In order to find RFO threshold from which most informative attributes give the best classification result, the voting meta-algorithm was implemented. In meta-algorithm the best classification algorithms from each group were implemented. The final AUC score was calculated by averaging resulting AUC distributions of each classifier [30].
AUC parameter dependence on RFO threshold of attributes used in meta-algorithm.
In Fig. 6 it can be seen that AUC curves depend on RFO threshold of selected attributes in meta-algorithm for both scenarios. Both AUC curves have peaks at 20% RFO threshold point. In two class problem, the number of selected optimal attributes is 12 and in 3 class case – 19. Towards the lower selected RFO threshold values AUC parameter drops because less informative and probably even misleading attributes are included. Similarly AUC value is dropping down when higher attribute RFO threshold points are used. This happens because at higher values more informative attributes are rejected resulting in higher errors in classification results.
In Fig. 7 it can be seen that the number of most informative attributes depends on different selected RFO thresholds. For instance in class 3 case the AUC values at the RFO thresholds 20% and 30% do not differ significantly with values 0.775 and 0.76 respectively but number of selected attributes differ significantly – from 19 vs 9 attributes. It is worth to consider selecting 30% RFO threshold for better clinical resource saving and cost effective solution. The t-paired statistical test between 20% and 30% RFO threshold points with significance level of 0.05 showed that difference is insignificant with calculated
Classification meta-algorithm results at the optimal RFO threshold points are presented in Table 3.
Meta-algorithm results at the optimal attribute subset selection point
Number of attributes N depending on different RFO thresholds of attributes used in meta-algorithm.
Using meta-algorithm is more objective way of classifying subjects than relying on single best performing standard classifier, because it diversifies results of best algorithms from different groups. It allows minimization of possible specific errors and bias brought by distinct algorithms.
This work describes the applications of modern data mining approach to solve DM classification/prediction problem for women with previously diagnosed GDM using anamnestic data collected 15 years ago. The MVs of dataset were filled by using regression method. Other imputation methods were not tested because the amount of MVs was not big (2.04%) and according to Cheema correlation between possible original dataset and imputed data is above 0.95 [12].
The dataset was prepared by assigning two and three class attributes: the two class attribute contain healthy patients and DM joined with impaired carbohydrate metabolism.
Voting meta-algorithm combining best algorithms of 21 from five different groups makes classification more objective and not depending on preferences. The RFO analysis of attributes and voting meta-algorithm based optimization helped finding optimal threshold point indicating minimal amount of attributes from RFO ranking list.
For two class scenario the optimal attribute cut off frequency is 20%. The optimal number of attributes is 12 and they are ranked by importance as follows: X23 – ‘income level’, X44 – ‘sugar consumption’, X12 – ‘rs7903146_CC’, X17 – ‘rs12255372_GG’, X43 – ‘desserts’, X5 – ‘year of first given birth’, X7 – ‘weight before pregnancy with GDM’, X9 – ‘weight of first born child’, X26 – ‘physical activity’, X3 – ‘number of given births’, X1 – ‘residence’, and X25 – ‘time needed to get to work’ (Table 1 for reference). Using selected attributes, meta-algorithm produced accuracy 75.85 and AUC
In both classification cases the number of attributes were reduced from 44 to 12 (two classes) and 9 (three classes) indicate the potential of saving clinical resources while collecting data.
Comparison of the proposed method with similar research
Comparison of the proposed method with similar research
We can see a comparison of one similar study that has been found during study in Table 4. The study was mainly focused on DM prognosis in a Caucasian population. The secondary test on a group was performed after 4 years which is small enough compared to our study. Their prognosis included glycated haemoglobin test result which is considered a strong predictor. In our study we have not included any glucose tests, but results of AUC are on the same level. This indicates that even without a control of initial attributes the proposed method provides strong results.
This work shows that data mining and computation methods can be effectively adapted to clinical medicine that uses patient specific information to predict outcome of interest. Standard classification algorithms combined into voting meta-algorithm, attribute ranking methods such as RFO could be applied to the construction of predictive models for prognosis of developing DM for women with a GMD diagnosis. Since the proposed approach is quite objective and adaptable, the algorithm could be applied far beyond DM problems, e.g. for other similar classification tasks when datasets have lot of attributes and MVs.
Limitations and further research
There might be several influences in to objectivity of the results. Instead of the initial rejection of the records with most appearing MVs there could be iterative evaluation process included. There can be situation, when rejected attributes could have significant value to classification and those might be treated differently. There can be more attention payed to data pre-processing stage and more comprehensive analysis of MVs could be performed.
There was an attempt to find the rank of attributes by calculating their RFO. The number of the classification algorithms used can also influence the ranking result. The more objective ranking result could be achieved by including more classification algorithms and their variations.
Ranking value of attributes could also be augmented by introducing attribute cost evaluation. The more expensive clinical test could be more penalized than simple data collection. Thus the economic gain could be achieved by reducing data acquisition cost. With the bigger and more complete data there could be even more classes included to classify in to more cases.
The algorithms in WEKA were used with their default parameters. The initial study showed that default settings work well, so no further parameter tweaking was performed. In order to fine-tune the results, parameter optimization could potentially positively influence the results.
Footnotes
Conflict of interest
None to report.