



Abstract
BACKGROUND:
Blood vessels are constantly exposed to flow-induced stresses, and endothelial cells (ECs) respond to these stresses in various ways.
OBJECTIVE:
In order to facilitate endothelialization after endovascular implantation, cell behaviors around a metallic wire using a flow circulation system are observed.
METHODS:
A parallel flow chamber was designed to reproduce constant shear stresses (SSs) on cell surfaces and to examine the effects of a straight bare metal wire on cell monolayers. Cells were then exposed to flow for 24 h under SS conditions of 1, 2, and 3 Pa. Subsequently, cell distributions were observed on the plate of the flow chamber and on the surface of the bare metal wire. Flow fields inside the flow chamber were analyzed using computational fluid dynamics under each SS condition.
RESULTS:
After 24 h, ECs on the bottom plate were concentrated toward the area of flow reattachment. The matching of higher cell density and CFD result suggests that flow-induced stimuli have an influence on EC distributions.
CONCLUSION:
Typical cell concentration occurs on dish plate along the vortexes, which produces large changes in SSs on cell layer.
Introduction
Restenosis and thrombosis are occasional complications of artery stenting [1, 2, 3, 4]. Due to the fact that expanding stents exert a pressure on the vascular intima, stent wires injure endothelial cell (EC) layers and expose the underlying smooth muscle cells (SMCs). Previous studies showed that EC layers prevent thrombus adhesion [5] and suppress excessive SMC proliferation in the neointima [6]. Thus, the clinical complications of stents are considered to be a consequence of incomplete endothelialization or endothelial dysfunction around stents.
EC layers are constantly exposed to blood flow in blood vessels, and they respond to the resulting shear stress (SS) in various ways. Several studies suggested that both low and high SS are a factor of arterial dysfunction through inflammatory response, cell apoptosis, macrophage adhesion, and so on [7, 8, 9, 10, 11]. Not only in biological signaling, the influence of SS can also be observed from a morphological view. The shapes and orientations of ECs have been related to local SSs, and EC layers are elongated in the direction of flow under certain levels of SS [12, 13, 14, 15]. Szymanski et al. observed cell migration toward areas of high SS [16].
Due to the fact that SS distributions on vessel surfaces have various effects on EC activities, changes in SSs due to the presence of medical implants have attracted increasing research attention. Moreover, changes in the flow distributions on vessel surfaces have been shown following stent deployment [17], and several flow simulations have been performed in order to characterize the impacts of stents on flow environments [18, 19, 20].
Although numerous studies have reported the computational fluid dynamics (CFD) for stent design, no published studies reported EC responses around stent wires in vivo. Thus, to investigate the influence of SSs on endothelialization around a stent wire, we exposed EC monolayers to a range of flow pressures using a parallel flow chamber with a straight bare metal wire, and then we analyzed the EC distributions around the wire. Due to the fact that direct observations of flow conditions around the wire were untenable, we inferred flow conditions using CFD and correlated flow patterns with EC activities.
Materials and methods
ECs
Human carotid artery ECs were used at passages 7–9 (cell applications) and two-dimensional cultures were grown to confluence in 35 mm dishes coated with a gelatin solution (Wako Pure Chemical Industries, Ltd.). Proliferation media (PM) comprised Medium 199 (Gibco) containing 20% fetal bovine serum (Sigma), 1% penicillin/streptomycin (AUSTRAL Biologicals), and 0.001% human basic fibroblast growth factor (FGF; AUSTRAL Biologicals), which were used for cell culture and flow-exposure experiments.
Flow exposure
A pulse damper, flow chambers, a reservoir, and a roller pump with silicone tubes were connected in series to construct a flow loop for flow-exposure experiments (Fig. 1). This pulse damper was used to attenuate pulsation and provide a steady flow through the flow chamber. Carbon dioxide gas (5% CO
A schematic of the flow loop.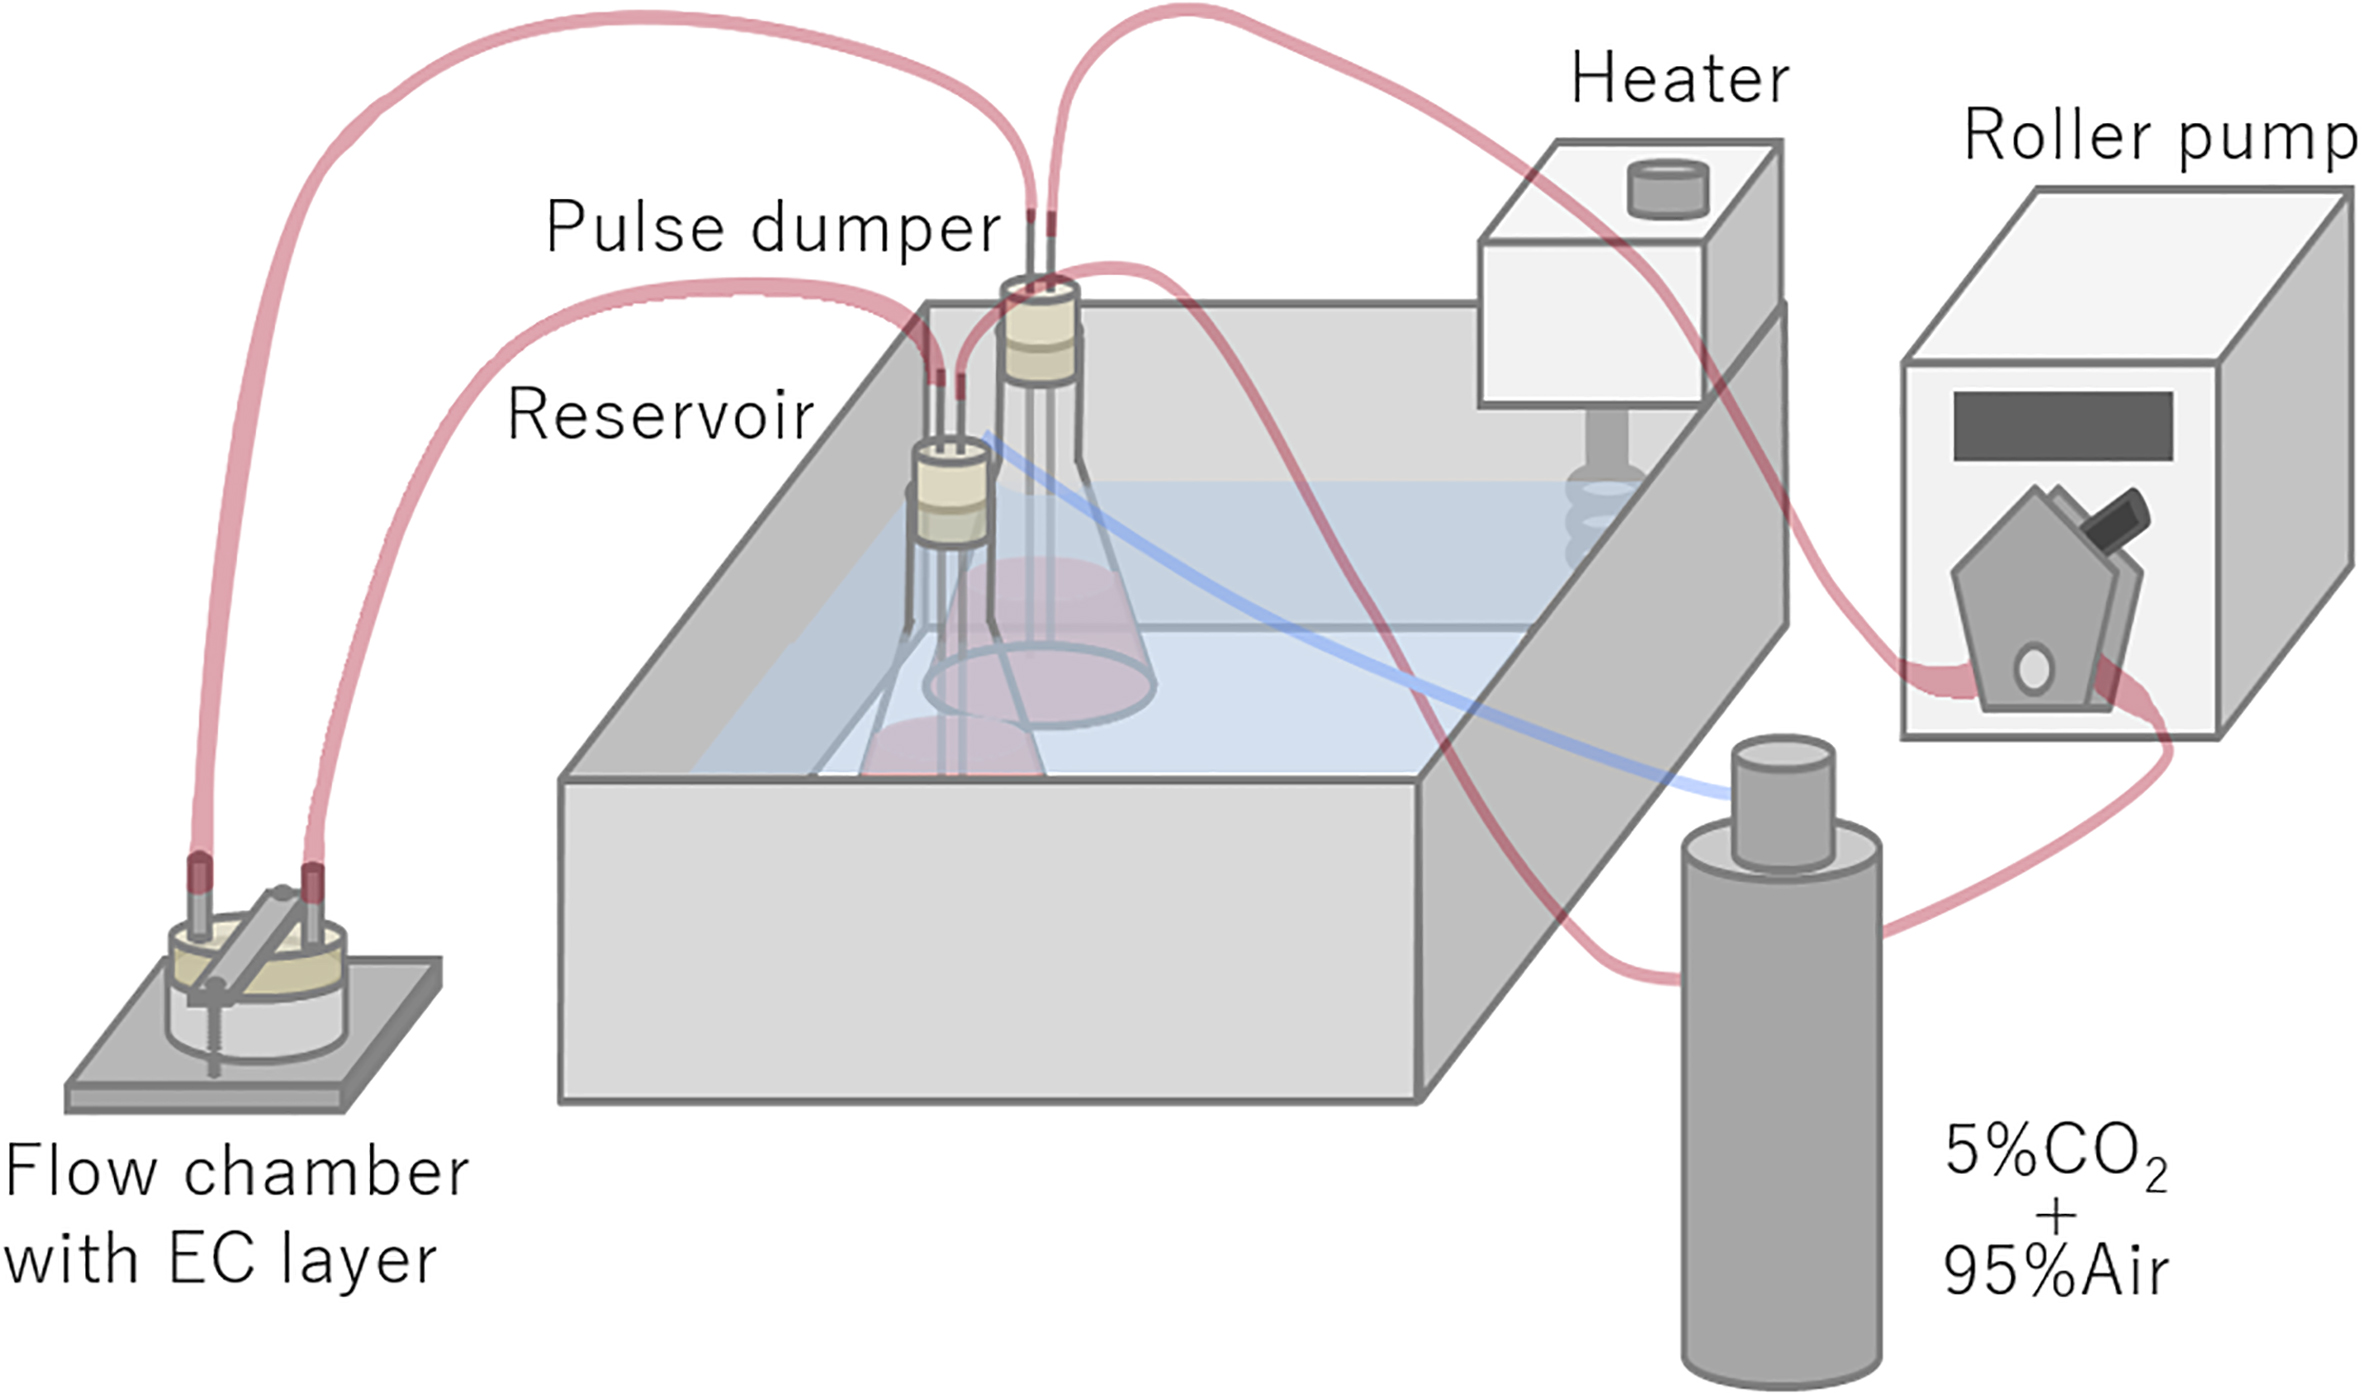
A schematic of the flow chamber. Left shows 3D schematics, and right shows numerical meshes for CFD on a cross-sectional plane of chamber.
SSs were applied to ECs in parallel plate flow chambers (Fig. 2) as similar described previously [21]. A NiTi wire with a cross section of 0.406
SSs were applied at 1, 2, or 3 Pa by adjusting the flow rate of the roller pump to 1.08
After 24 h of flow exposure, ECs were fixed in 4% paraformaldehyde for 15 min at room temperature and were then washed five times in phosphate buffered saline (PBS). In order to permeabilize the EC membranes, cells were treated with 1 mL aliquots of 0.2% Triton X-100 (Roche Applied Science) for 5 min and were then washed five times in PBS. In order to detect F-actin filaments, ECs were incubated with Alexa Fluor
Fluorescent images of ECs were generated using an inverted laser scanning microscope system (Olympus), and the upper and side surfaces of the wire were observed. Cell densities were calculated from the number of cells adhered on each surface, and the number of nuclei was determined in 0.1
Numerical simulations
To calculate wall SS (WSS) distributions in the flow chamber, we used a numerical model (Fig. 2) and performed simulations using a commercial mesher and solver (ICEM-CFD 14.5 and ANSYS Fluent 14.5, ANSYS Inc.). In these analyses, fluids were assumed to have a viscosity of 0.001 Pa
Results
Flow field
CFD analyses showed that a flow field in the flow chamber was achieved. However, because of the sudden contractions in the fluid domains, a high SS was observed on the top surface of the wire, and vortex flows appeared upstream and downstream of the wire. Consequently, the upstream side of the wire’s surface was exposed to a lower-drag force in a narrow area near the bottom. Moreover, due to the fact that the vortex on the upstream side was small, most of the upstream side of the wire was exposed to an upper-drag force. In contrast, the downstream surface was exposed to upper-drag forces in all areas (see Fig. 3a).
CFD results as flow fields around the wire. (a) WSS distributions on the dishes. (b) Velocity vector on a cross-sectional plane of the flow chamber.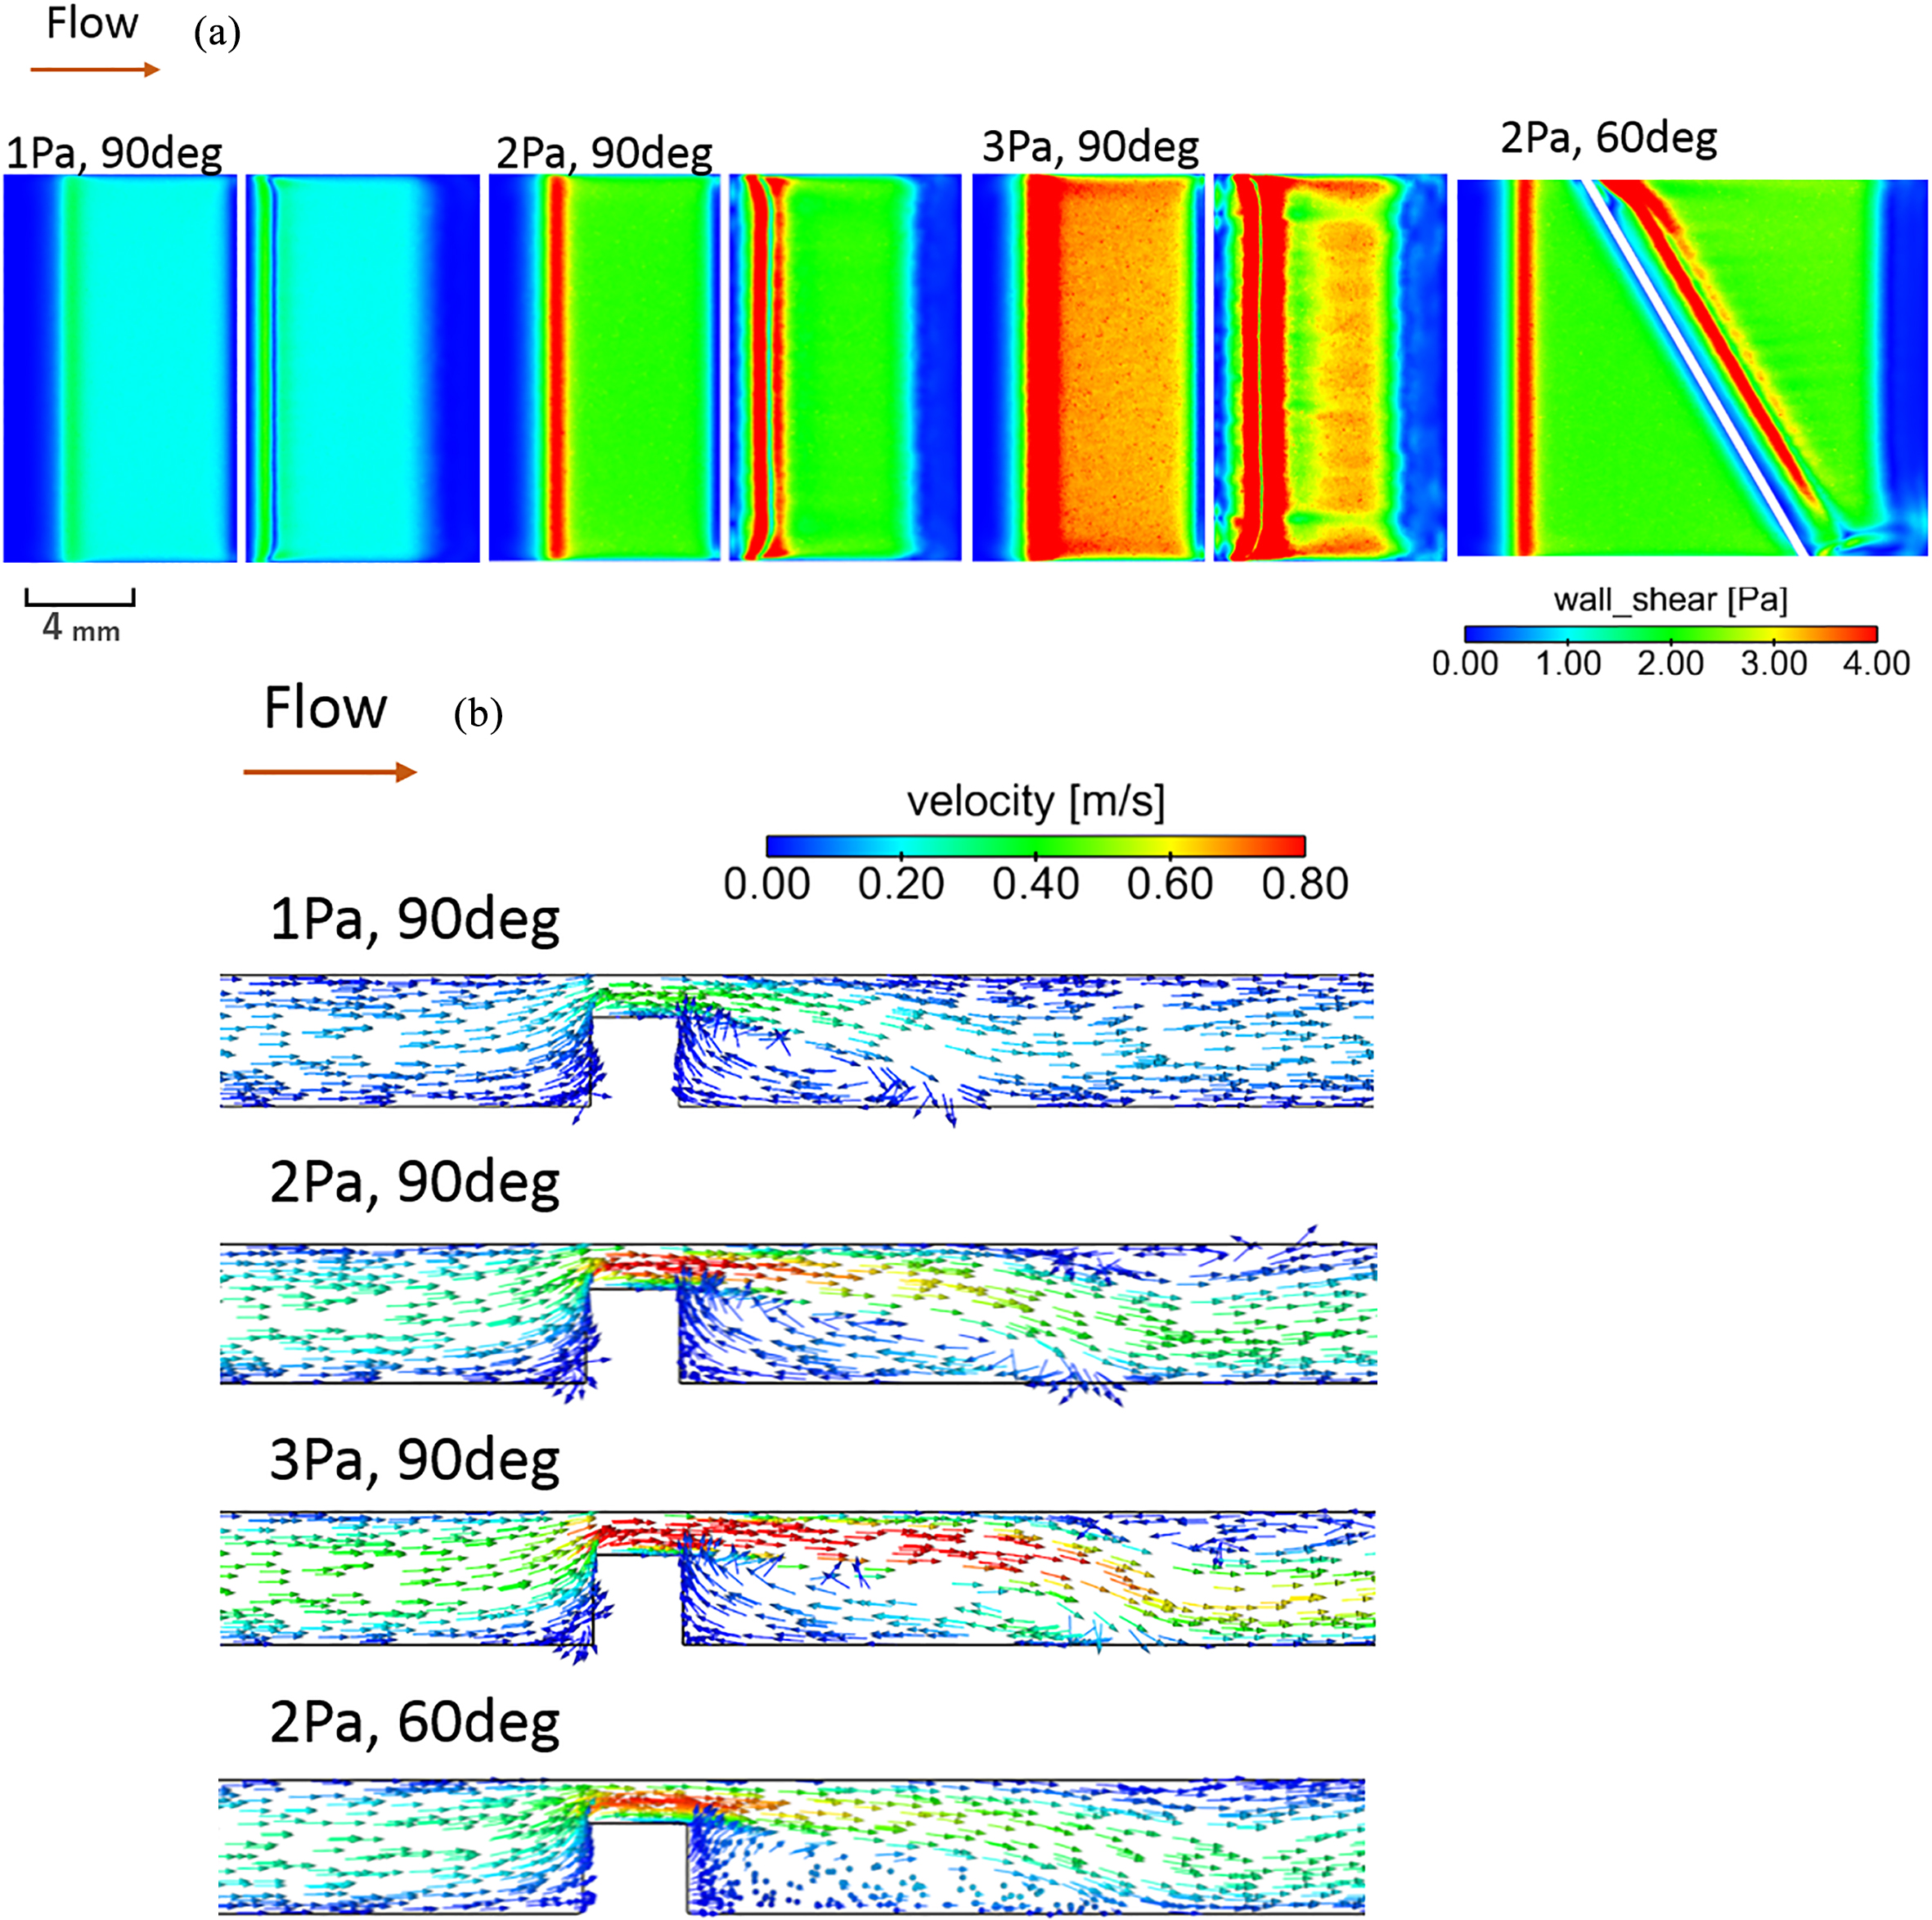
In order to accommodate flow separation on the downstream side of the wire, we observed separation or reattachment points, which indicated stagnation and contrasting areas of typical low and high SSs (Fig. 3b). Although the tendency of flow patterns was consistent in all 90
As in the 90
Prior to the 24 h flow exposure, we seeded ECs on 35 mm dishes and cultured cells until confluence over three days to confirm the influence of proliferation. Subsequently, we calculated cell numbers after six days of culture and confirmed no significant increases compared with those under static conditions for three days. We also determined 24 h EC proliferation with and without the wire and showed that although some ECs moved onto wire surfaces, the cell numbers in culture plates did not change significantly.
Cell distributions on the bottom plane of flow chamber. (a) Fluorescent images of EC layers after 24 h flow exposure (top) and the extracted images of EC nuclei (bottom). (b) ECs around the reattachment point, which is estimated from CFD results, under pressure conditions of 2 Pa. Middle and right images are enlarged view of white square A and B on left image.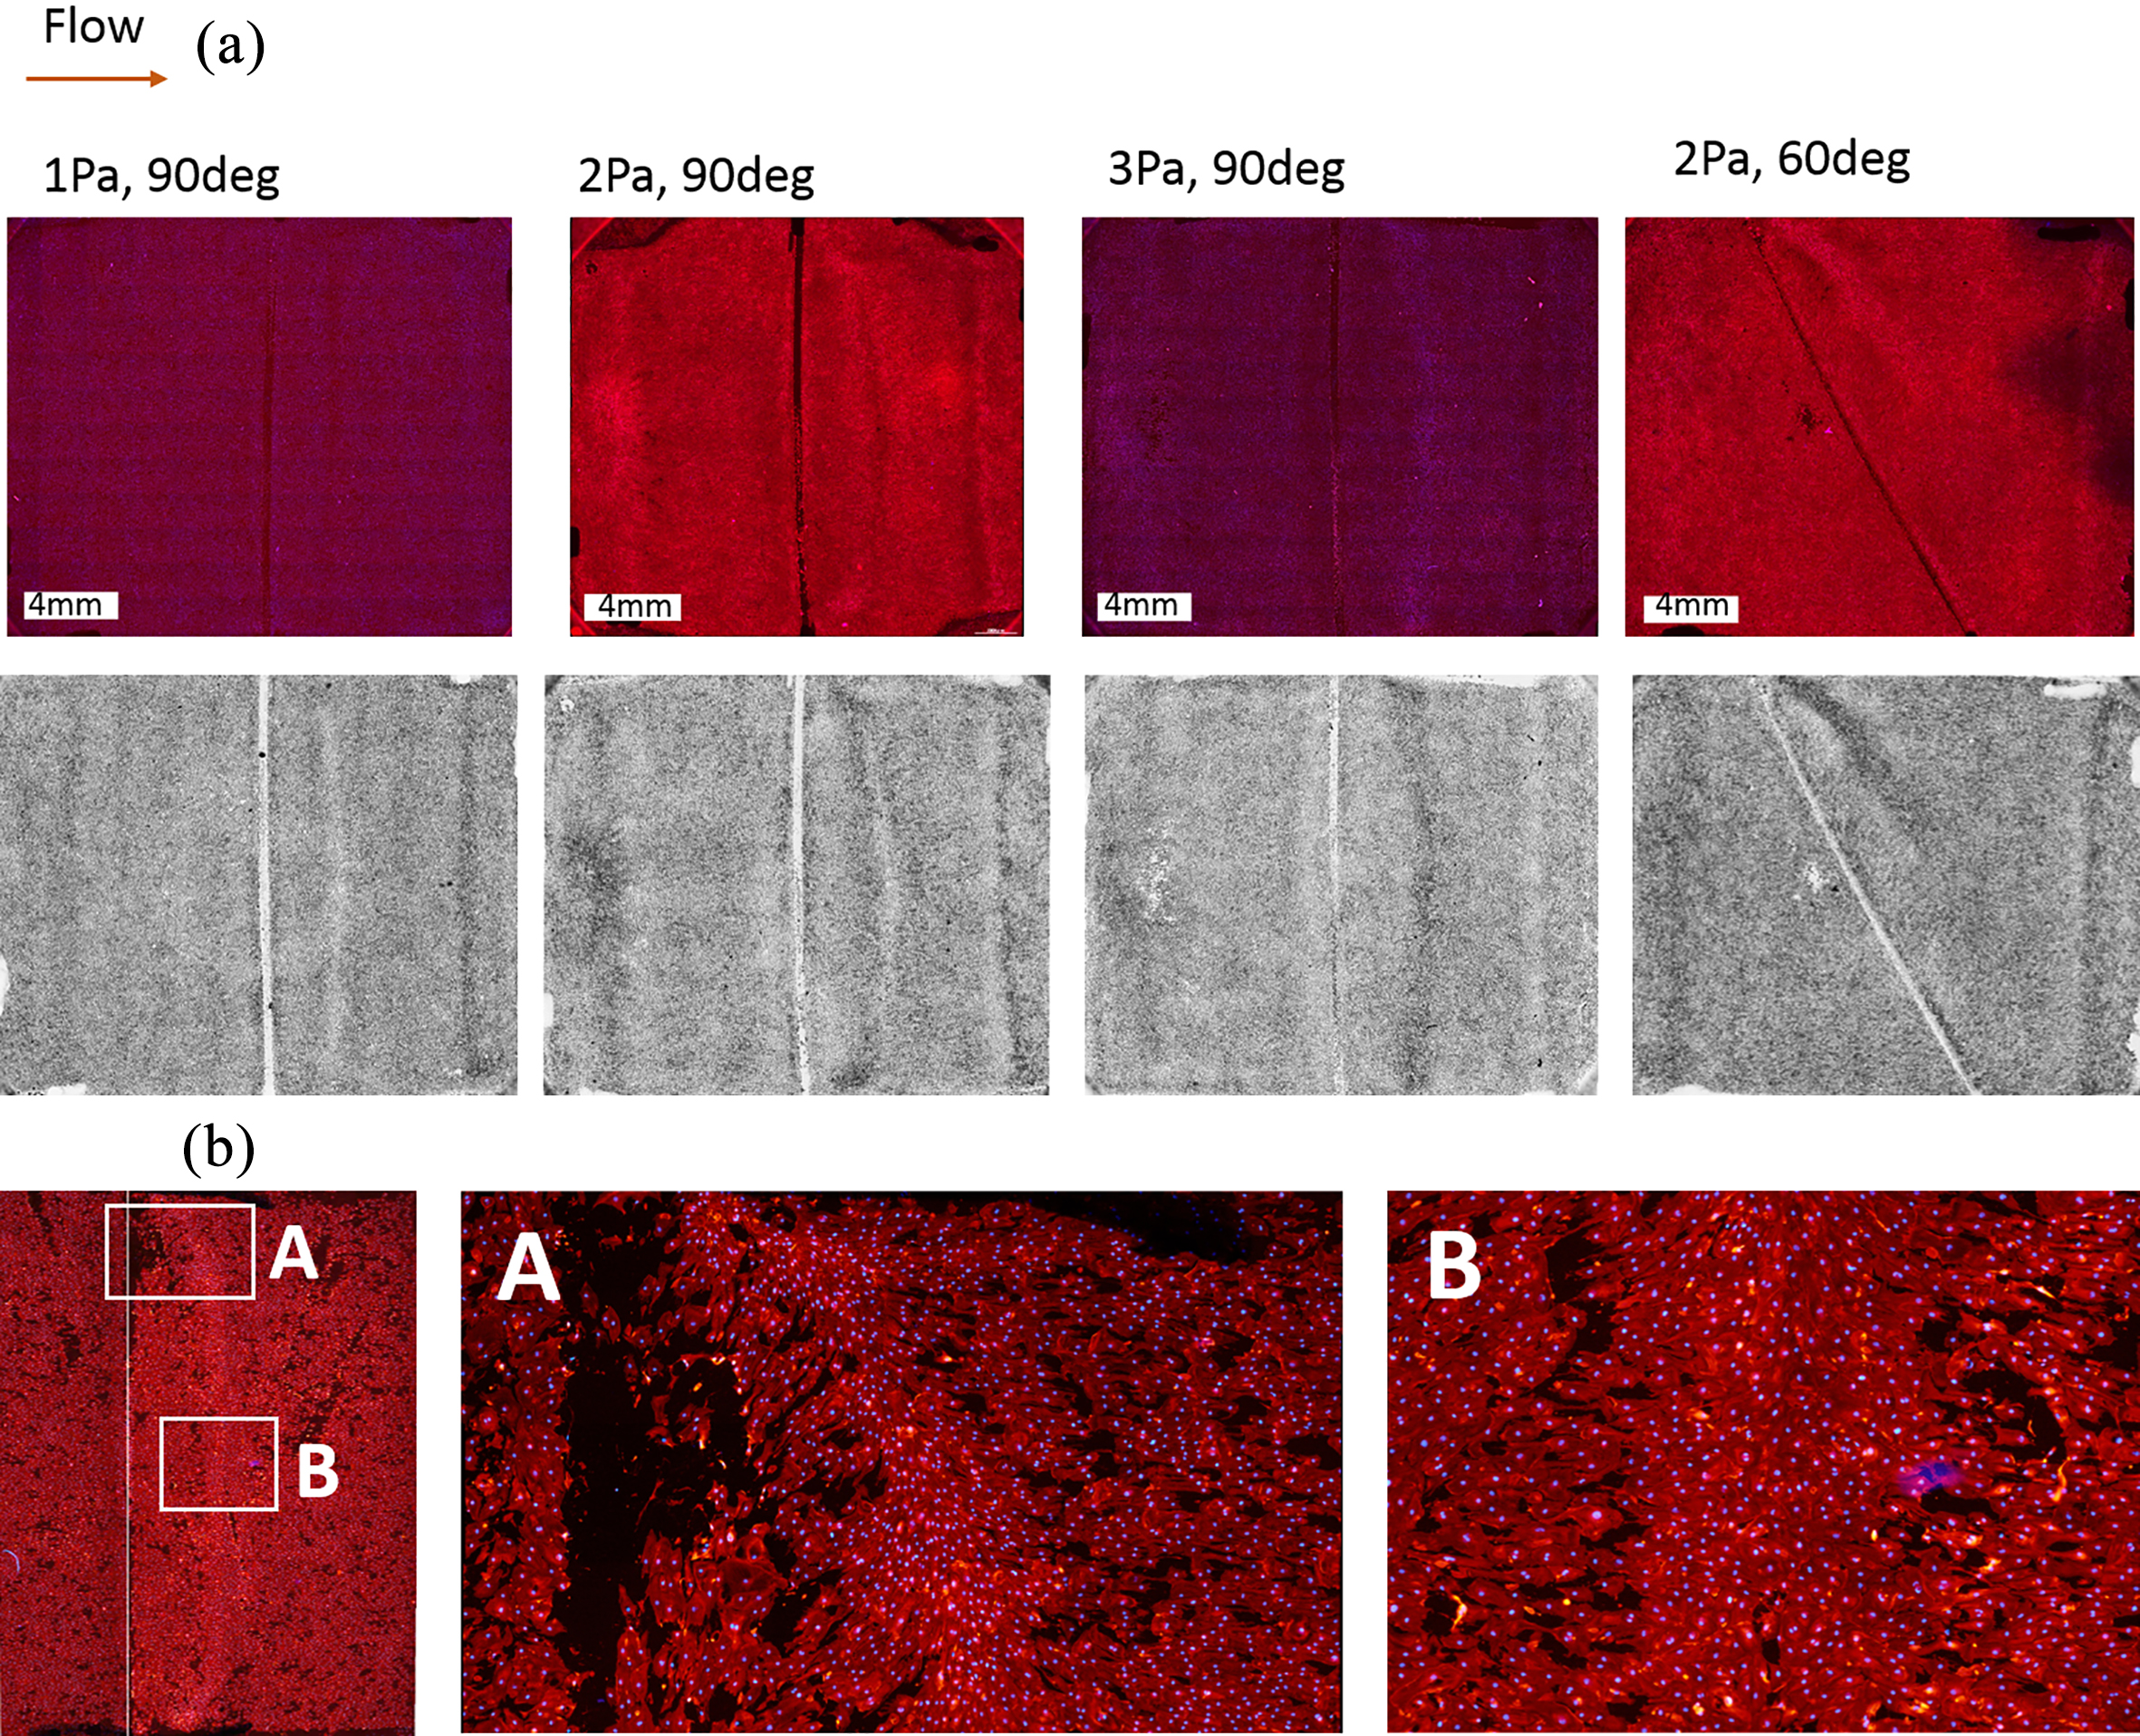
Cell densities on the bottom calculated from the number of EC nuclei.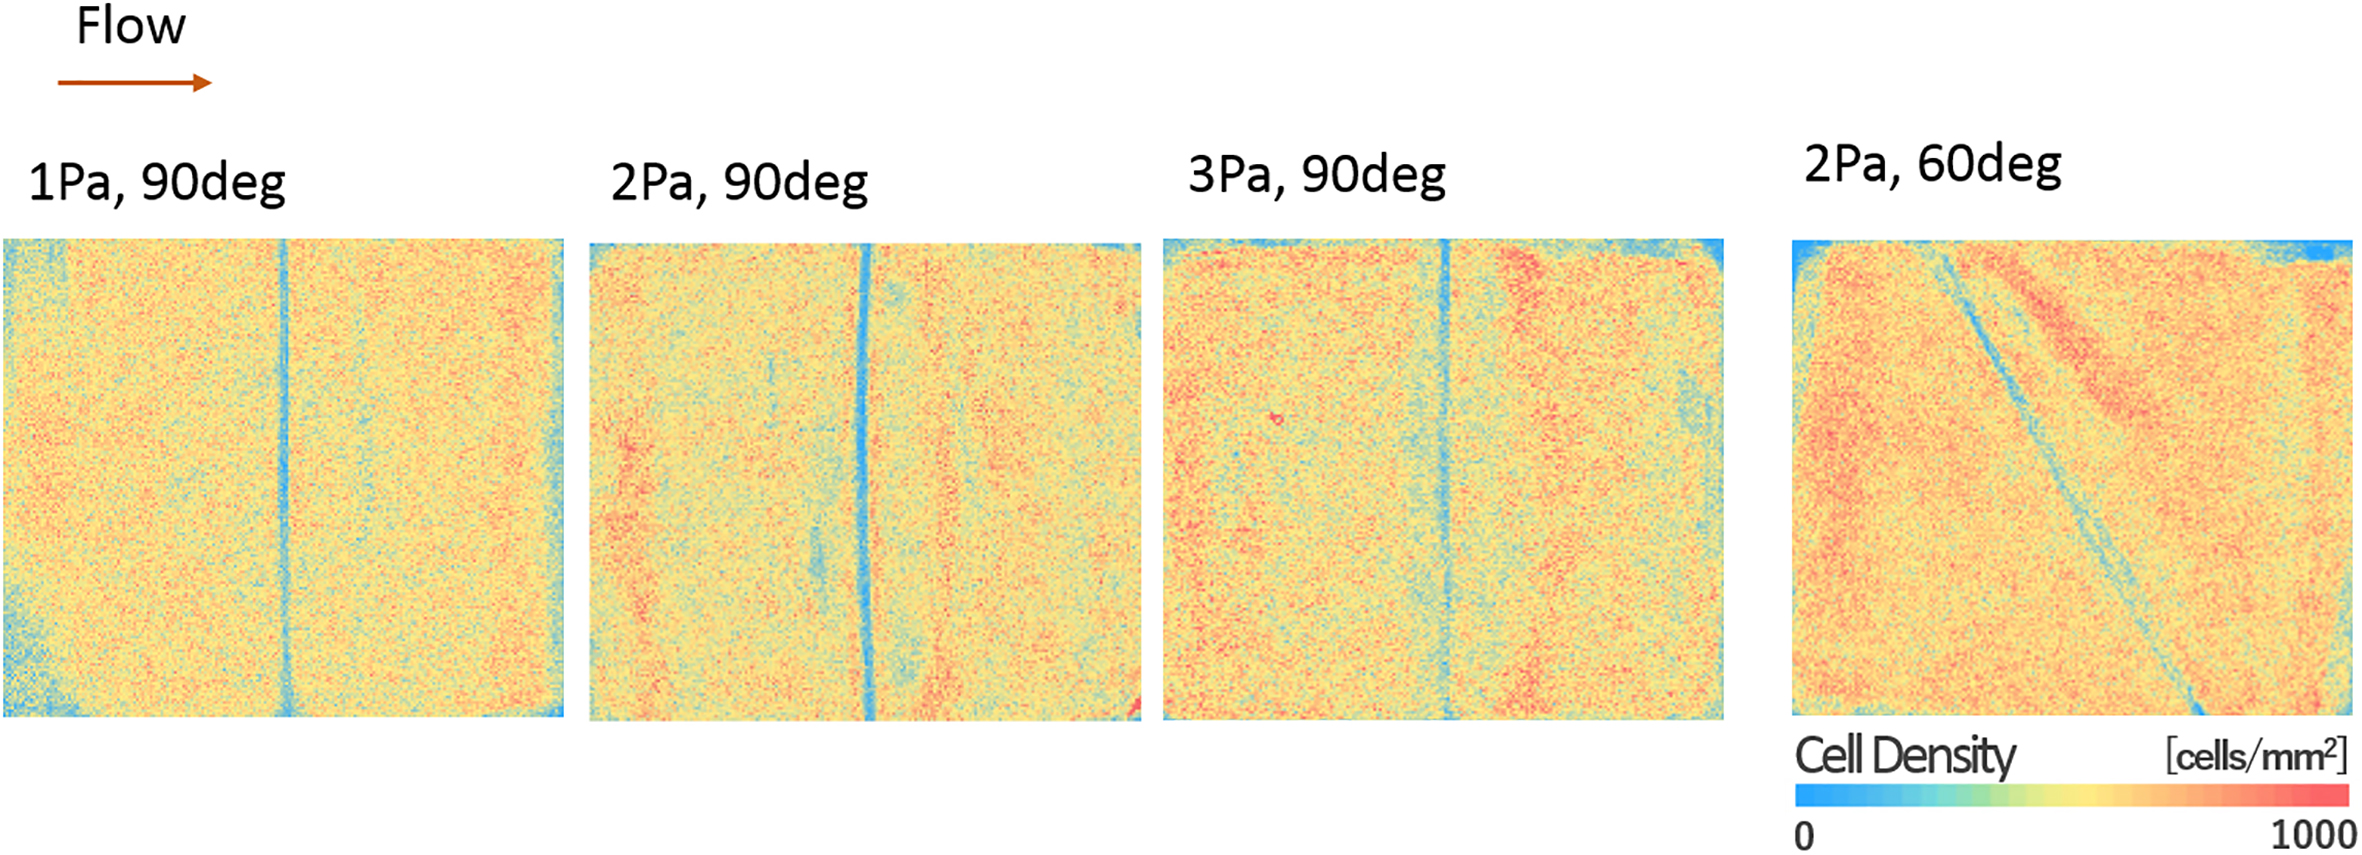
The fluorescent images in Fig. 4a (top) showed the extraction of cell nuclei (bottom) on the dish, and nuclei are represented as black dots in Fig. 4a (bottom), whereas the black area represents cell concentrations or cell enlargement. In Fig. 4b, the enlarged images show reattachment areas under 2 Pa conditions. In order to decipher the influence of EC sizes, the number of ECs was determined for small domains, and EC densities were calculated (Fig. 5).
Compared with SS distributions in CFD analyses, EC distributions showed similar tendencies in high-SS areas, and at the downstream area, typical concentrations of ECs were observed parallel to the wire in both 90
Cell densities on wire surfaces.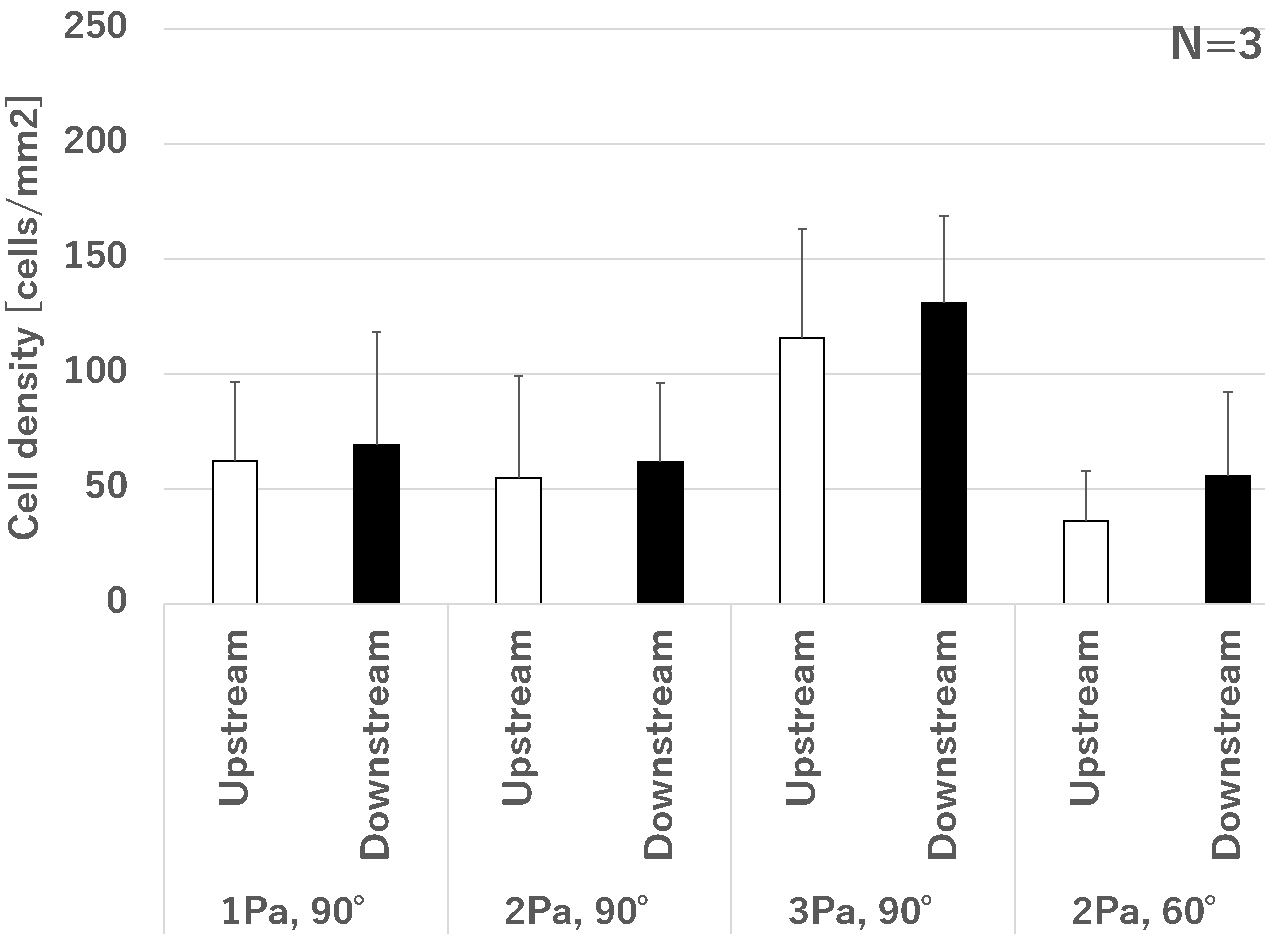
Fluorescent images of ECs on wire surfaces at 2 Pa in the 90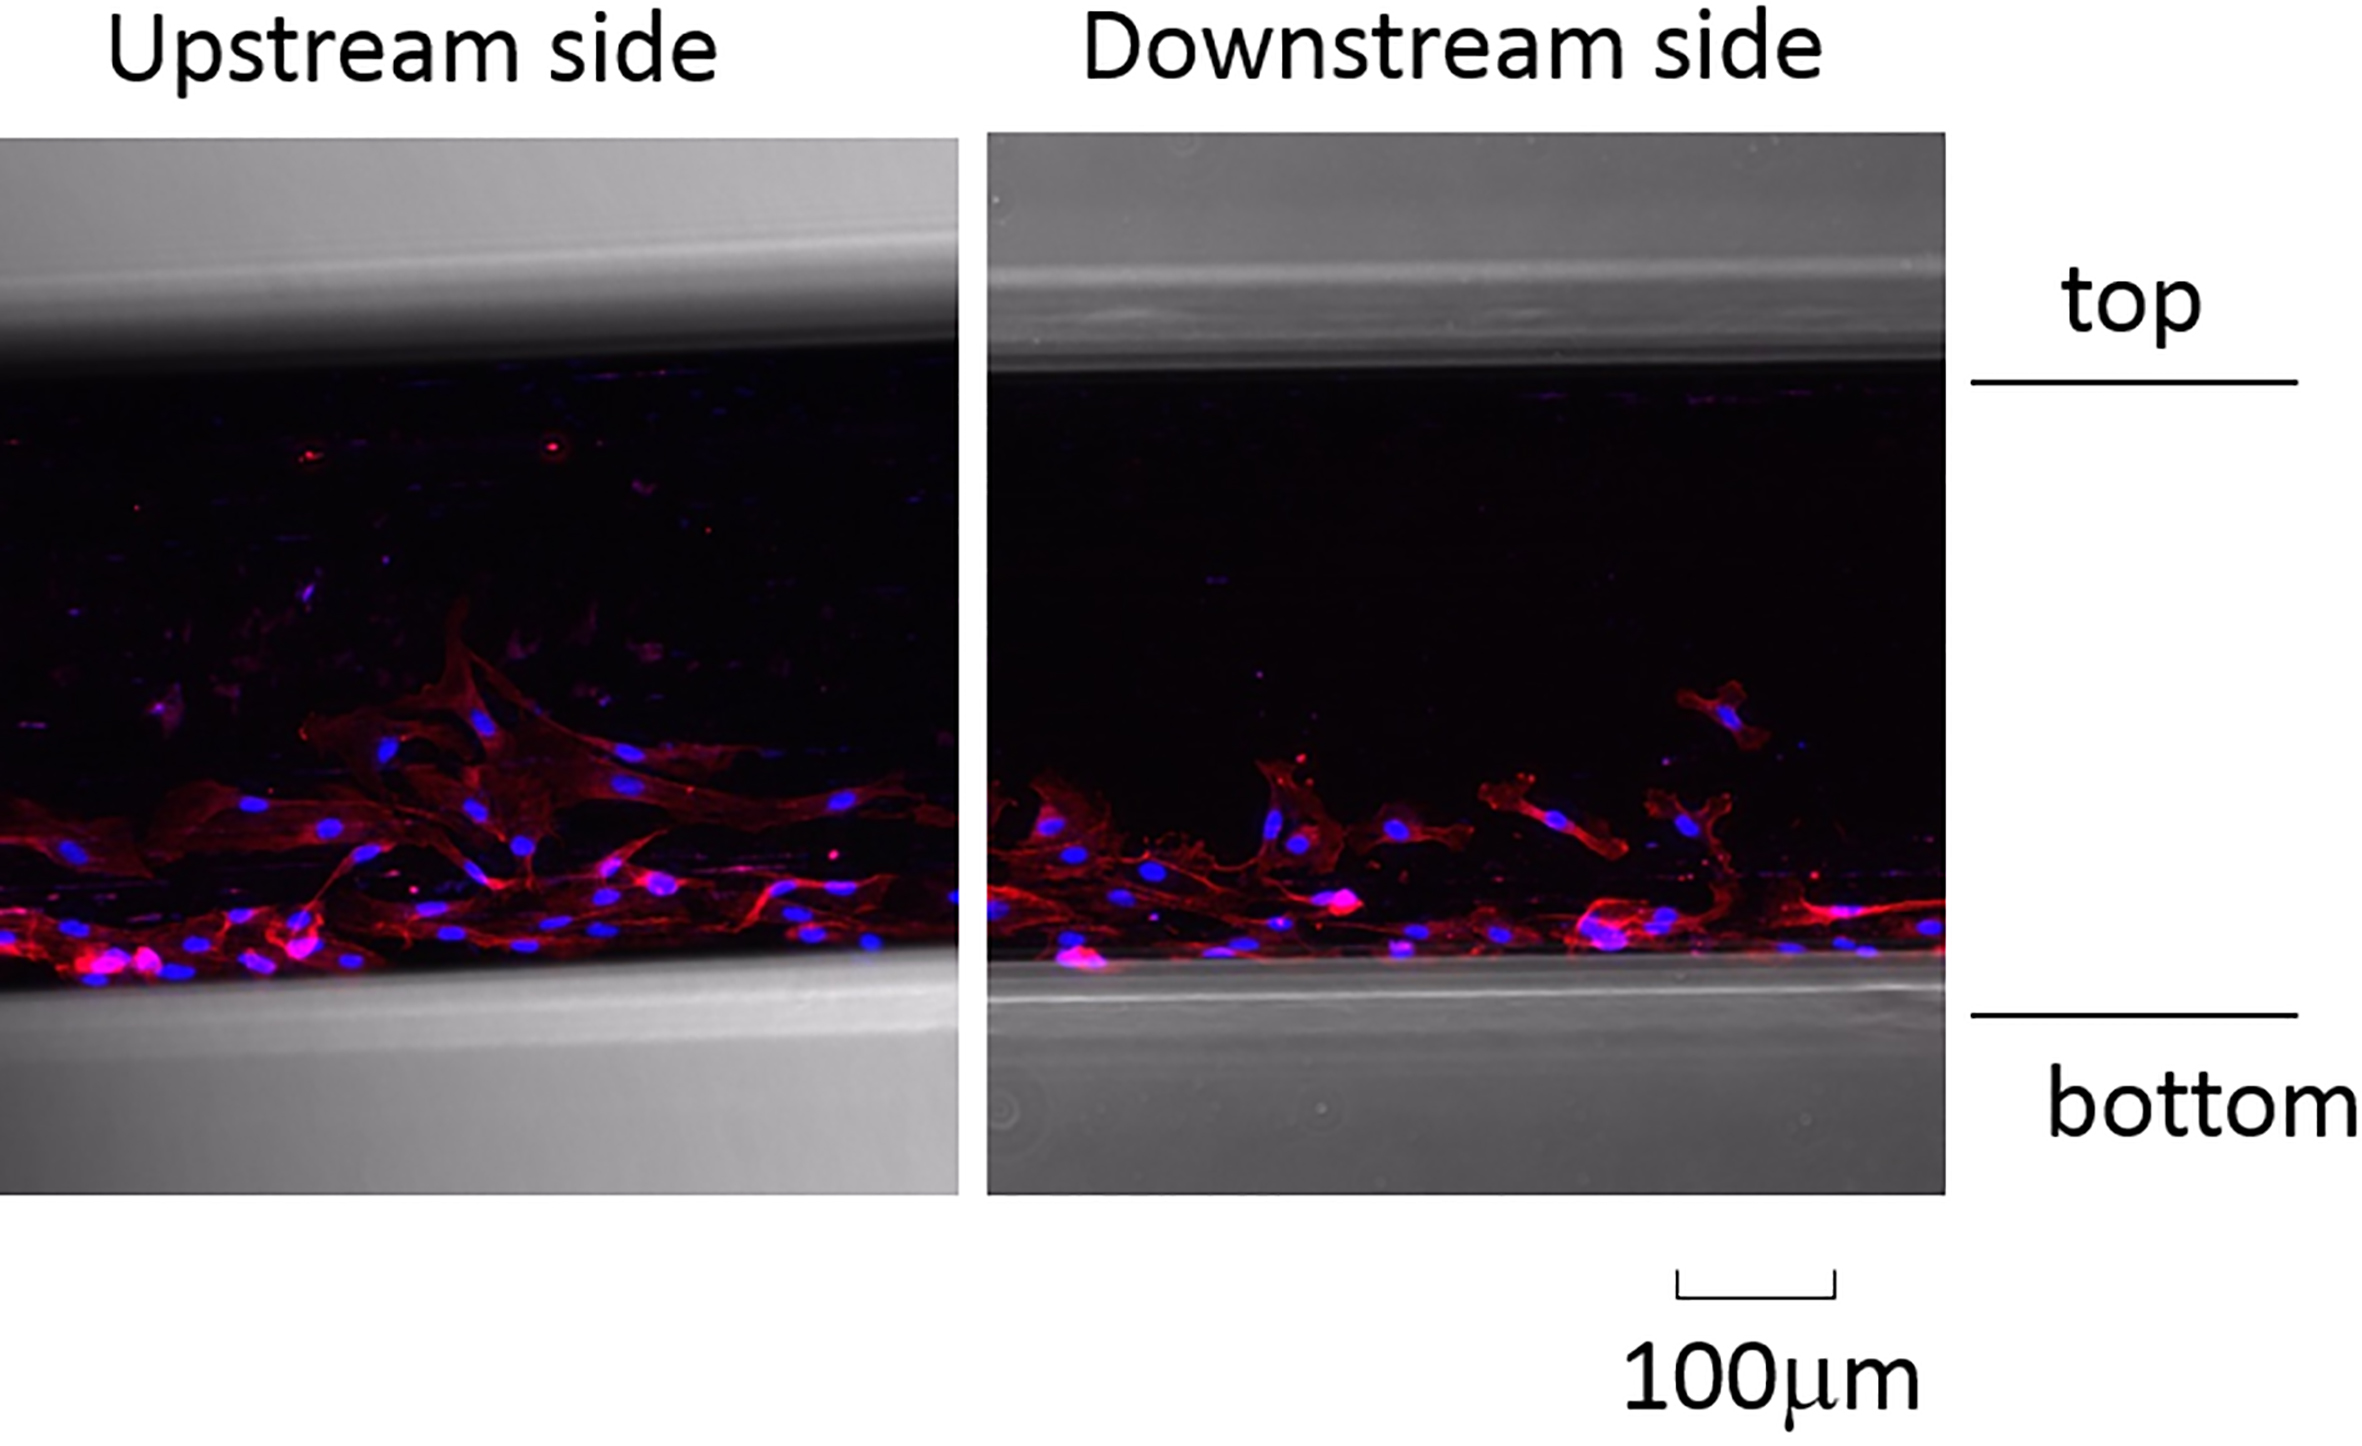
Comparisons of cell densities on the upstream and downstream surfaces of the wire (Fig. 6) showed no significant differences (
Discussion
Previous in vitro studies investigated EC distribution under flow environment using several types of flow chamber. In these results, flow stimuli, especially WSS induced by viscous fluid, has been considered as one of the factors for cell migration, elongation, and orientation [12, 13, 14, 16, 22, 23]. Though our chamber system uses identical flow domain, CFD results (Fig. 3) indicates that even one wire can reconstruct inner flow environment by its deployment. And flow exposure results (Fig. 4) clearly show the typical EC distribution on all cases: the concentration of EC downstream of the wire. As EC concentration downstream of wire matches the area of flow reattachment (which is indicated by high
In addition to the morphological changes of ECs, shear-induced signaling pathways have been defined for each stage of vascular dysfunction in the presence of various mediators [24, 25]. In particular, the expression levels of the matrix metalloproteinases MMP-2 and MMP-9, which degrade all extracellular matrix components, are enhanced by mechanical stimuli [26, 27]. However, our chamber system comprised a single layer of ECs and failed to elucidate EC-SMC interactions, for which several studies show EC-SMC and SMC-EC signaling pathways [28]. Thus, further studies are required to investigate the interactions between ECs and SMCs using coculture models [14].
Sprague et al. previously showed that cell migration onto stent wires decreases from downstream to the upstream of the direction of flow [29]. Hence, SS environments may affect the speed of endothelialization on implanted wires. Although ECs migrated to wire walls in the present study, no significant differences were observed between the upstream and downstream sides. Accordingly, CFD analyses showed small and large recirculation on the upstream and downstream sides, respectively. Moreover, most upstream walls were exposed to the high SS of the main flow, whereas a small area near the bottom received a downward force during recirculation. In contrast, the downstream wall received an upper force during recirculation in all areas. Because of the time limitations of these experiments, the EC coverage on the wire remained limited to small areas near the bottom, but this indicated that surface treatments of wires may facilitate endothelialization under clinical conditions [30]. Moreover, further studies with longer exposure times may show enhanced effects of SS on EC migration.
Separation of flow on wire surfaces causes reattachment of flow downstream of the wire. Due to the fact that flow stagnates at the reattachment point, SS values vary widely around this point, and we accordingly observed higher cell densities around high-SSG areas (Fig. 5). Moreover, due to the fact that the influence of proliferation is likely small over 24 h, changes in cell environments are likely driven by migration. Thus, ECs were concentrated because of cell migration from around the reattachment area, whereas ECs near the wire migrated from the dish to the wire surfaces, suggesting that migration directions vary depending on the chamber geometry and flow conditions.
Local SS environments can be controlled by wire shapes [17, 18, 20], and flow environments have been successfully engineered previously. Moreover, in studies of medical engineering applications, stents were topologically optimized to minimize flow inside aneurysms [31, 32, 33, 34]. Hence, minimizing the recirculation around stenosis wires will likely yield benefits, because extremely low SSs are thought to promote ECs dysfunction [7, 9, 10, 11]. Moreover, due to the fact that stent expansion leads to the deformation of the vessel lumen, Putra et al. applied simulations of fluid-structure interactions to optimize stent topologies and minimize low-SS areas on vessel surfaces [35]. In addition, previous in vivo and in vitro experiments suggested that low-SS environments induce cell degradation [7, 9, 10, 11], further suggesting that optimizing the implant geometry to minimize low-SS areas could prevent flow-induced inflammation after implant treatments.
The current computational approaches allow the simulation of complicated cell interactions and reproduction of tissue morphology [36]. Such approaches may facilitate the development of stents that can achieve rapid endothelialization, warranting the use of EC simulations to model SS-driven EC migration and optimization of devices based on computer simulations of cell activities.
Conclusion
In this study, we showed that EC distributions vary under differing SS conditions (1–3 Pa) using a flow chamber system and a wire obstacle. Under these conditions, vortexes downstream of the wire produced large changes in SSs around areas of flow reattachment. Moreover, after 24 h flow exposure, typical concentrations of ECs were observed toward flow reattachment areas. Due to the fact that extremely low SSs can induce inflammatory responses in ECs, areas of low SS may facilitate the topological optimization of endovascular implants.
Footnotes
Acknowledgments
This research was supported by the Fund for the Promotion of Joint International Research (15KK0197) and a Grant-in-Aid for Scientific Research (A) (16H01805). N.K.P would like to acknowledge LPDP of The Ministry of Finance, Republic of Indonesia for its doctorate scholarship program.
Conflict of interest
The authors have no conflict of interest to report.