
Abstract
BACKGROUND:
Walking is a basic human activity and many orthopedic diseases can manifest with gait abnormalities. However, the muscle activation intervals of lower limbs are not clear.
OBJECTIVE:
The aim of this study was to explore the contraction patterns of lower limb muscles by analyzing activation intervals using surface electromyography (SEMG) during walking.
METHODS:
Four muscles including the tibialis anterior (TA), lateral gastrocnemius (LG), medial gastrocnemius (MG), and rectus femoris (RF) of bilateral lower extremity of 92 healthy subjects were selected for SEMG measurements. The number of activations (activation intervals) and the point of the highest root mean square (RMS) EMG signal in the percentage of the gait cycle (GC) were used to analyze muscle activities.
RESULTS:
The majority of TA and RF showed two activation intervals and both gastrocnemius parts three activation intervals during walking. The point of the highest RMS EMG signal in the percentage of the GC for TA, LG, MG and RF are 5%, 41%, 40%, and 8%, respectively. The activation intervals were mostly affected by age, height, different genders and bilateral limbs.
CONCLUSION:
This study identified the different activation intervals (four for each muscle) and the proportion of healthy adults in which they occurred during the normal gait cycle. These different activation intervals provided a new insight to evaluate the function of nerves and muscles. In addition, the activation interval and RMS peak time proposed in this study can be used as new parameters for gait analysis.
Introduction
Walking is a basic human activity and many orthopedic diseases can manifest with gait abnormalities [1]. During walking, the muscles around the ankle play an important role. Ankle plantar flexors act to restrain the forward rotation of the tibia on the talus during the stance phase, provide ankle stability, contribute to knee stability, and conserve energy by minimizing vertical oscillation of the whole-body center of mass [2]. The main role of the ankle dorsiflexors during walking is to prevent the foot from slapping on the ground during the initial stance, to permit the forefoot to clear the ground during the initial swing, and to hold the ankle in position during initial contact [3]. Therefore, the dynamic characteristics of muscles may better reflect the degree of disease and rehabilitation [4].
In most studies, it is considered useful to have a profile of normal surface electromyography (SEMG) activity that can be used as a reference. Clinical investigators need these references to diagnose individual patients, and basic researchers interested in motor patterns use it to discuss the roles of various muscles during the gait cycle [5]. The normal distribution and motor patterns of the lower limb muscles have already been described [3]. However, those patterns are not sufficient enough to explain complicated muscle activities, and variations in SEMG signals have been found between people and even among different strides in the same person [5]. There are various attempts to identify the SEMG patterns in healthy people, and the results have shown that a variation of myoelectric interval exists in children of different ages [6], across genders [6, 7, 8, 9], and across different strides in the same person [10]. However, few studies have focused on the variation of activation intervals in healthy adults with statistical gait analysis method and the variation of activation intervals may be an important factor that affects the walking ability [11].
Therefore, the aim of this study was to use SGA to quantitatively assess the natural variability of activation intervals in healthy adults through measuring four important gait-related muscles: tibialis anterior (TA), lateral gastrocnemius (GL), medial gastrocnemius (MG), and rectus femoris (RF).
Methods
Participants
Ninety-two healthy adults between the ages of 20–87 (average
The characteristics of the healthy subjects
The characteristics of the healthy subjects
The information is shown as average
SEMG was measured using a DELSYS wireless dynamic EMG tester (Trigno™ Wireless Systems, Delsys Inc., USA). The bilateral TA, LG, MG, and RF were collected and analyzed as they are widely used to evaluate lower limb functions [8, 12]. The participant’s skin was scraped, sanded, and cleaned prior to pasting electrodes (size: 37
The position of the electrodes.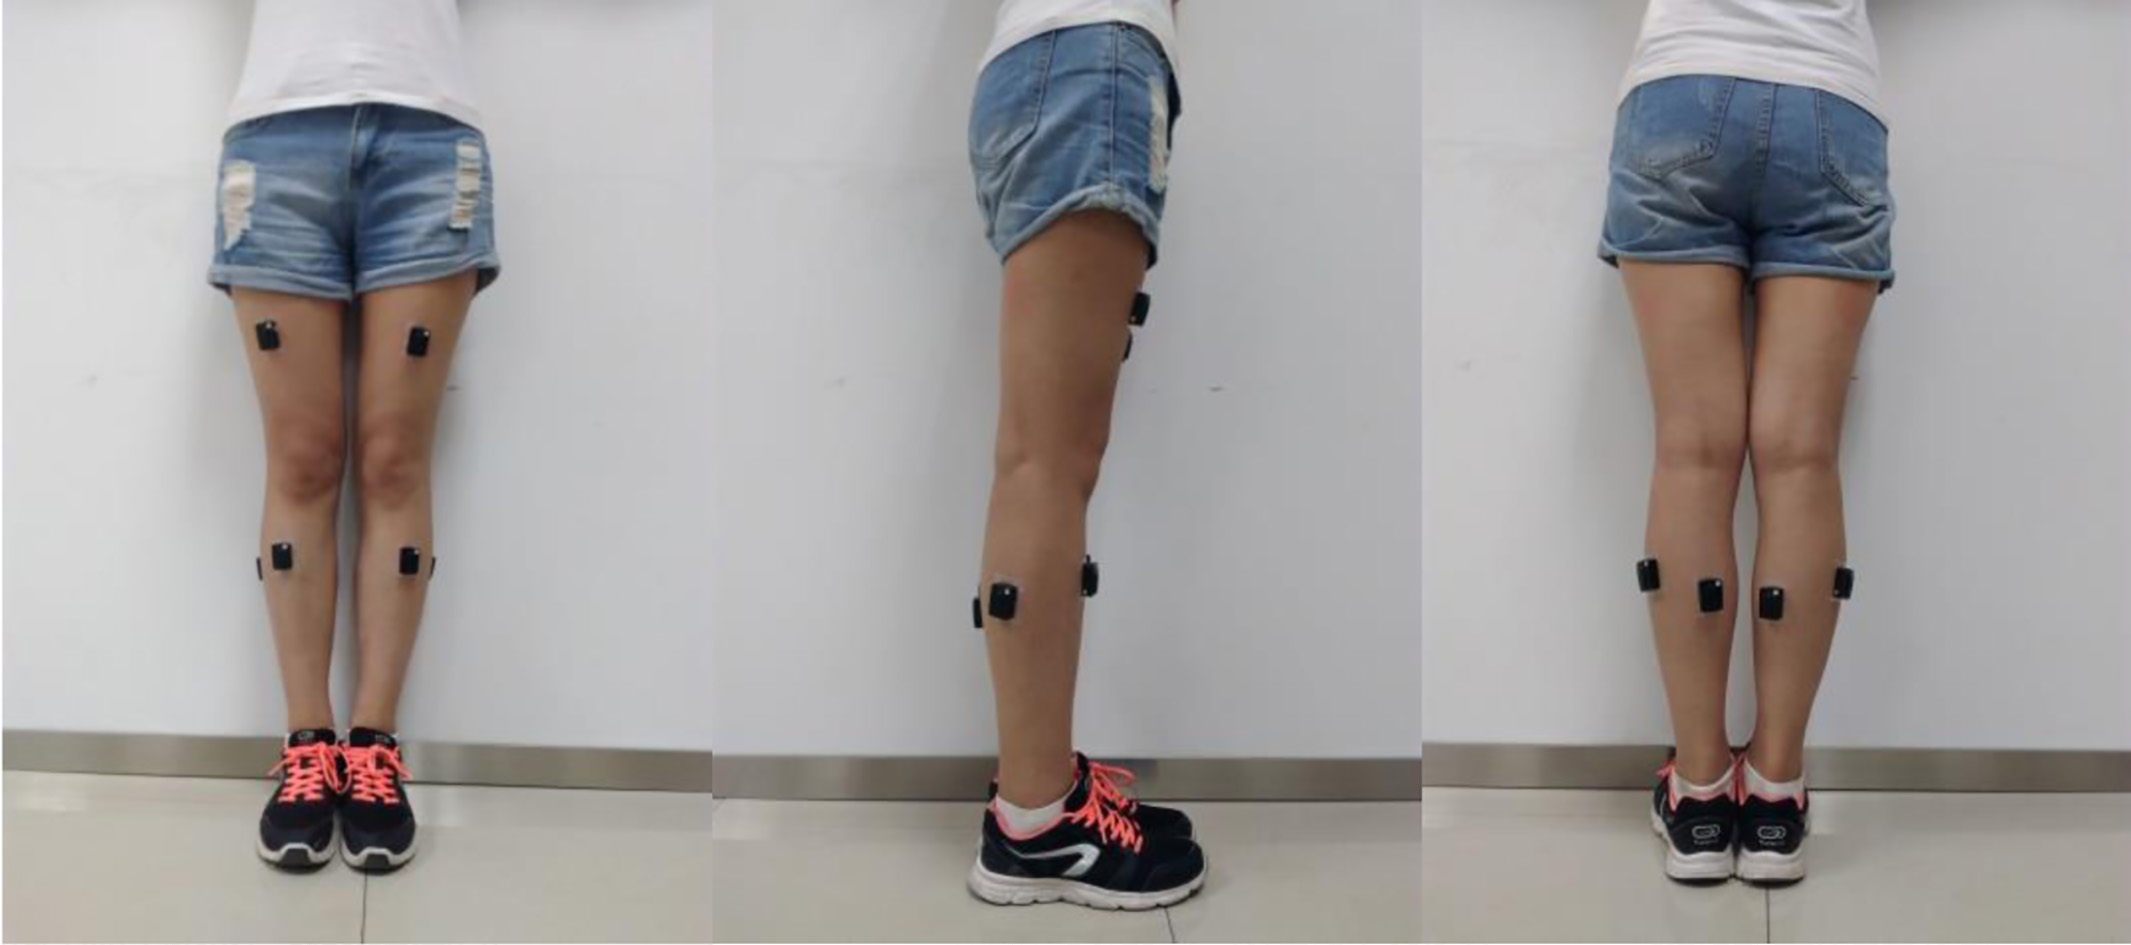
The EMG signals were processed and analyzed using EMGworks Analysis and MATLAB software. The sampling frequency was 1200 Hz. Four parameters were analyzed. Root mean square (RMS) and RMS peak time (the position of the dominant wave’s peak, recorded as a percentage of a gait cycle) were used to observe muscular activity [15, 16]. We combined EMG data from 20 gait cycles using the EMG analysis software. The EMG synchronization points were subjected to analysis using MATLAB software after eliminating noise. For the time parameter, the RMS value of the EMG signal in each gait cycle was calculated using a 30 ms window and a 20 ms step size [17, 18]. The time was normalized, and the average value of the 20 gait cycles was calculated [14]. The RMS was plotted to get the maximum RMS value and the peak time. Next, the intervals were analyzed. Intervals are defined as the number of times a muscle is activated and is expressed as the waves present during a single gait cycle [10]. Each interval refers to a different interval pattern, characterized by a specific number of intervals over a gait cycle, i.e. n-interval modality consists of n interval waves for a particular muscle during a single gait cycle [10]. Perry’s [3] theory of the gait cycle was used to classify the RMS peak time into one of eight phases: initial contact (0%–2%), loading response (2%–12%), mid stance (12%–31%), terminal stance (31%–50%), pre-swing (50%–62%), initial swing (62%–75%), mid swing (75%–87%) and terminal swing (87%–100%).
Statistics
Data are reported as mean
The distribution of RMS value and peak time with each interval modality in all muscles
The distribution of RMS value and peak time with each interval modality in all muscles
The values of 736 muscles from 92 healthy volunteers were used for analysis. Four activation intervals were found, including one, two, three, and four muscle activation intervals. The analysis of the myoelectric signals suggested that muscles show a different number of activation intervals in different subjects and even in different limbs from the same individual.
The p value and correlation between interval modality and gender, bilateral limbs, age, weight, height and BMI. The results show that there was a significant difference between bilateral limbs in LG. The age and height show some correlation to the variation of interval modality
The p value and correlation between interval modality and gender, bilateral limbs, age, weight, height and BMI. The results show that there was a significant difference between bilateral limbs in LG. The age and height show some correlation to the variation of interval modality
*The statistical significant relationship was set at
The RMS of TA shows four basic activation intervals: 1-intervals (panel a), 2-intervals (panel b), 3-intervals (panel c) and 4-intervals (panel d).
Four activation intervals were found in the TA (Fig. 2). The most common interval modality in the TA was a 2-interval modality (55.43% of all participants) (Fig. 3). The peak time of TA with 2-interval modality mainly occurred in the loading response phase (74.51% of all participants), and the second burst’s peak time mainly occurred in the initial swing phase (83.33% of all participants). The other modalities are described in Table 2. Of all activation intervals, the RMS peak time mainly occurred in the loading response phase (70.65% of participants) (Fig. 4). The interval modality was not significantly different between genders (
For the LG, there were also four activation intervals (Fig. 5). The most common interval modality was the 3-interval modality (34.78% of participants) (Fig. 3). The peak time of LG with 3-interval modality mainly occurred in the terminal stance phase (51.56% of participants), the second peak time mainly occurred in the loading response phase (37.5% of participants), and the third peak time occurred in the initial swing phase (43.75% of all participants). The other modalities are described in Table 2. Of all activation intervals, the RMS peak time focused on the terminal stance phase (68.48% of participants) (Fig. 4). The interval modality of the LG was not significantly different in terms of gender (
The mean and median value of the peak time and interval models of each muscle in healthy subjects
SEMG, surface electromyography; TA, tibialis anterior; LG, lateral gastrocnemius; RMS, root mean square; MPF, mean power frequency; MF, median frequency; SD, standard deviation; IQR, inter-quartile range.
55.43% of all participants’ interval modalities in the TA were 2-interval modalities (a); 34.78% of all participants’ interval modalities in the LG were 3-interval modalities (b); 31.52% of all participants’ interval modalities in the MG were 3-interval modalities (c); 30.98% of all participants’ interval modalities in the RF were 3-interval modalities (d).
70.65% of all participants’ RMS peak time in the TA mainly occurred in the loading response phase (a); 68.48% of all participants’ RMS peak time in the LG mainly occurred in the terminal stance phase (b); 77.71% of all participants’ RMS peak time in the MG mainly occurred in the terminal stance phase (c); 61.96% of all participants’ RMS peak time in the RF mainly occurred in the loading response phase (d).
The RMS of LG shows four basic activation intervals: 1-intervals (panel a), 2-intervals (panel b), 3-intervals (panel c) and 4-intervals (panel d).
Concerning the MG, there were also four activation intervals (Fig. 6). The most common interval modality was also the 3-interval modality (31.52% of participants) (Fig. 3). The peak time of MG with 3-interval modality mainly occurred in the terminal stance phase (74.14% of participants), the second peak time occurred in the loading response phase (31.03% of all participants), and the third peak time occurred in the mid swing phase (39.66% of all participants). The other modalities are described in Table 2. Of all the activation intervals, the RMS peak time mainly focused on the terminal stance phase (77.71% of participants) (Fig. 4). The results also showed that the interval modality was not significantly different between genders (
The RMS of MG shows four basic intervals: 1-intervals (panel a), 2-intervals (panel b), 3-intervals (panel c) and 4-intervals (panel d).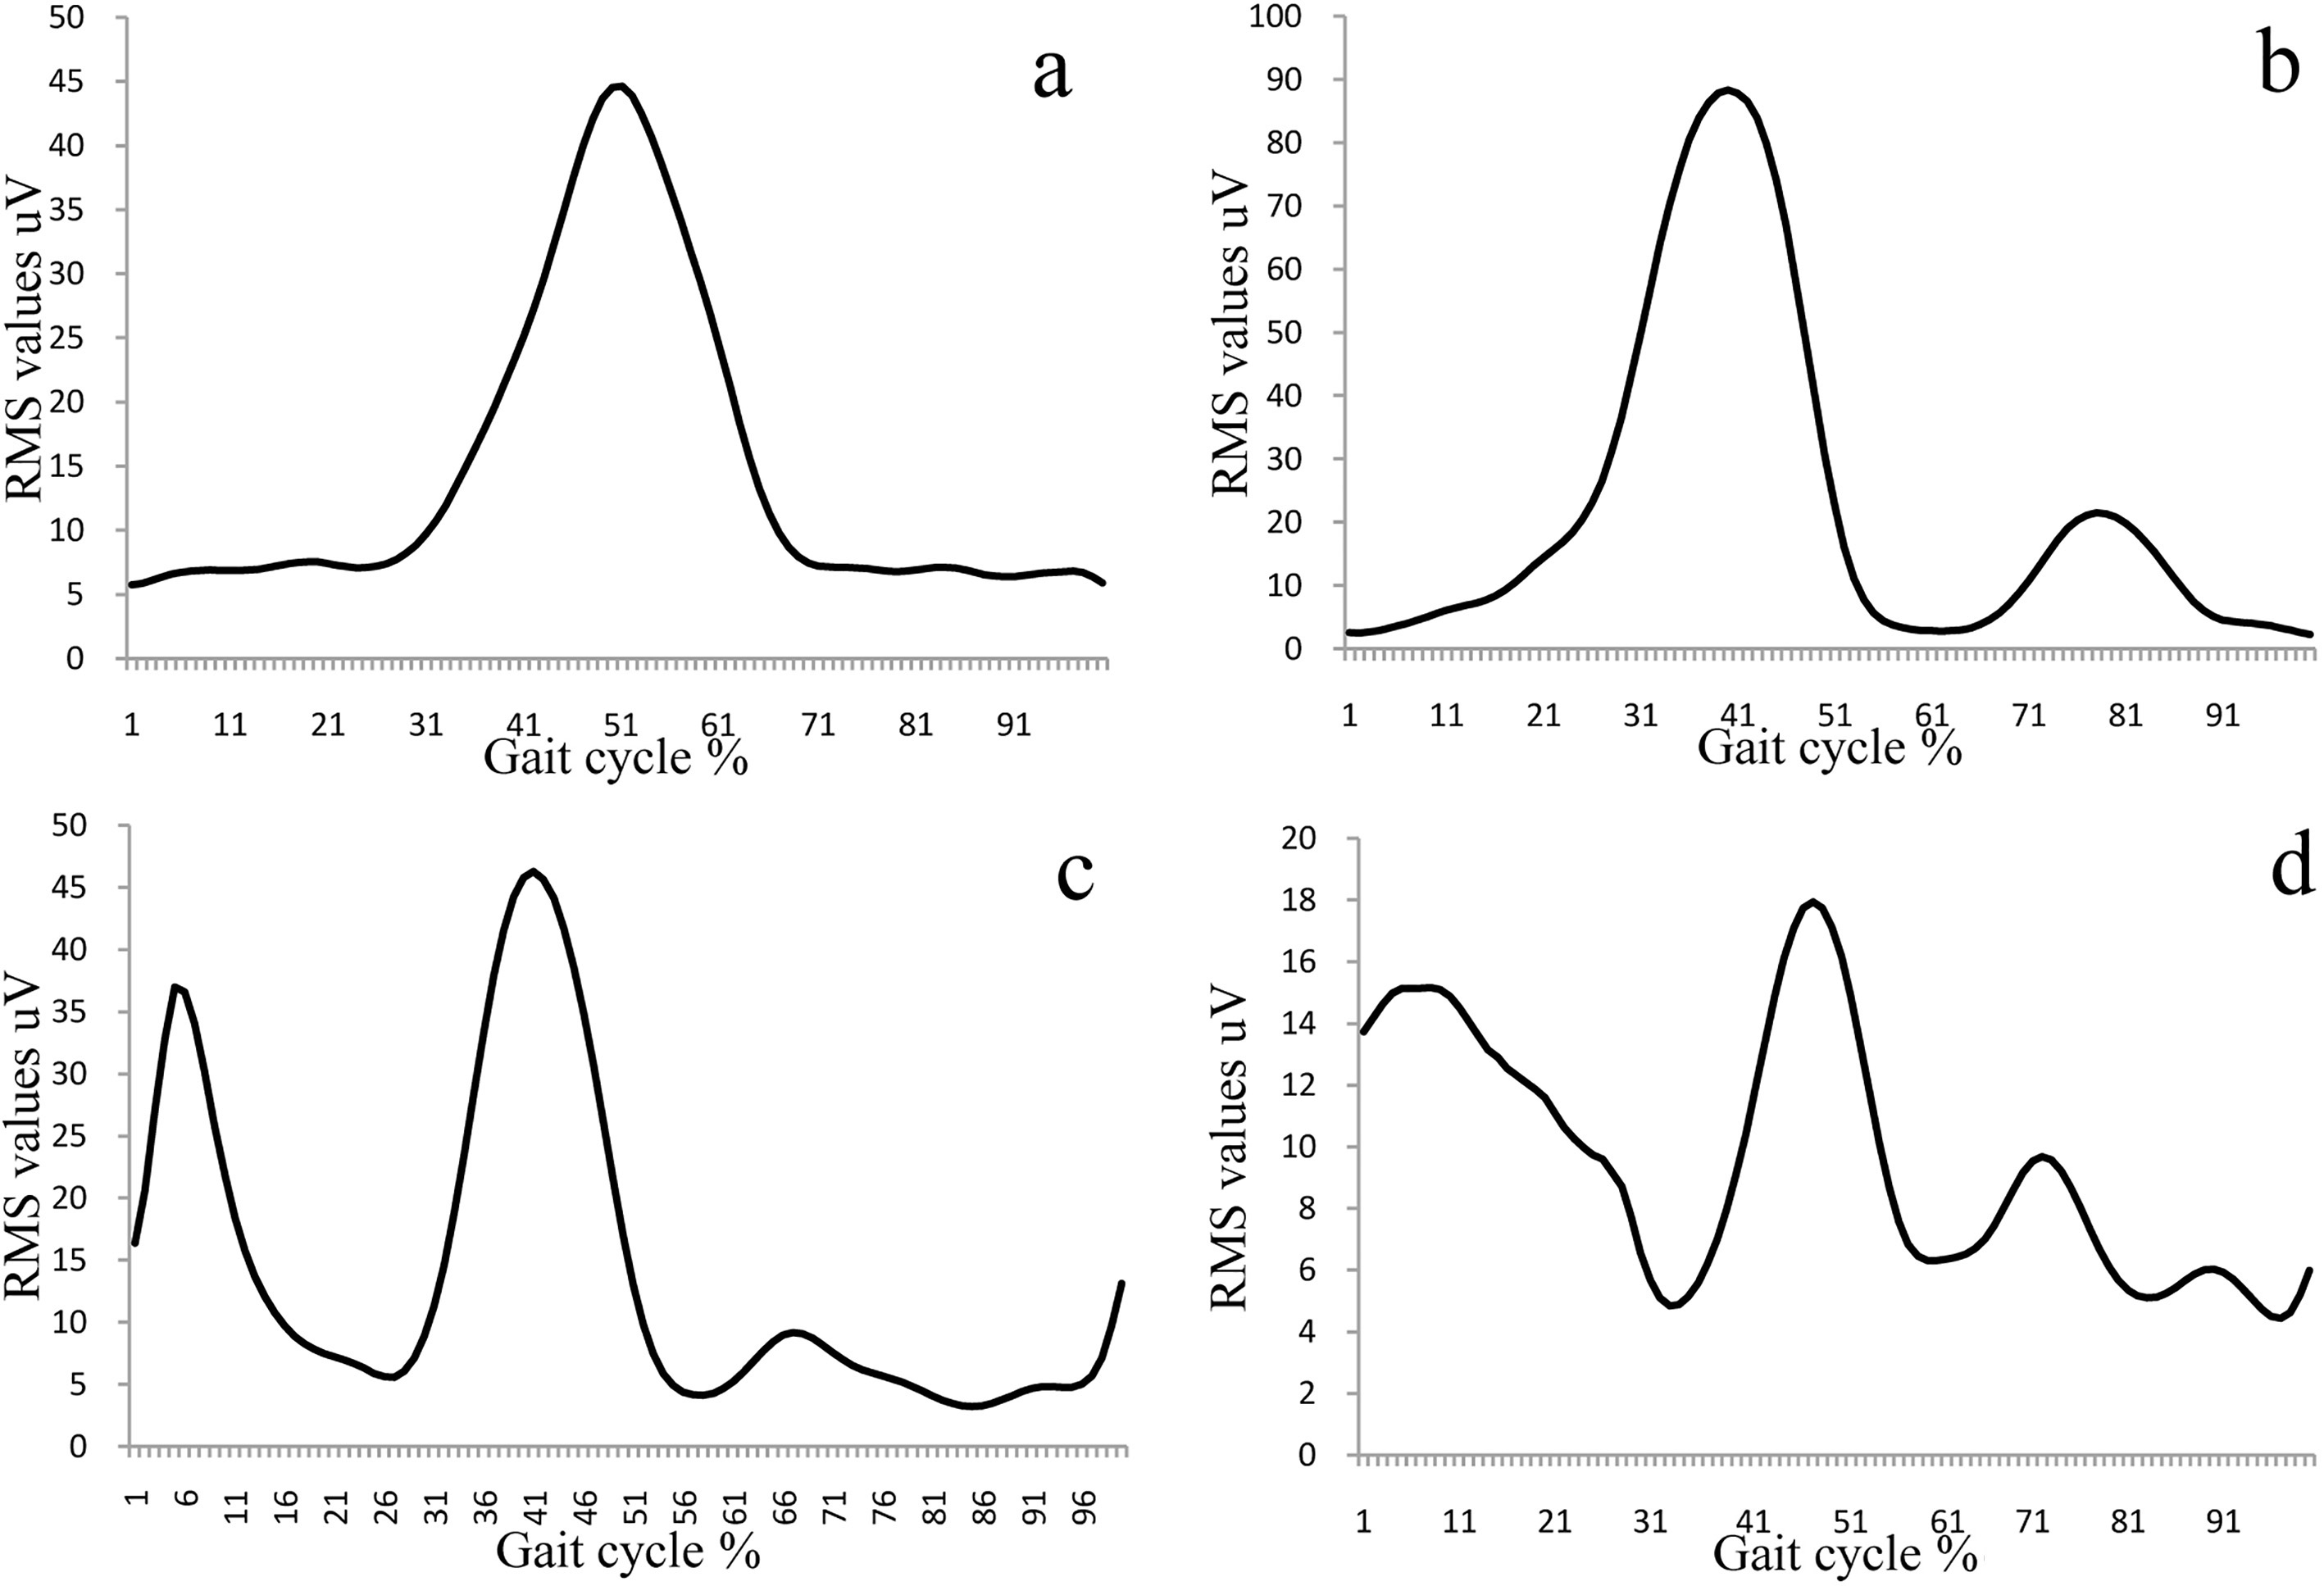
Concerning the RF, there were also four activation intervals (Fig. 7). The most common interval modality was the 2-interval modality (30.98% of participants) (Fig. 3). The peak time of RF with 2-interval modality mainly occurred in the loading response phase (66.67% of participants), and the second peak time occurred in the initial swing phase (57.89% of all participants). The other modalities are described in Table 2. Of all activation intervals, the RMS peak time mainly focused on the terminal stance phase (61.96% of participants) (Fig. 4). The interval modality was not significantly different between genders (
The RMS of RF shows four basic interval intervals: 1-intervals (panel a), 2-intervals (panel b), 3-intervals (panel c) and 4-intervals (panel d).
The present study was designed to analyze the activation intervals of lower-limb muscles during walking at a self-selected speed. The results were provided to gain a novel insight into the muscle function during GC.
In a gait cycle, four muscle activation intervals were found in different muscles from healthy subjects (Fig. 2, Figs 5–7). However, the dominant activation modality and the RMS peak times varied per muscle (Figs 3 and 4). The different activation intervals and the difference in RMS peak time in healthy adults may be attributable to segmental motor overlaps and anatomical variations. In the lower extremity, most muscles have 2 or 3 levels of nerve roots innervation. Therefore, a single muscle may express different activation intervals in different people. Of all the nerves that innervate the muscle, one nerve will be dominant [19, 20, 21, 22]. For example, the TA and the extensor hallucis longus are innervated by the L5 nerve root in 90% of the people, and the remaining 10% of people are innervated by the S1 nerve root [19]. Additionally, the nerve root’s variations are exited in a considerable percentage of healthy subjects [23]. The differences in dominant nerves may be a reason for the differences in RMS peak times.
The dominant intervals for the four different muscles also varied. The TA and RF had a 2-interval modality, whereas the LG and MG had a 3-interval modality. Additionally, the proportions of people exhibiting the dominant interval modality was different for the difference muscles (TA: 55.43%; LG: 34.78%; MG: 31.52%; LG: 30.98%). This finding supports the assumption of the overlap theory that multiple segmental roots innervate the same muscle together [24, 25]. The muscle activation pattern and RMS peak time may be decided by the neuromechanical function of the individual muscle [26]. The weight-bearing muscles (TA, RF) have their major peak in the first 15% of the stride for the purpose to bear weight when the walking is initiated. The plantar flexors (MG, LG) have peaks at push-off terminal stance phase (50% of the stride) so as to produce the pushing power and propel the body [3, 25]. The other interval waves may be caused by co-contraction of the antagonist muscle, and the co-contraction between agonist muscle and antagonist muscle would stabilize the joint movement.
The amplitude parameters to quantitatively evaluate SEMG signal (peak amplitude, area under curve, mean value) are widely used in clinical evaluation [27]. However, these parameters may be affected by electrode location and the volume conductor [28]. Thus, only temporal parameters are generally accepted as suitable indices to quantify SEMG signals. The present study identified two additional parameters from SEMG signal: the RMS peak time and the interval modality. These two parameters are able to provide additional information to that which is supplied by classical temporal parameters, and these parameters present significant differences between healthy subjects and patients with lumbar disc herniation [29]. In addition, RMS peak times have small individual variation and can be used to compare different subjects. Despite the robustness of the results achieved, the participants in this study were limited to those of Chinese origin, which could limit the generalizability of the findings.
Conclusion
In conclusion, the present study identified the different activation modalities of healthy subjects during walking. These different activation modalities intervals provided a new insight to evaluate the degree of rehabilitation of patients with nerve or muscle diseases. In addition, the interval modality and RMS peak time proposed in this study can be used as a new parameter to complement the classic temporal parameters when evaluating the function of nerves or muscle diseases.
Footnotes
Acknowledgments
This work was partly supported by a grant from the Beijing Rehabilitation Hospital (No. 2018-004, 2018-006).
Conflict of interest
None to report.