Abstract
BACKGROUND AND OBJECTIVE:
Although careful clinical examination and medical history are the most important steps towards a diagnostic separation between different tremors, the electro-physiological analysis of the tremor using accelerometry and electromyography (EMG) of the affected limbs are promising tools.
METHODS:
A soft-decision wavelet-based decomposition technique is applied with 8 decomposition stages to estimate the power spectral density of accelerometer and surface EMG signals (sEMG) sampled at 800 Hz. A discrimination factor between physiological tremor (PH) and pathological tremor, namely, essential tremor (ET) and the tremor caused by Parkinson’s disease (PD), is obtained by summing the power entropy in band 6 (B6: 7.8125–9.375 Hz) and band 11 (B11: 15.625–17.1875 Hz).
RESULTS:
A discrimination accuracy of 93.87% is obtained between the PH group and the ET & PD group using a voting between three results obtained from the accelerometer signal and two sEMG signals.
CONCLUSION:
Biomedical signal processing techniques based on high resolution wavelet spectral analysis of accelerometer and sEMG signals are implemented to efficiently perform classification between physiological tremor and pathological tremor.
Keywords
Introduction
Tremor is defined as a rapid involuntary back-and-forth or up-and-down movement of a body part and is a readily apparent and easily quantified motor phenomenon found both in normal individuals and as a pathological symptom [1]. Physiological tremor (PH) is the most well-known form of tremor; it has a mechanical component that consists of the damped oscillation, which is driven by several factors: resonance at the Eigen-frequency, cardio ballistic effects, and the discontinuities of innervation [2]. The resonance frequency can be identified by spectral analysis of the accelerometer signal from the affected extremity or the EMG from the antigravity muscle [2].
The two most frequent and common pathological tremor forms encountered in clinical neurology are essential tremor (ET) and Parkinson’s disease (PD)-related tremor [3, 4]. It has been shown that up to 20% of those two tremors are misdiagnosed during the early years of the disease [3].
The key features that help clinicians to separate the different tremor entities are the tremor frequency, the conditions under which the tremor is activated, the medical and family history (e.g., hereditary tremor, factors influencing the tremor) and the neurological examination (e.g., akinesia, rigidity, peripheral neuropathies) [2]. Those criteria are mostly good enough to separate the conditions. However, especially in the beginning of the disease, significant errors may occur.
There is an overlap in the clinical presentation between ET and PD that can make the differentiation difficult on purely clinical grounds [5, 6, 7, 8]. In such overlap cases, SPECT (Single-Photon-Emission Computer Tomography) technology (FP-CIT) is used which comes with radiation. Note that careful pre-administration of iodine can limit the radiation. Therefore, classical spectral analysis of tremor time-series recorded by accelerometer and surface EMG has been used to replace SPECT [9, 10, 11].
During visual assessments, there are some groups in an essential tremor that, at one extreme, are misdiagnosed as physiological tremor and, at the other extreme, are misdiagnosed as Parkinsonian tremor. Thus, there is a need for neurophysiological assessment based on spectral analysis of accelerometer and sEMG signals [12].
The spectral analysis based on fast Fourier transform (FFT) is most often used. However, FFT has two limitations: first, it assumes that tremor is a linear and periodic signal, which is not the case; second, it cannot discriminate between different tremors, when their frequency spectrum overlap, such as essential tremor and physiological tremor [13].
To increase the efficiency of discrimination, methods beyond the standard spectral analysis of the recorded tremor time-series have been applied to separate different pathological tremors [3, 14, 15, 16, 17, 18, 19].
In this study we have used a wavelet-based soft-decision algorithm to estimate the power spectral density of both accelerometer and surface EMG signals to discriminate between PH, ET and PD [19]. It is concluded that the power spectra of short (30 s) EMG and accelerometer time-series recorded in a laboratory setting carry important information in the different frequency bands and this information could be sufficient for the discrimination between different tremors during diagnosis.
Methods and patients
Subjects
Nineteen PH subjects with a mean age of 48.58 years, 39 PD subjects with a mean age of 66 years, and 41 ET subjects with a mean age of 64 years were analyzed. All patients suffered from a moderate to severe postural tremor. Clinical diagnosis was made according to standards and served as the gold standard for this study. Nine of the patients received a DaTscan to confirm the diagnosis because of diagnostic uncertainty. The data was divided into two sets and used for trial (training set) and testing (test set), respectively. The features were obtained from the trial set, and the discrimination algorithm was tested for performance evaluation on the test set. The mean age, sex, and disease duration of the PH subjects were compared with PD patients and ET patients for the trial and test data (see Tables 1 and 2). All patients provided informed consent, and the study was approved by the local ethics committee at the University of Kiel, Germany.
The data was recorded for diagnostic purposes at the Department of Neurology of the University of Kiel, Germany. Two sets of data were used: the trial set, which consists of 21 ET and 19 PD subjects, which was used to obtain the threshold value of the discrimination factor differentiating between the two different tremors. The test data set, which comes from 20 ET and 20 PD patients, was used to test the method and to evaluate its performance. A discriminating efficiency of 85% resulted.
Trial data-size, age, gender, and disease duration distribution of PH, PD and ET subjects
Trial data-size, age, gender, and disease duration distribution of PH, PD and ET subjects
Test data-size, age, gender, and disease duration distribution of PH, PD and ET subjects
The settings in which the data from both the PH and pathological (PD and ET) patients were recorded are identical and similar to the settings in [19]. Postural tremor was recorded for a period of 30 seconds from the more affected side of both patient groups during a postural task with the hands extended (0 deg) and the forearm resting on an arm rest. For the normal subjects the right hand was used. A piezoelectric accelerometer was fixed to the dorsum of the more affected hand in the middle of the third metacarpal bone, and bipolar surface-EMG recordings with silver-silver-chloride electrodes from forearm flexors (EMG1) and extensors (EMG2) were taken. All data were sampled at 800 Hz.
Data analysis
Soft-decision wavelet-decomposition (SD-WD) technique
The soft-decision wavelet-decomposition technique is well-established [20, 21, 22, 23, 24] and can be used to estimate the power spectral density of any signal using the following steps:
The signal should be decomposed first using a selected wavelet filter into two sub-bands: low-pass and high-pass sub-bands. The decomposition should be followed up to a certain stage A probability measure should be assigned to each branch in the first decomposition (frequency sub-band) estimating how much information (power) is contained in each sub-band in comparison to the total information (power). For the next stages of decompositions, the probability measure of the resulting sub-bands should be made equal to the product of the previous branch probability and the conditional probability estimated at the given stage. The probabilities derived from the estimator outputs are interpreted as a coarse measurement of the PSD of the signal.
The soft-decision algorithm is implemented on the trial data using Daubechie’s “db4” wavelet filters with
Many wavelet filters other than db4 wavelet filters have been also used, but since no better results were obtained, only the results of db4 filters were kept in the paper due to their simplicity. Frequencies above 31.25 Hz (covered by bands 21 up to 256) are not considered in our algorithm as all tremor frequencies and their first harmonics are below 31.25 Hz [3, 9].
The PSD (the probability values found from step 5 of the soft-decision technique) and the entropies (PSD values converted to log scale) of the important 20 bands were obtained for each PH-, PD-, and ET-record, and for each signal out of the three used sources (accelerometer, EMG1, and EMG2).
A blind search was implemented in [19] to find a combination of the same two bands from the three different signals of the trial set that could be used as a classification (discrimination) factor between ET and PD. This blind search led to a good classification factor (CF) between the two groups, namely, the sum of the power entropies of band 6 (B6, 7.8125 Hz–9.375 Hz) and band 11 (B11, 15.625 Hz–17.1875 Hz). By blind search, we mean that all combinations of the two bands among the first 20 bands (up to 31.25 Hz) have been tried, but we found the combination B6 and B11 to be the best.
All CF values were plotted for all trial data and a threshold was selected using the receiver operating characteristic algorithm (ROC) [25] to discriminate between the two groups under investigation in the discrimination stage.
Classification performance
A classifier is a parameter or a variable with a suitable optimal threshold, which is used in a classification algorithm. In this study, only binary classification is considered, e.g., classification between two different cases termed “positive case” and “negative case”. The performance of a classifier is evaluated by three main metrics: specificity, sensitivity, and accuracy, as follows [25]:
where the entities in the above equations have the following meanings: TN
Specificity indicates the ability of a classifier to detect negative (PH) cases. Sensitivity represents the ability of a classifier to detect the positive (ET or PD) cases. Accuracy represents the overall performance of a classifier. It indicates the percentage of correctly classified positive and negative cases among the total number of cases.
Results
Discrimination between PH and ET
The trial data consist of 10 PH and 21 ET subjects, while test data come from 9 PH and 20 ET patients. Figure 1a and b show the discrimination results between PH and ET for the accelerometer signal and for trial and test data, respectively. Table 3 shows the specificity, sensitivity, and accuracy results for trial data, test data, and all data, using the accelerometer, EMG1, and EMG2, and a voting between the three signals.
Figures A.1.1 and A.1.2 (see Appendix) show the results of PH and ET for EMG1 signal and for both trial and test data, respectively. Figures A.1.3 and A.1.4 (See Appendix) show the results of PH and ET for EMG2 and for both trial and test data, respectively.
Results of classification between PH and ET
Results of classification between PH and ET
a. Discrimination between PH and ET in trial data using the accelerometer signal. b. Discrimination between PH and ET in test data using the accelerometer signal.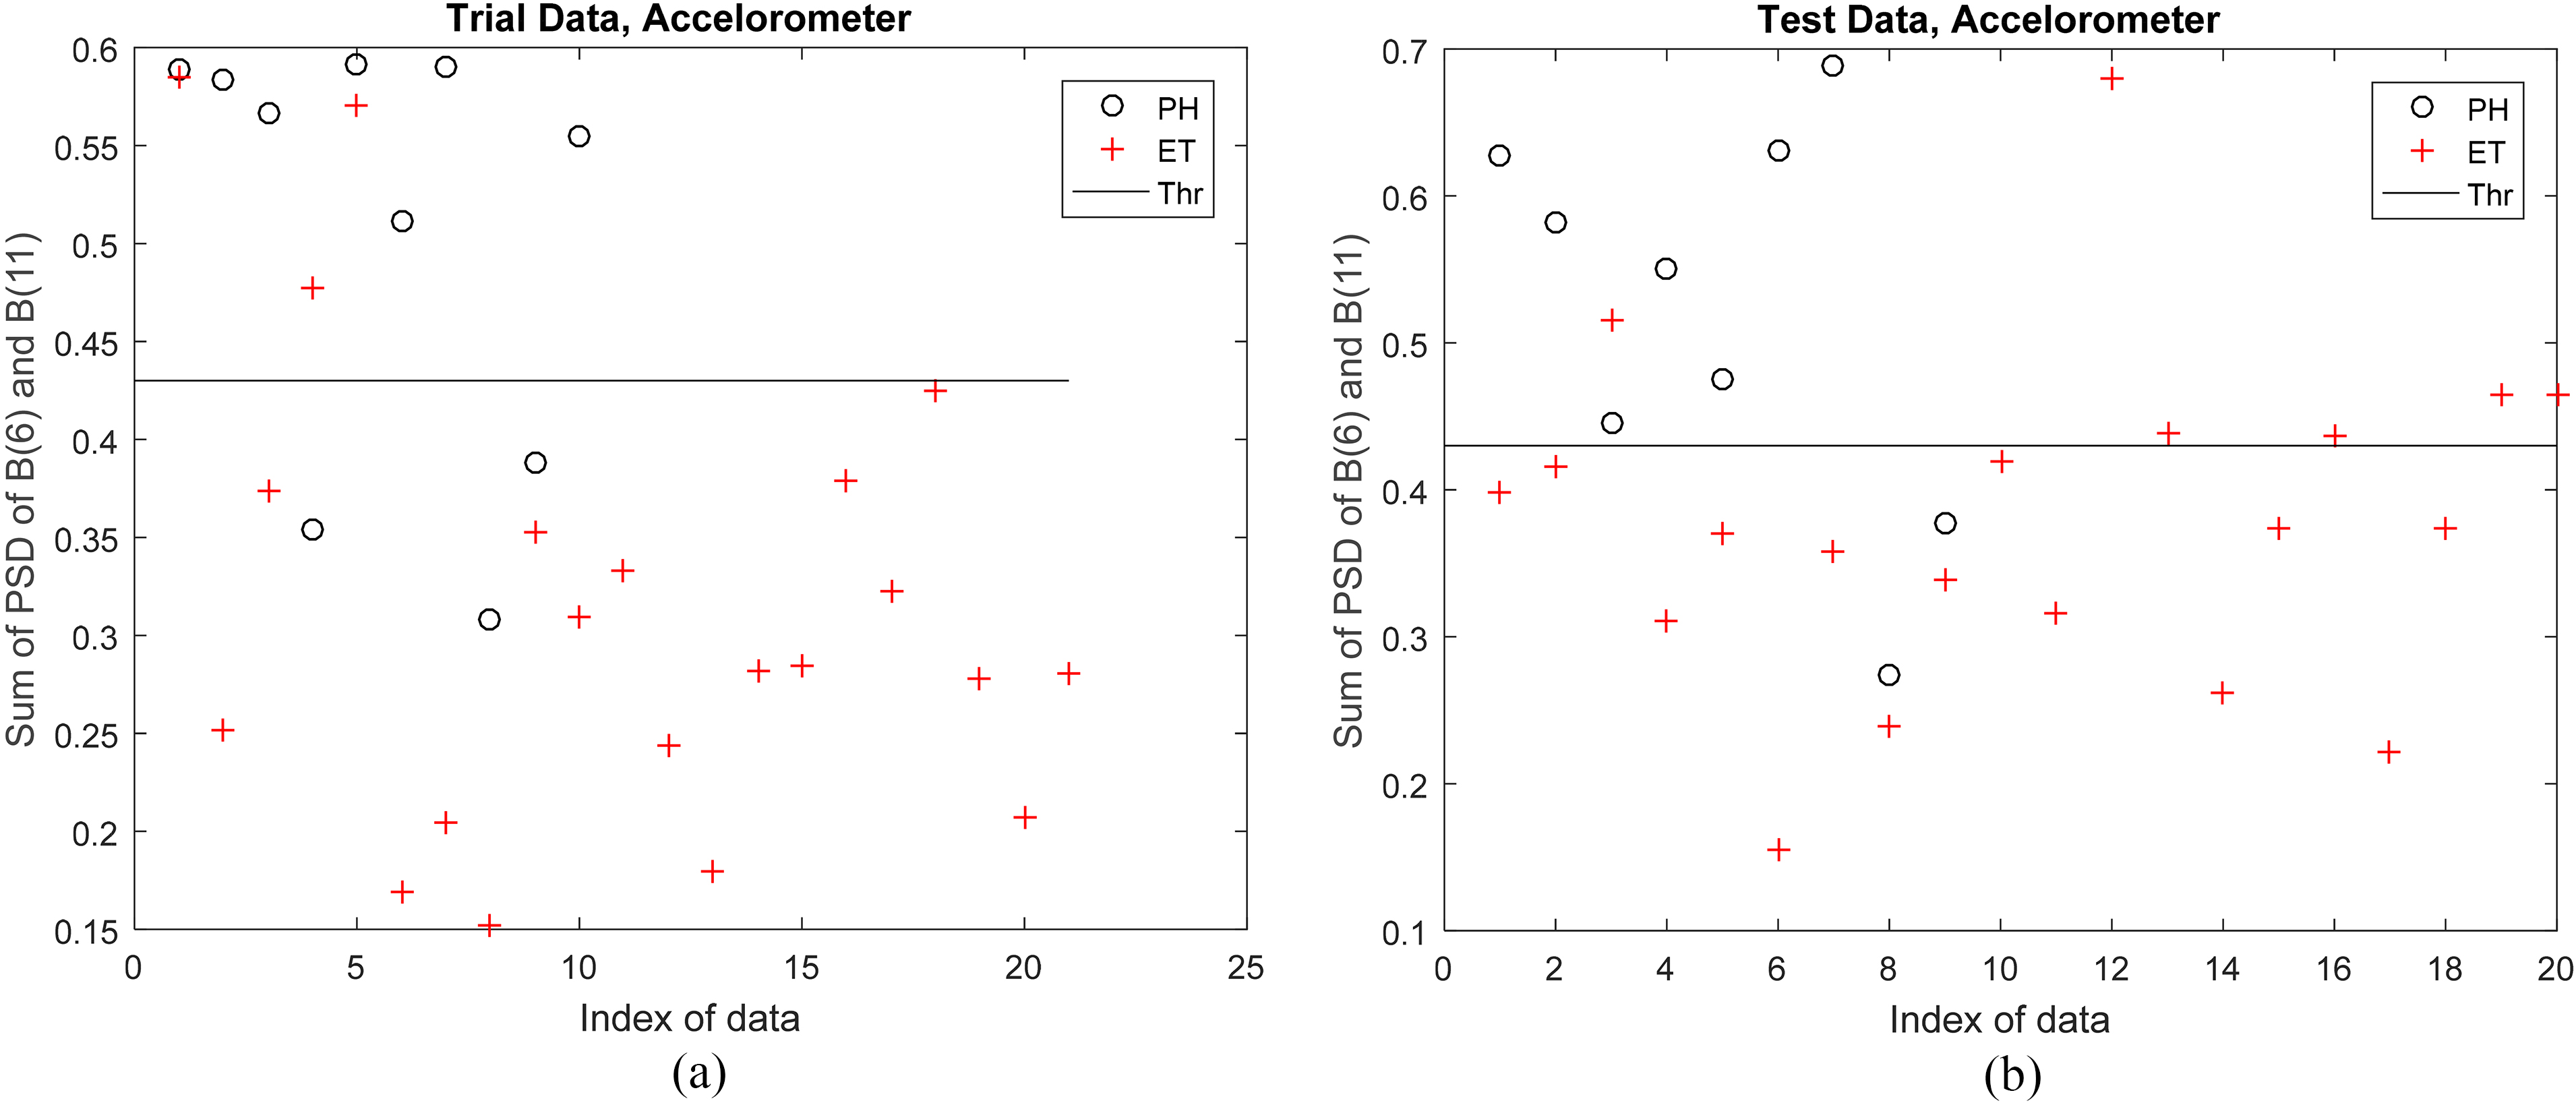
Results of classification between PH and PD
Results of classification between PH and PD
a. Discrimination between PH and PD in trial data using the accelerometer signal. b. Discrimination between PH and PD in test data using the accelerometer signal.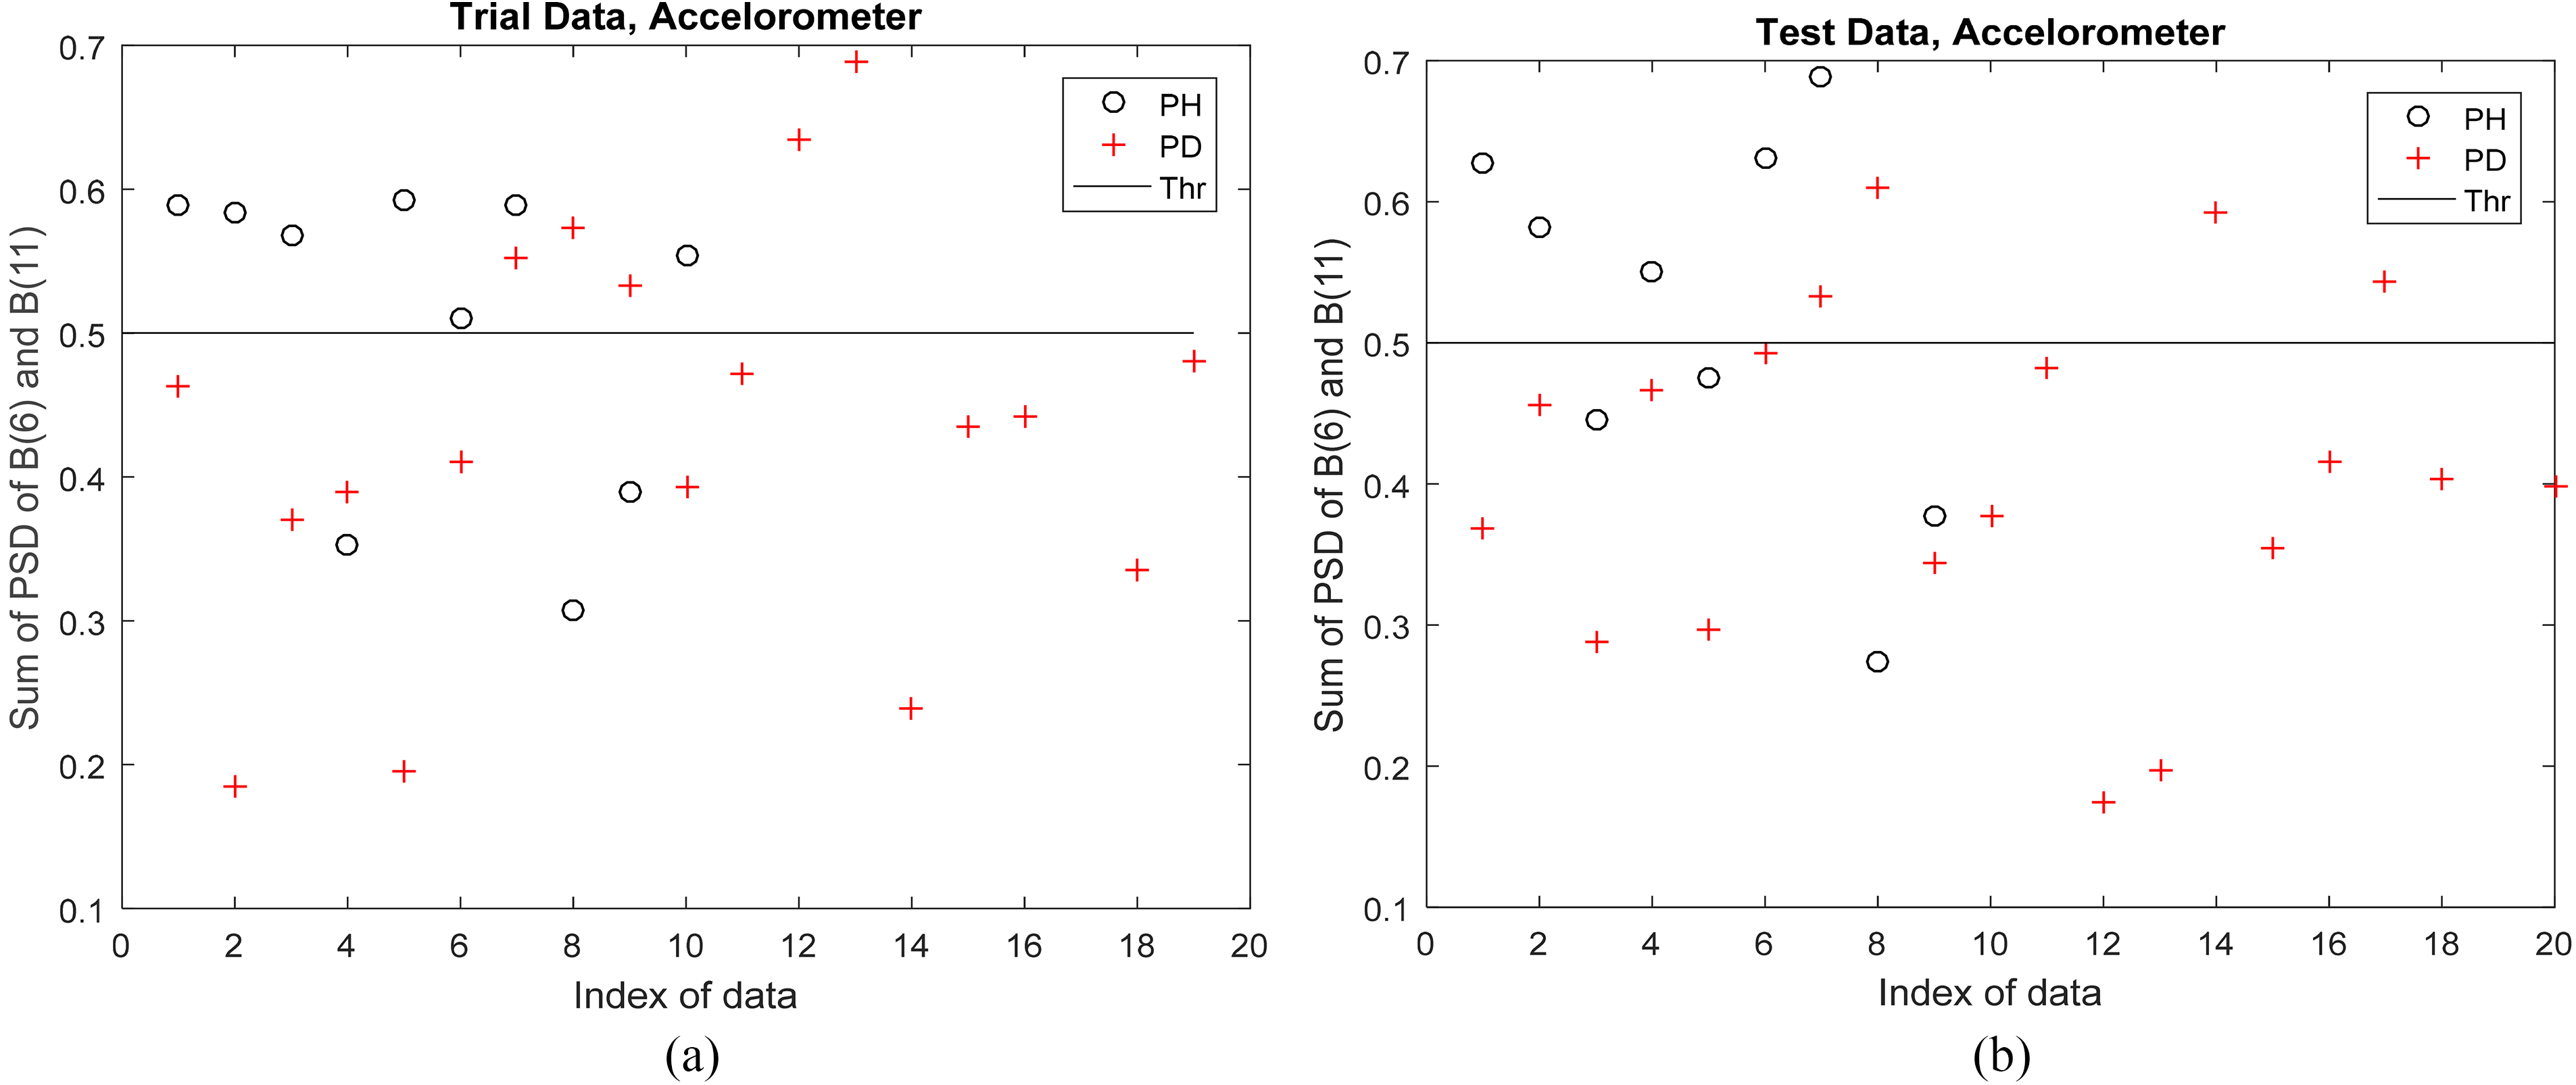
a. Discrimination between PH and PD & ET in trial data using the accelerometer signal. b. Discrimination between PH and PD & ET in test data using the accelerometer signal.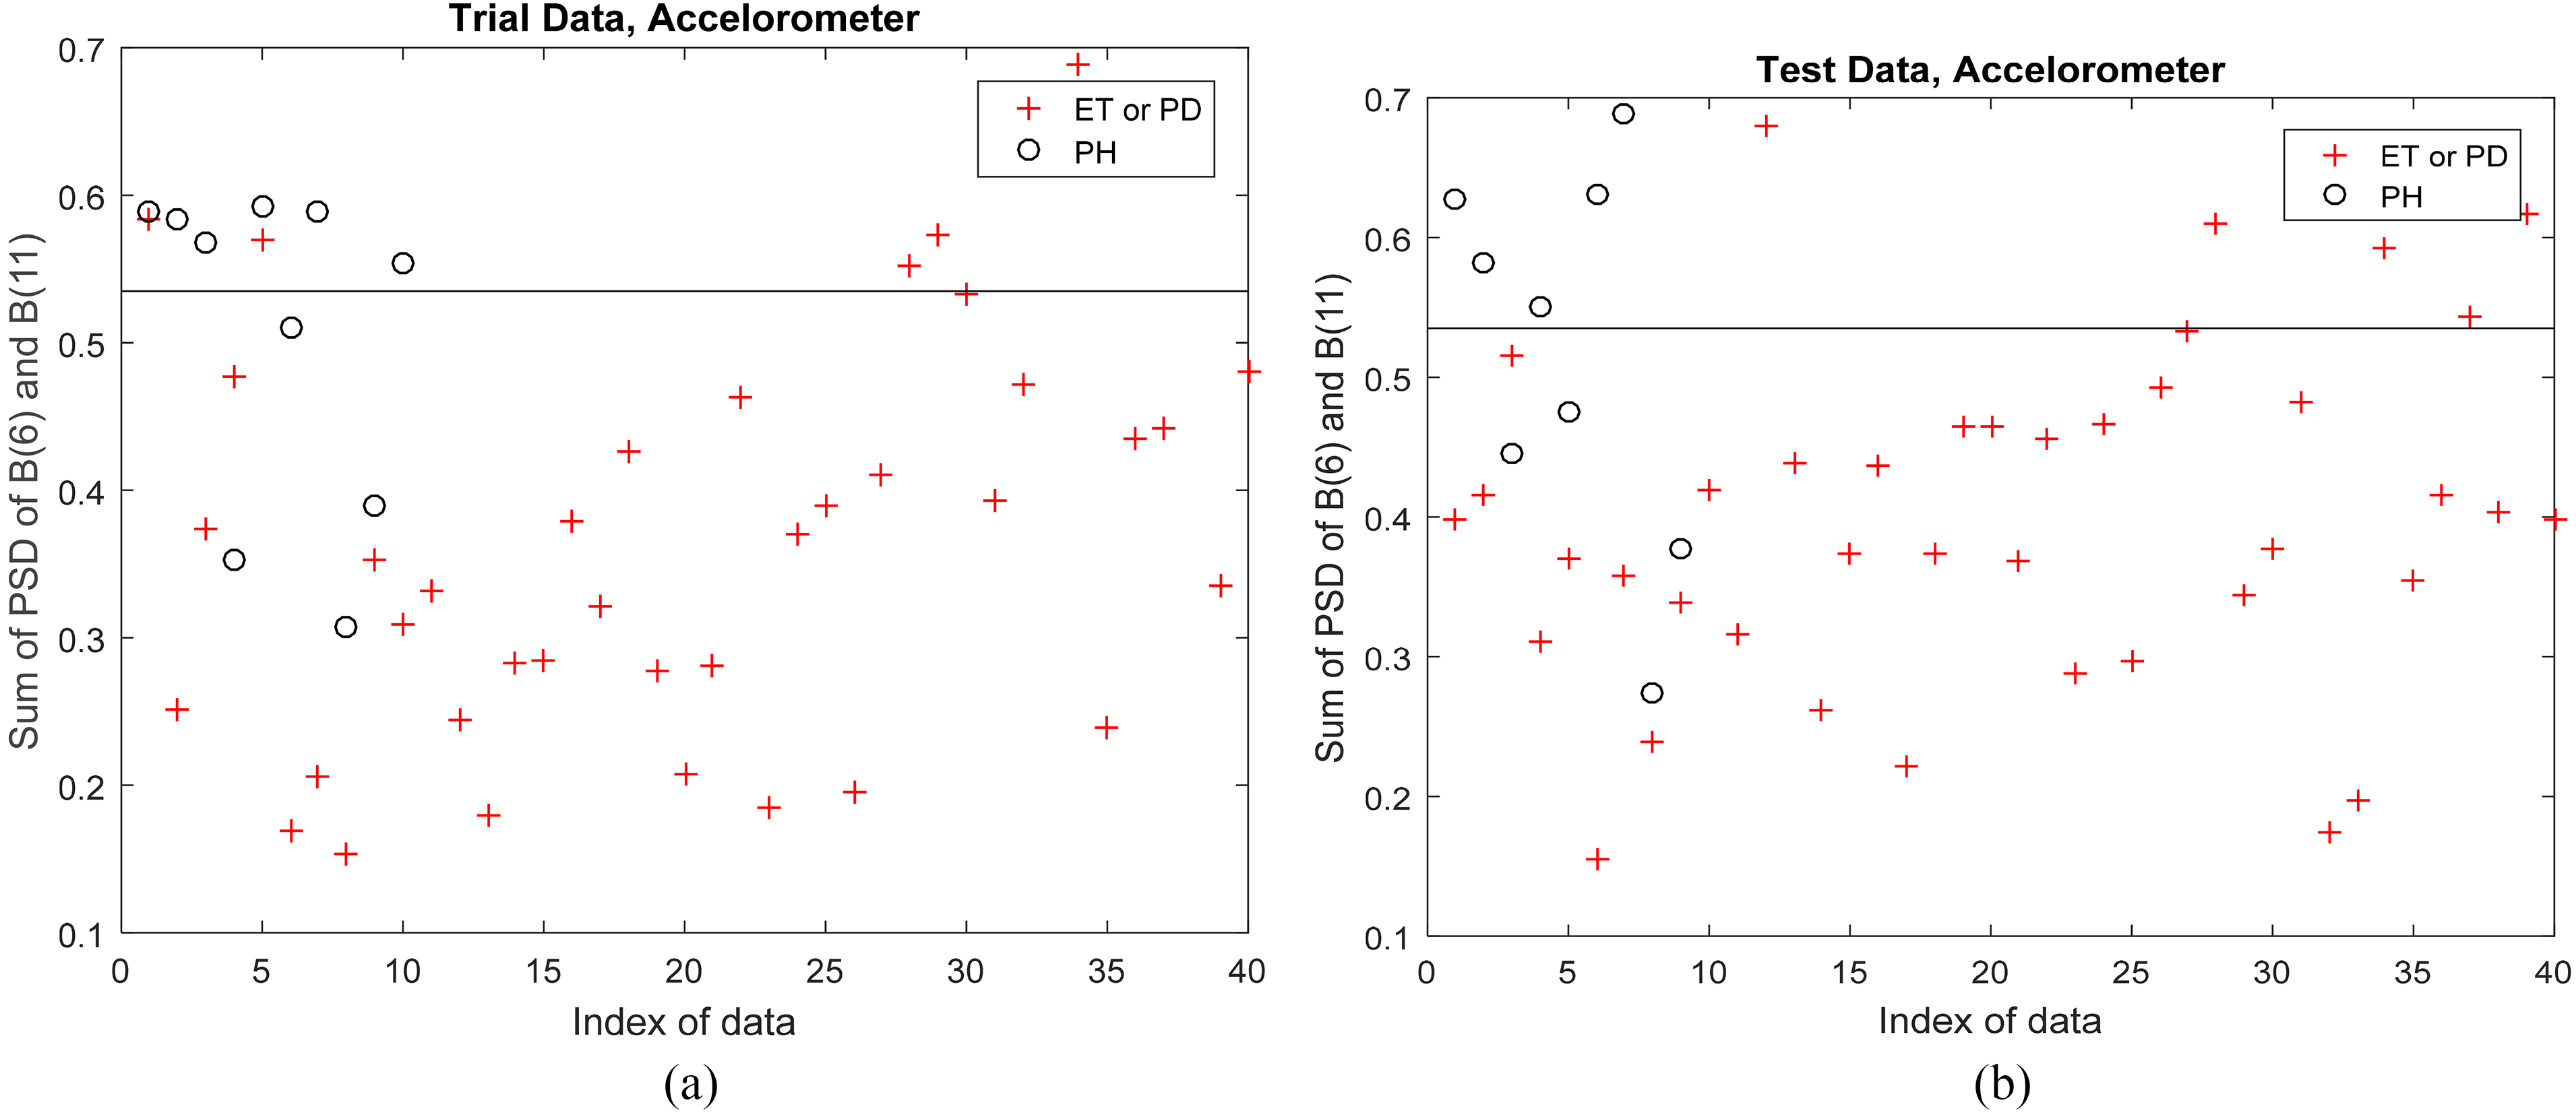
The trial data consist of 10 PH and 19 PD subjects, while test data stem from 9 PH and 20 PD patients. Figure 2a and b show the results of PH and PD for the accelerometer signal and for trial and test data, respectively. Figures A.2.1 and A.2.2 (see Appendix) show the results of PH and PD for EMG1 signal and for both trial and test data, respectively. Figures A.2.3. and A.2.4 (see Appendix) show the results of PH and PD for EMG2 and for both trial and test data, respectively. Table 4 shows the specificity, sensitivity, and accuracy results for trial data, test data, and all data, using the accelerometer, EMG1, EMG2, and a voting between the three signals.
At this stage, discrimination was done between PH and PD & ET as one group.
The trial data consist of 10 PH and 40 pathological (19 PD and 21 ET) subjects, while the test data came from 9 PH and 40 pathological (20 PD and 20 ET) cases.
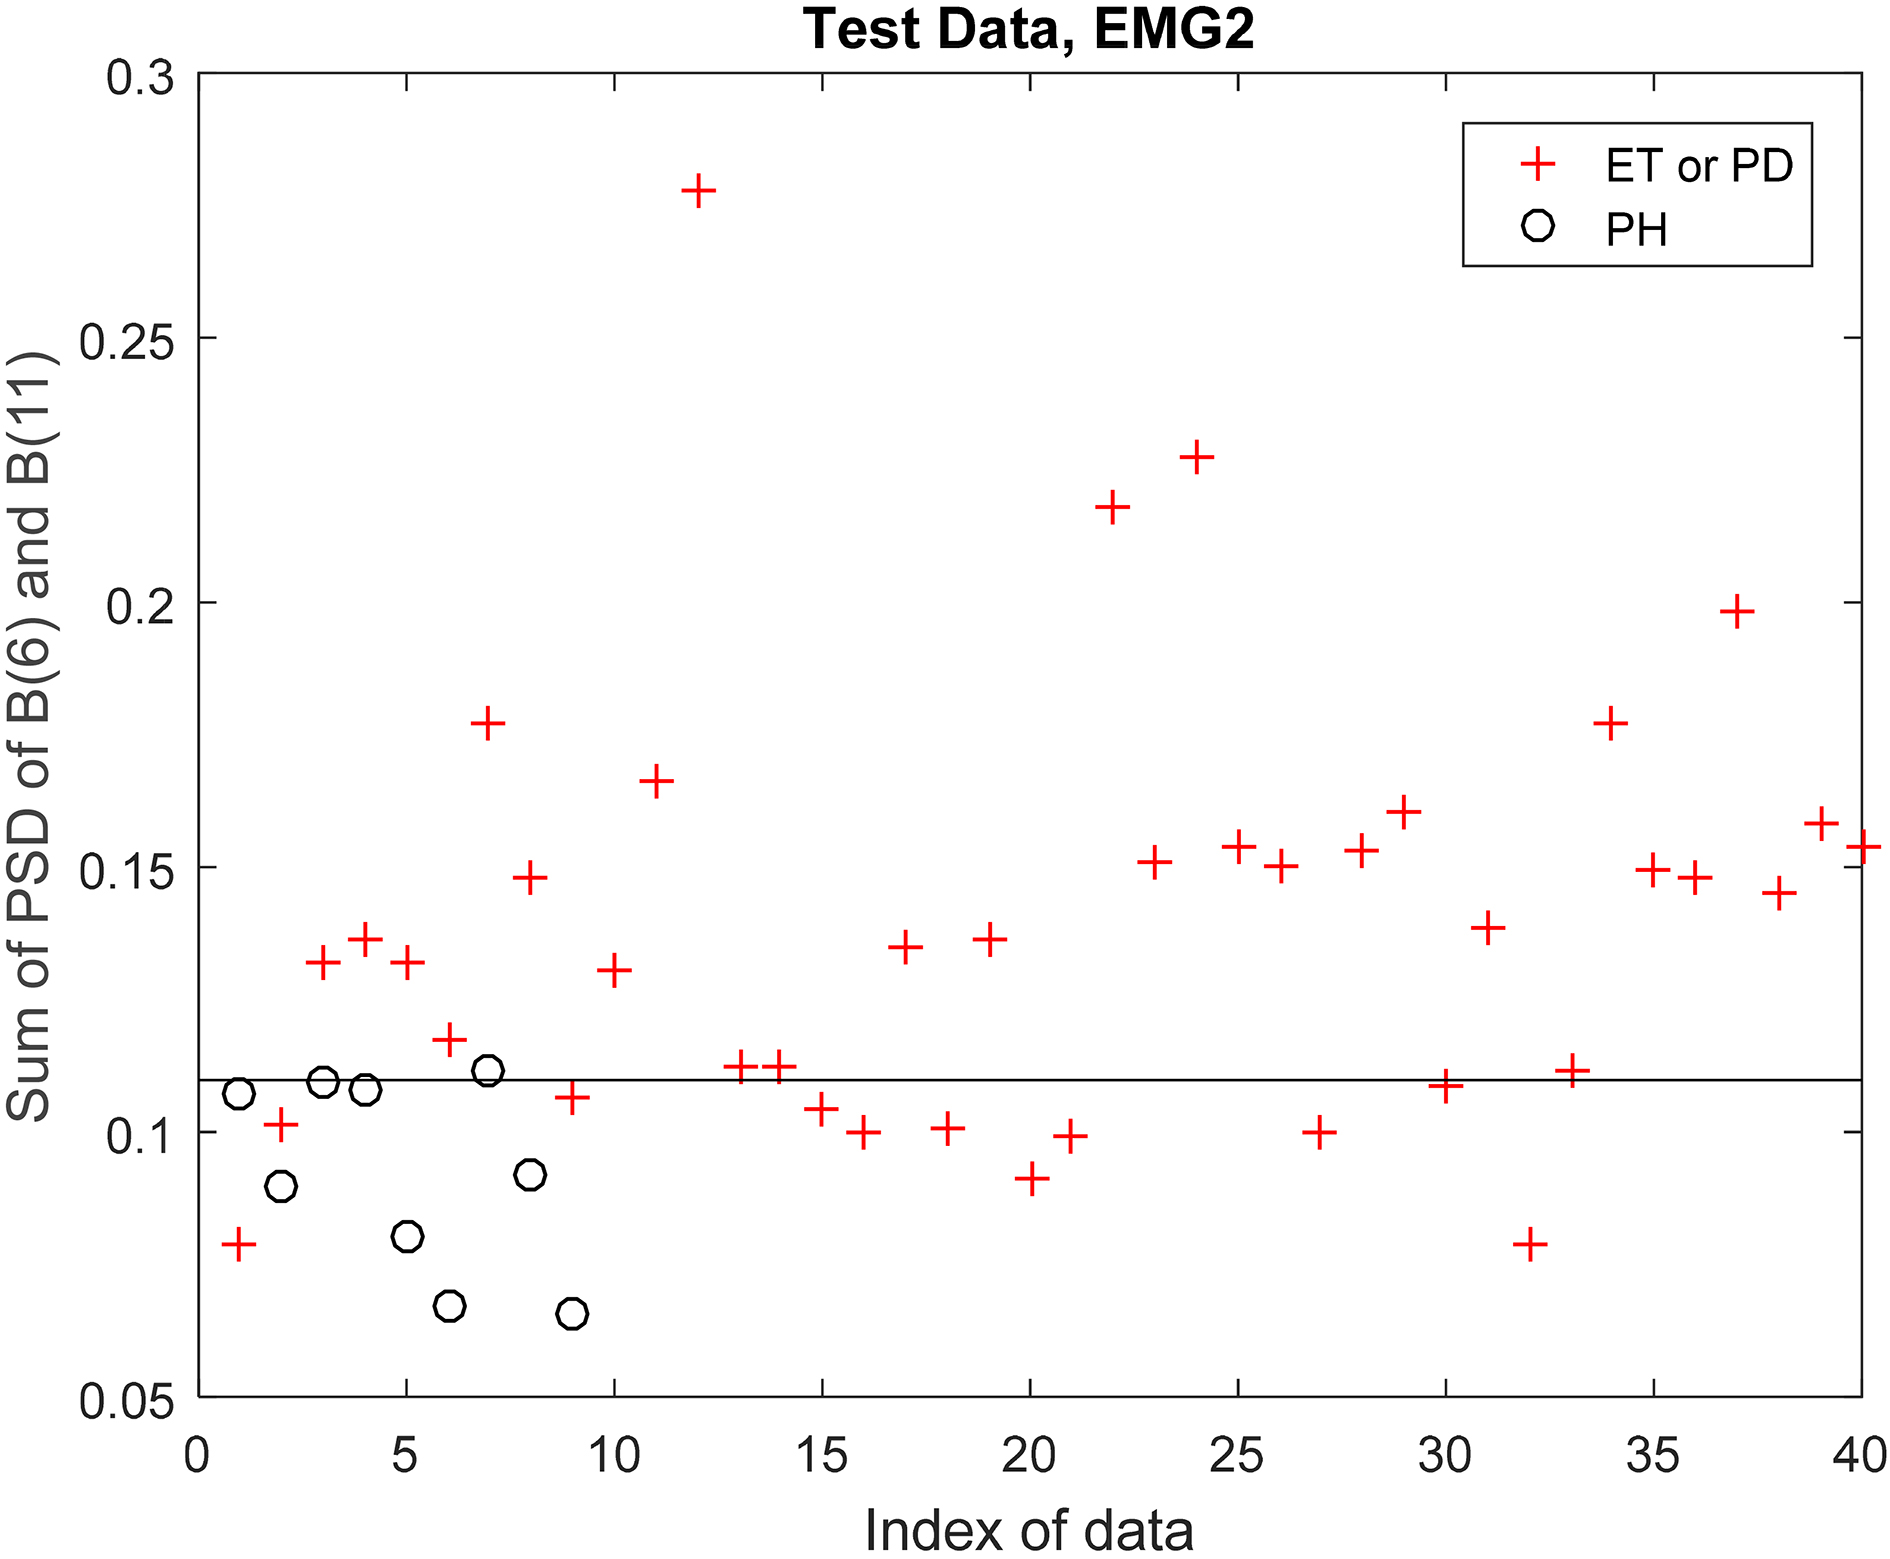
Figure 3a and b show the results of PH and PD & ET for the accelerometer signal and for trial and test data, respectively. Figures A.3.1. and A.3.2. (see Appendix) show the results of PH and PD & ET for the EMG1 signal and for both trial and test data, respectively. Figures A.3.3 and A.3.4 (See Appendix) show the results of PH and PD & ET for EMG2 and for both trial and test data, respectively. Table 5 shows the specificity, sensitivity, and accuracy results for trial, test, and all data, using the accelerometer, EMG1, and EMG2 signals, and applying a voting between the three signals.
Results of classification between PH and (PD or ET)
Results of classification between PH and (PD or ET)
An efficient discrimination technique between physiological tremors and pathological tremors (essential and Parkinsonian tremors) based on the computation of the approximate power entropy of the soft-decision wavelet-based frequency bands is implemented in this work. The technique uses as a classification factor the sum of power entropies of bands 6 and 11 out of 256 bands (obtained by 8-decomposition stages) estimating the power-spectral density of the accelerometer and two EMG signals. An accuracy of discrimination between PH and ET on test data is found to be 89.6%. The same accuracy value of discrimination of 89.6% is obtained between PH and PD. An excellent accuracy of discrimination between PH and (ET or PD) of 93.8% is obtained on test data and using a voting between the three signals (accelerometer, EMG1, and EMG2).
It was found that the two frequency bands 6 and 11 have to be used in the discrimination, covering the ranges between 7.8125 and 9.375 Hz, and between 15.625 and 17.1875 Hz, respectively. These bands are very close to the frequency regions in which the first and second harmonic peaks are located. In [26, 27], it has also been observed that the harmonic peaks in PD tremor may be also related to a second tremor generator at twice the tremor frequency. Such observations have not been encountered to the same extent in ET patients [28, 29], and this could thus be an explanation for the differences found in these frequency bands in our present results. It is known that the harmonic peaks are typically broader than those at the basic tremor frequency and may well cover also the frequency bands found in the present study.
Regarding the tremor frequency, tremors can be classified into three main types: low-frequency tremor (less than four cycles per second or Hertz), middle frequency-tremor (between 4 and 7 Hz), and high-frequency tremor (more than 7 Hz) [30]. Physiological tremor usually presents high frequency (8–12 Hz). Essential tremor reaches frequencies between 6–12 Hz, while tremor from Parkinson’s disease usually has frequencies between 4 and 6 Hz [30]. So the frequency bands that we investigated may cover important information about both PH and pathological tremors (PD or ET). According to previous literature [31, 32] the frequencies overlap between ET and PH [13]. For all three tremors analyzed here, there are hints that they are governed by a central oscillator which is shown earlier with electro-physiological studies in PD and ET [33] and in PH [34]. Most of the previous literature in PH had recorded tremor using an accelerometer signal only [35] and restricted the analyses to spectral power of the accelerometer signals [36, 37, 38, 39, 40, 41, 42, 43, 44]. All of them found spectral power in high frequency components. The accelerometer signal, which is a second derivative of displacement, emphasizes high-frequency components [44]. To get comprehensive analyses of the tremor in this study, we looked at both the accelerometer and EMG signals from flexor and extensor in all the patients. Recently also shown in a retrospective cohort of 210 tremor patients [45], the sensitivity increases to 84% when three features are combined, namely, the effect of loading, tremor frequency, and frequency variability, pointing to a voting system of at least 2 positive tests out of 3 for clinical diagnostic purposes.
In summary, a weighted-voting process between the results of the three signals according to their efficiency in discrimination between PH and ET & PD of the trial set can be also used to discriminate between the tremors in the test stage. Such a process may assume different effects of the three signals on the final decision and may have better results than the normal voting approach applied in this paper, especially if it is used with a larger data size. Combination of time-domain parameters and frequency-domain parameters could be a good solution for better discrimination of a larger data size, too. For this purpose, a neural network may be a good solution to be used for trial and feature matching steps.
Footnotes
Acknowledgments
The first author would like to thank DAAD (German Academic Exchange Services) for supporting research visits to Germany in the summer of 2018 and winter of 2019.
Conflict of interest
None to report.
Appendix A.1: Results of discrimination between PH and ET
Discrimination between PH and ET in trial data using EMG1 signal.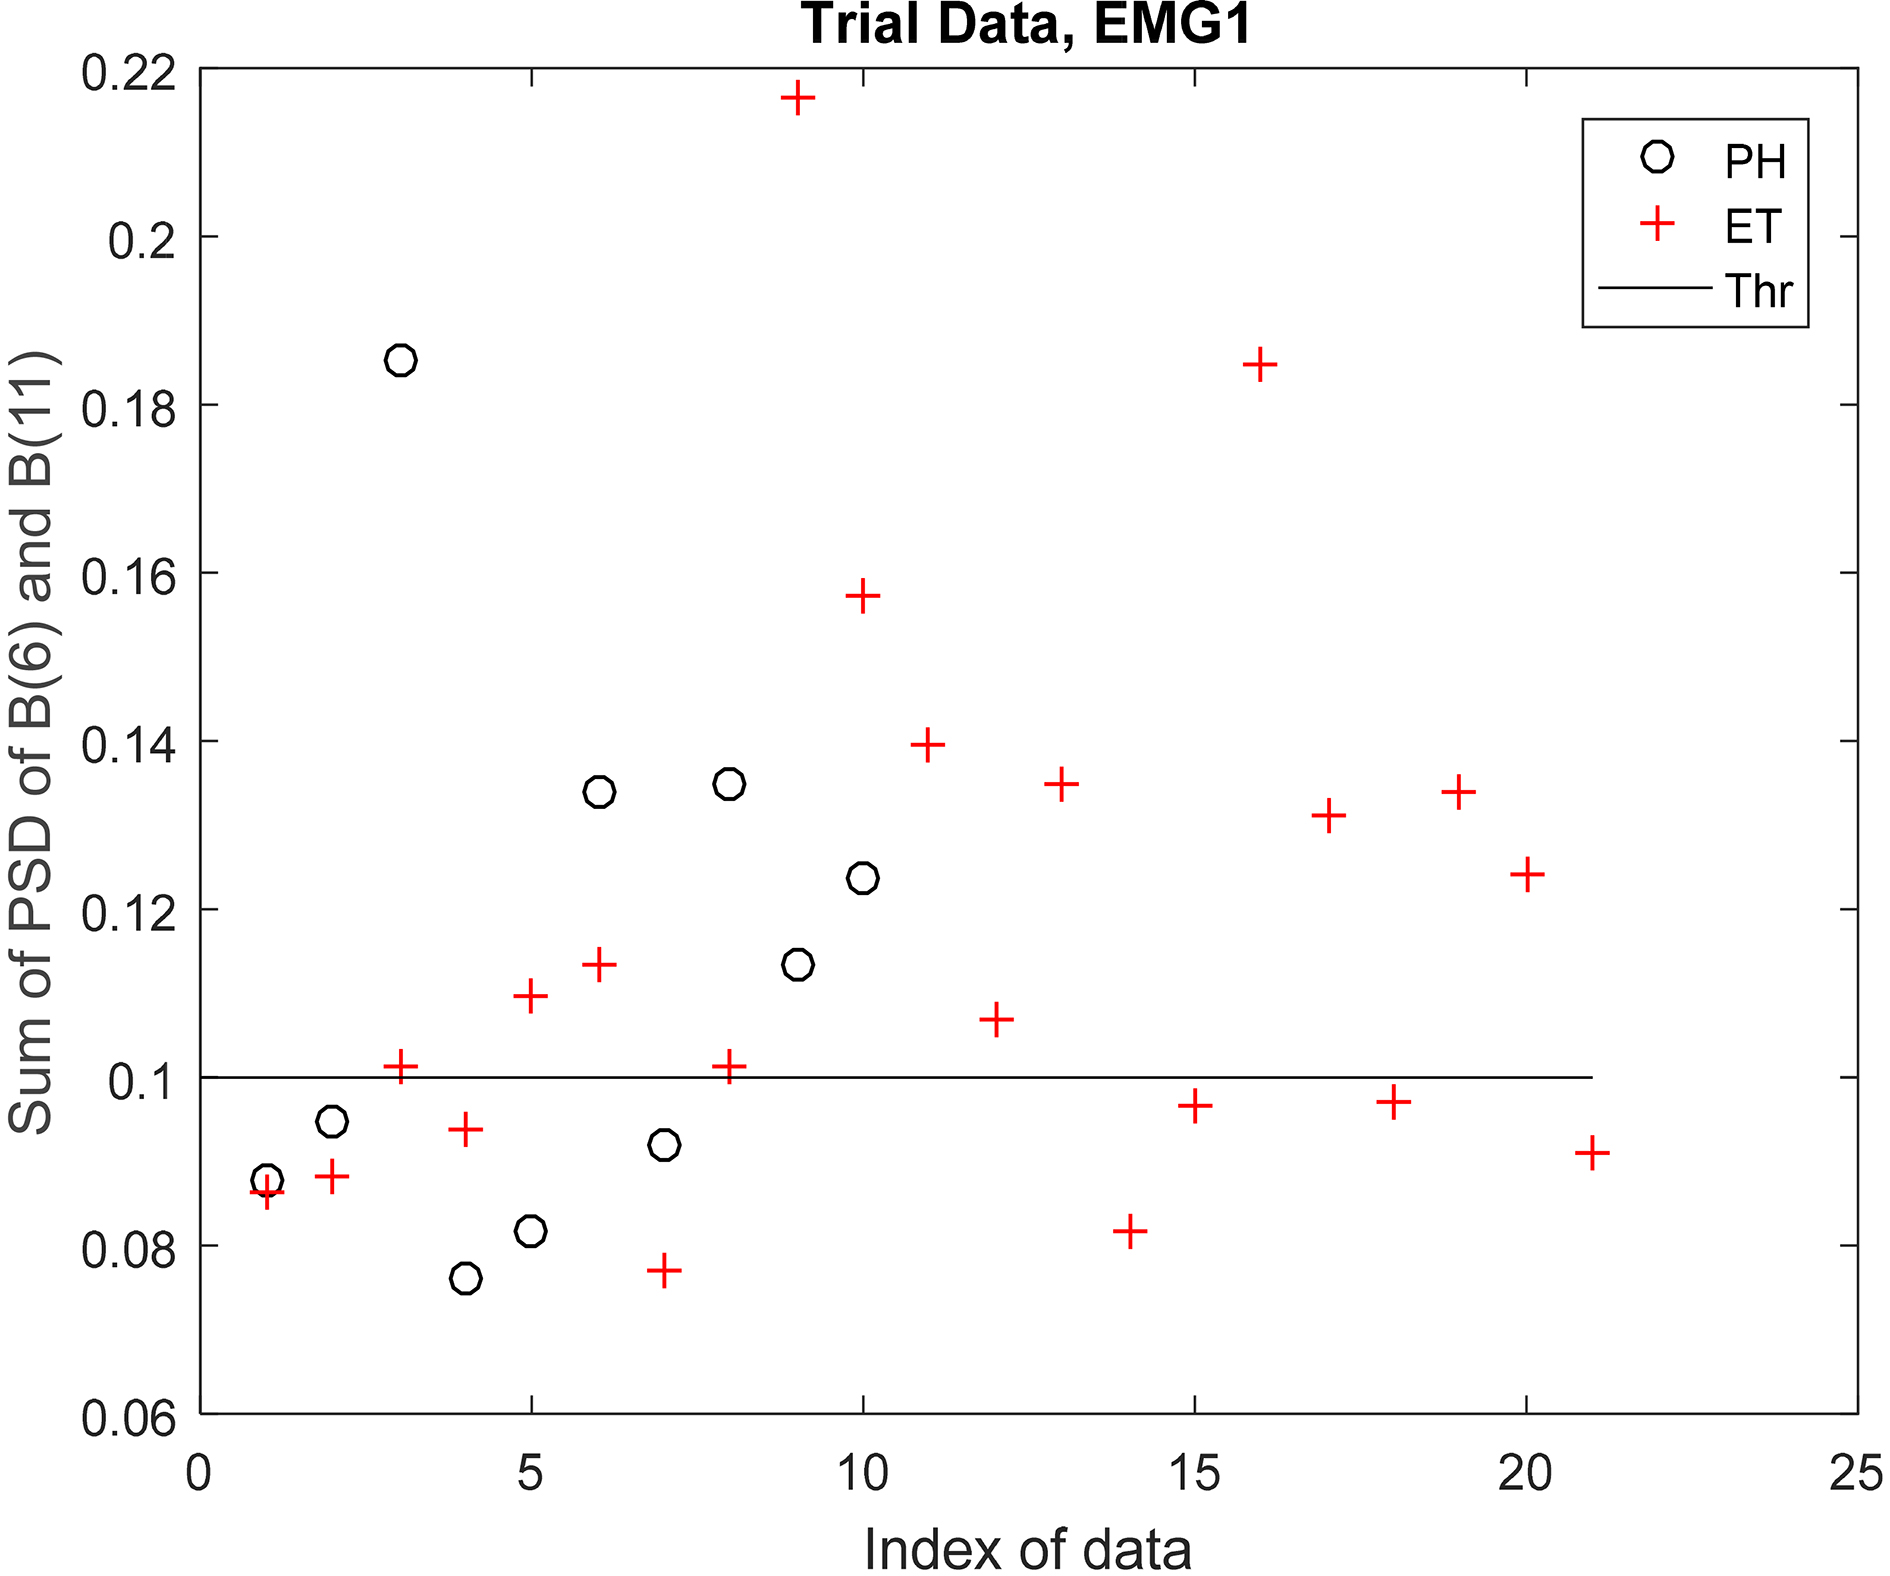
Discrimination between PH and ET in test data using EMG1 signal.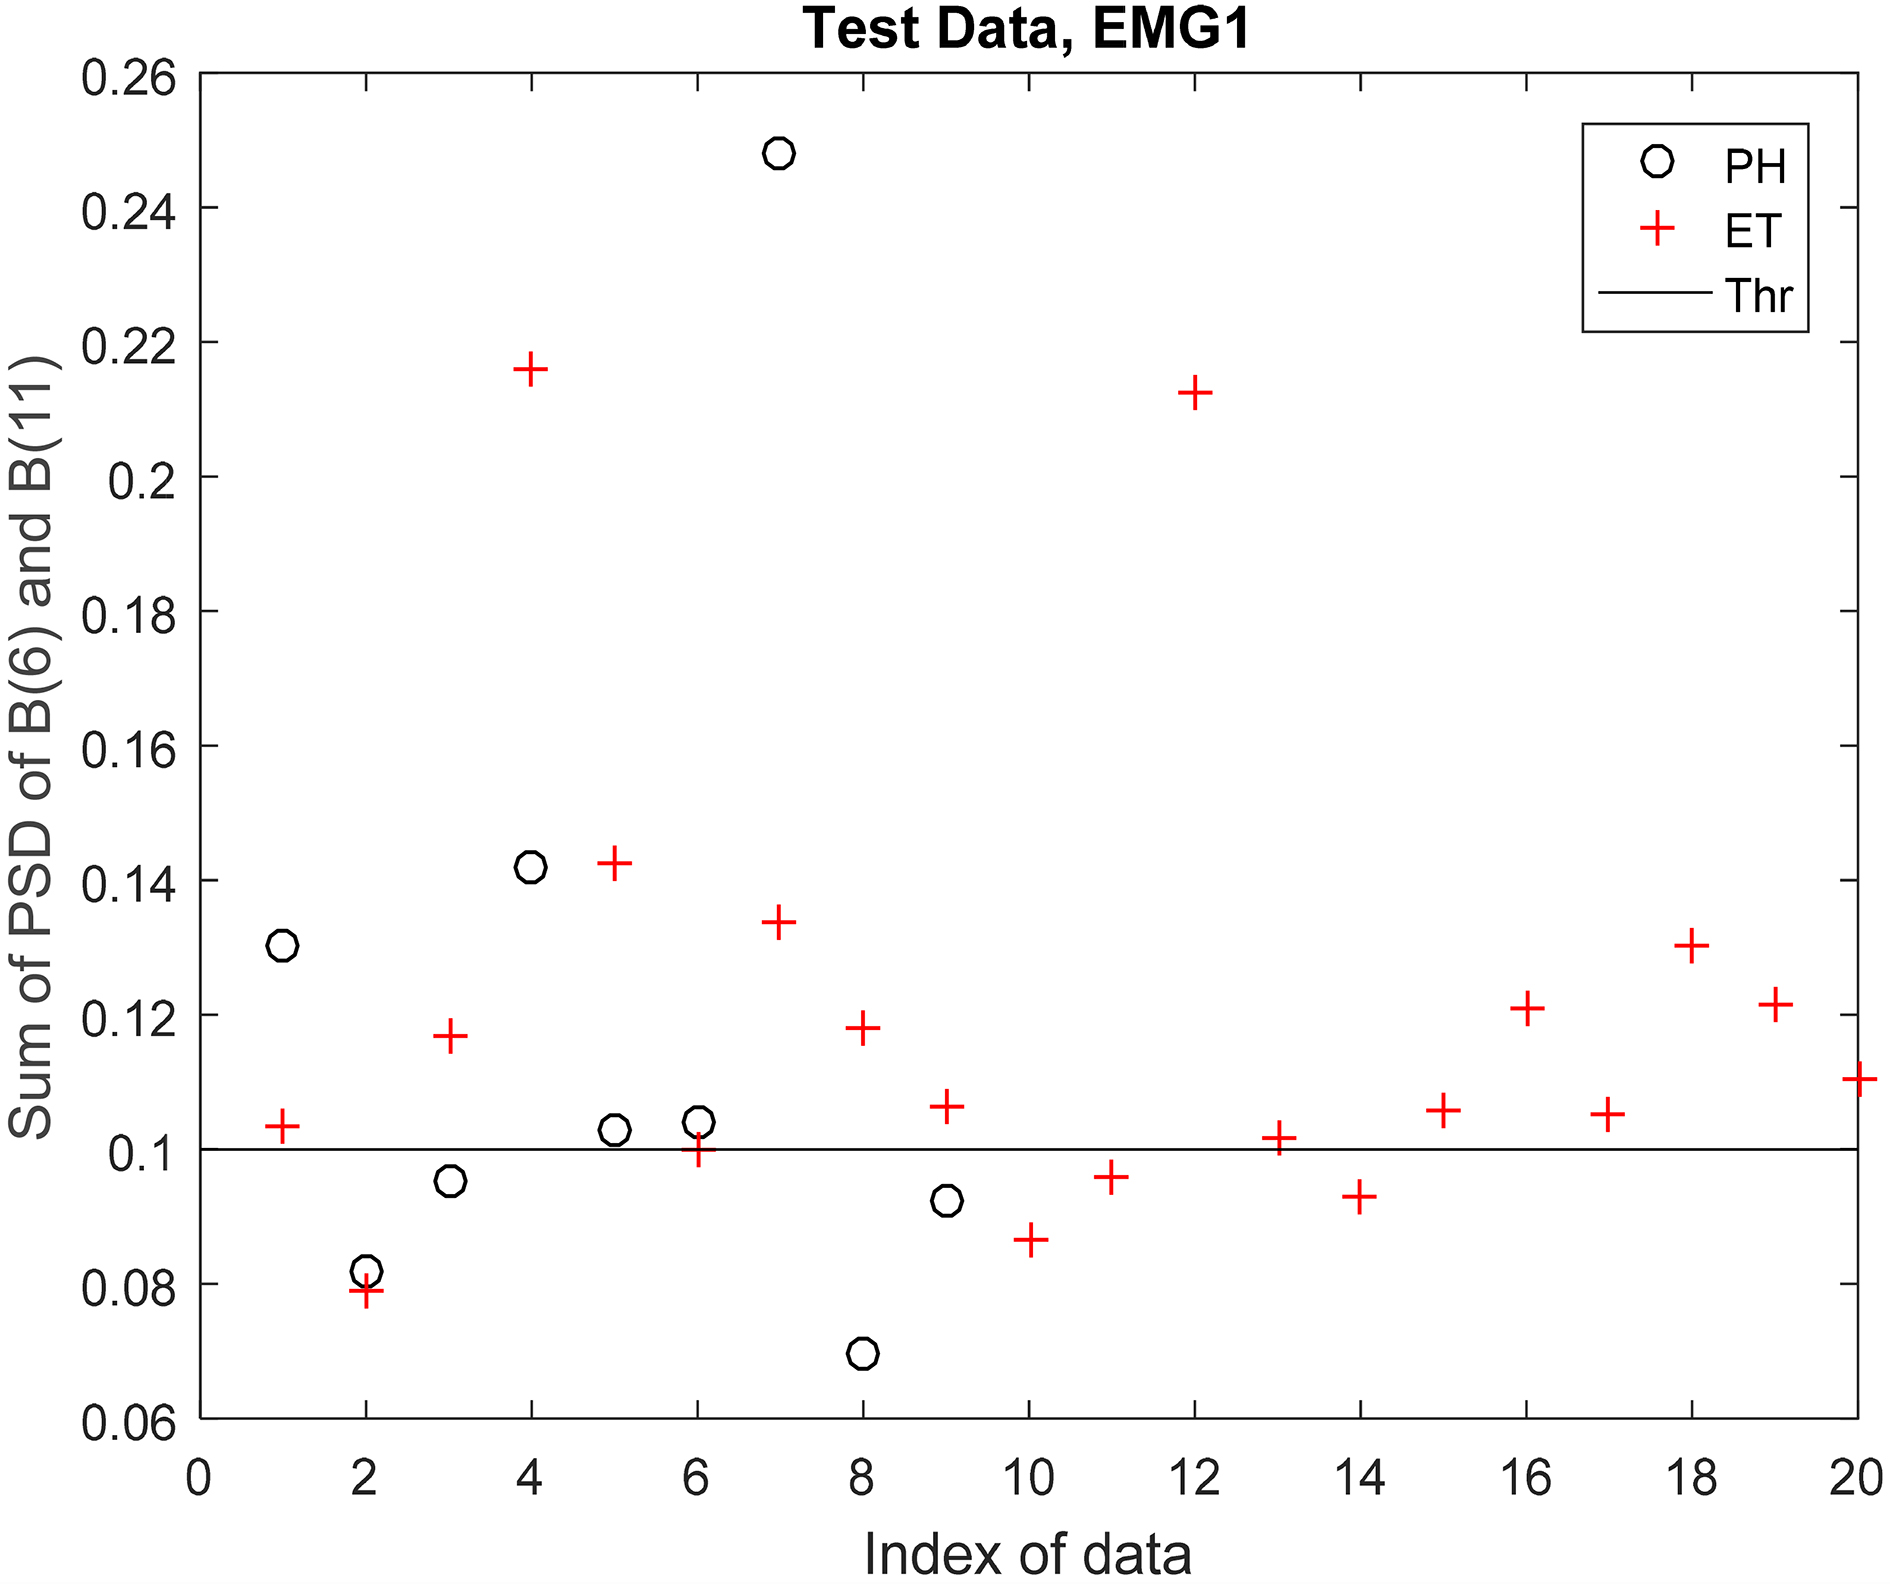
Discrimination between PH and ET in trial data using EMG2 signal.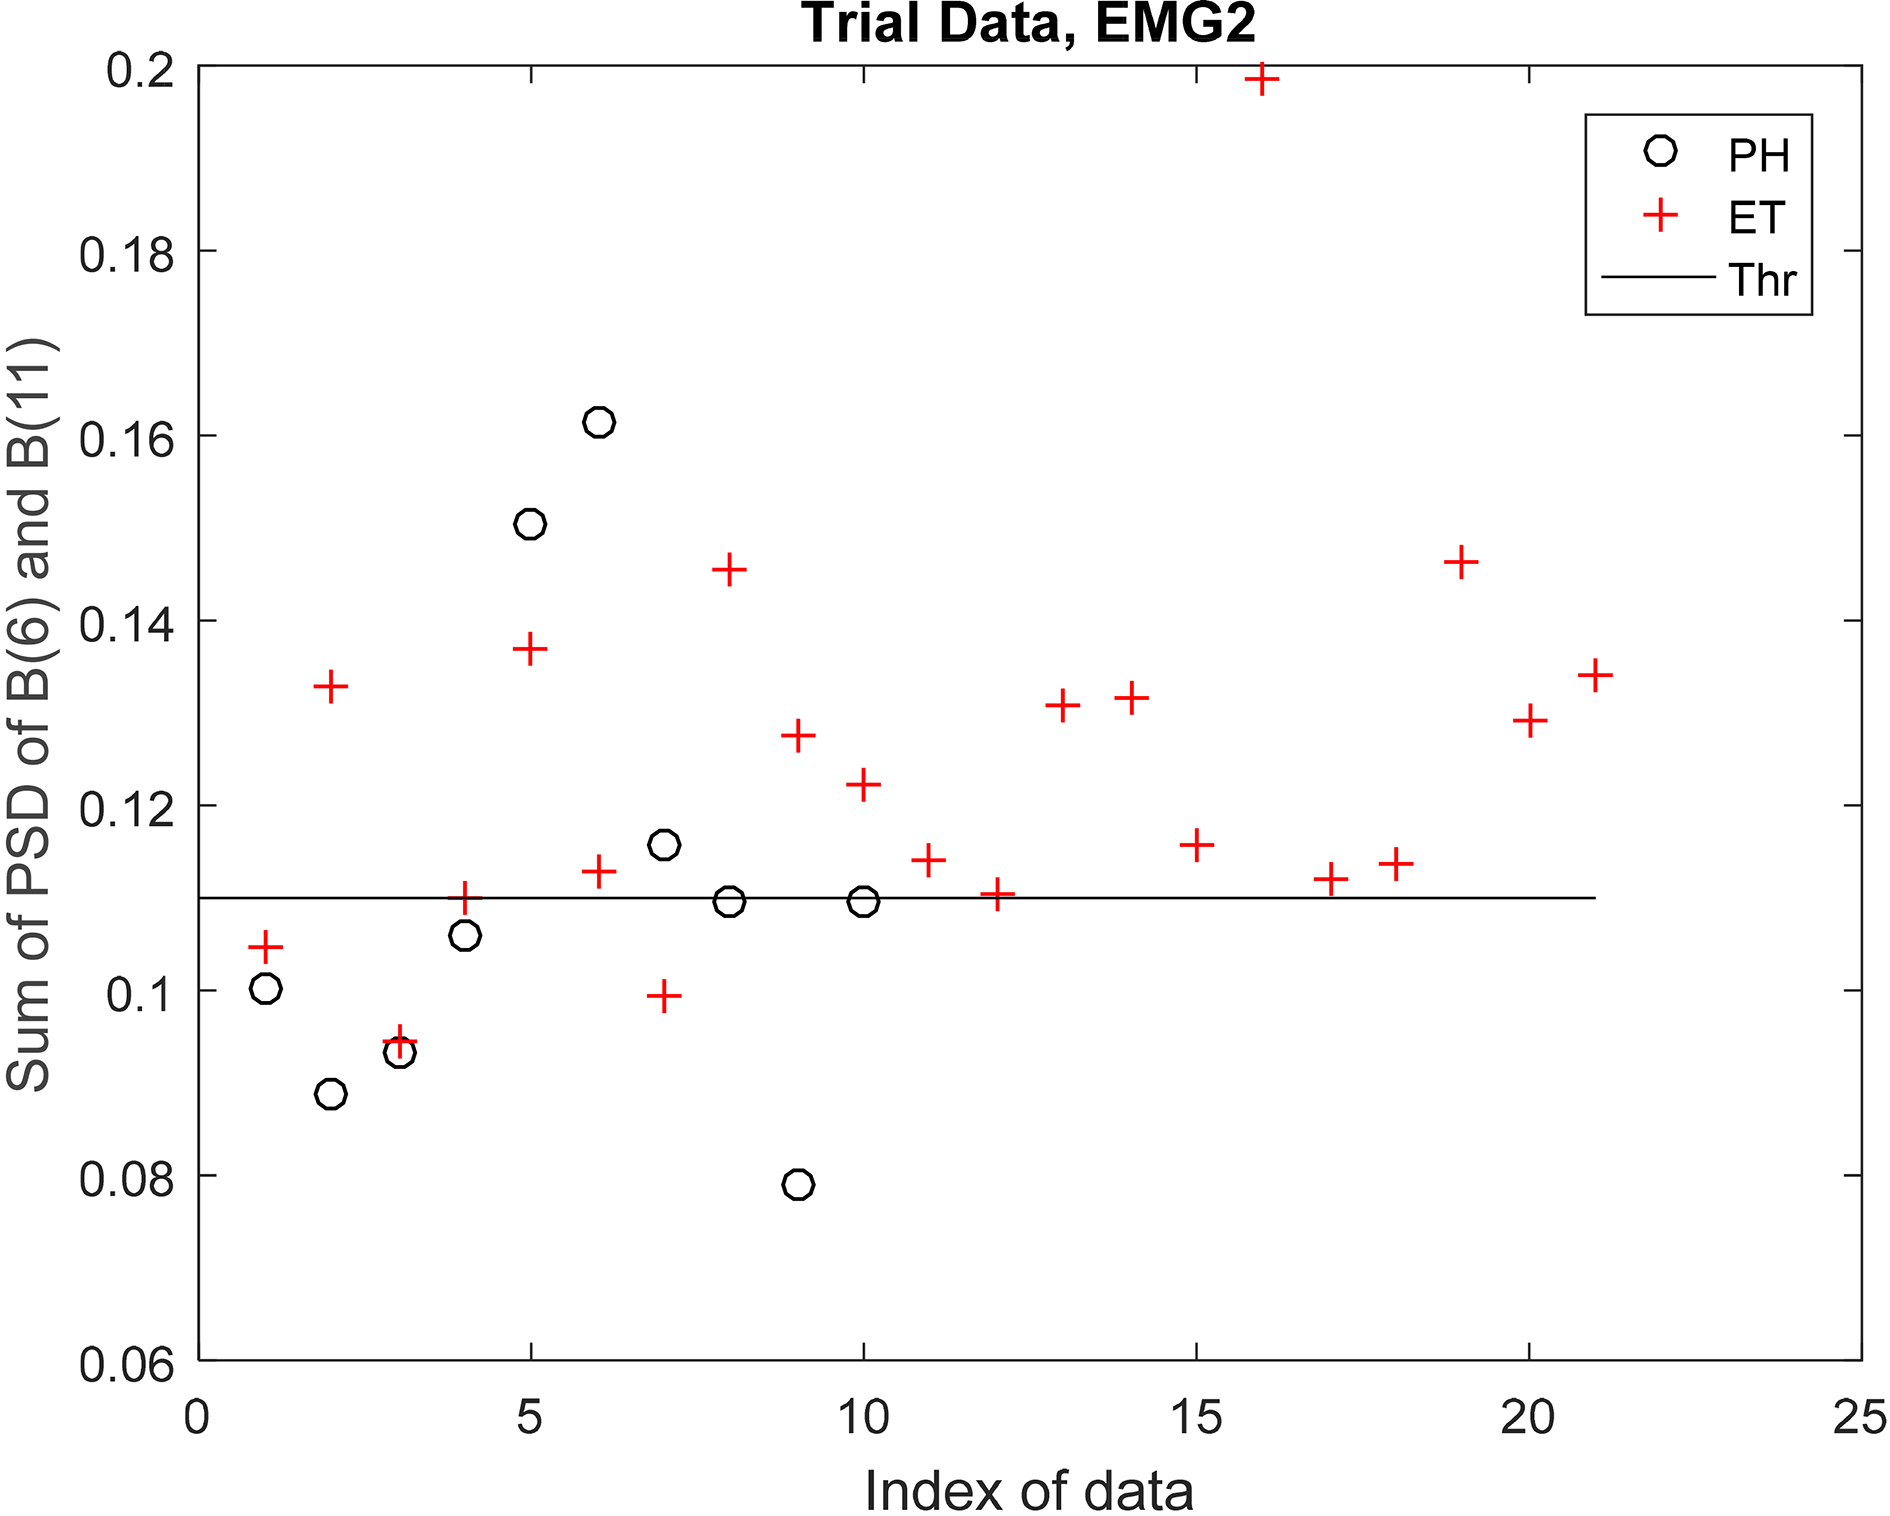
Discrimination between PH and ET in trial data using EMG2 signal.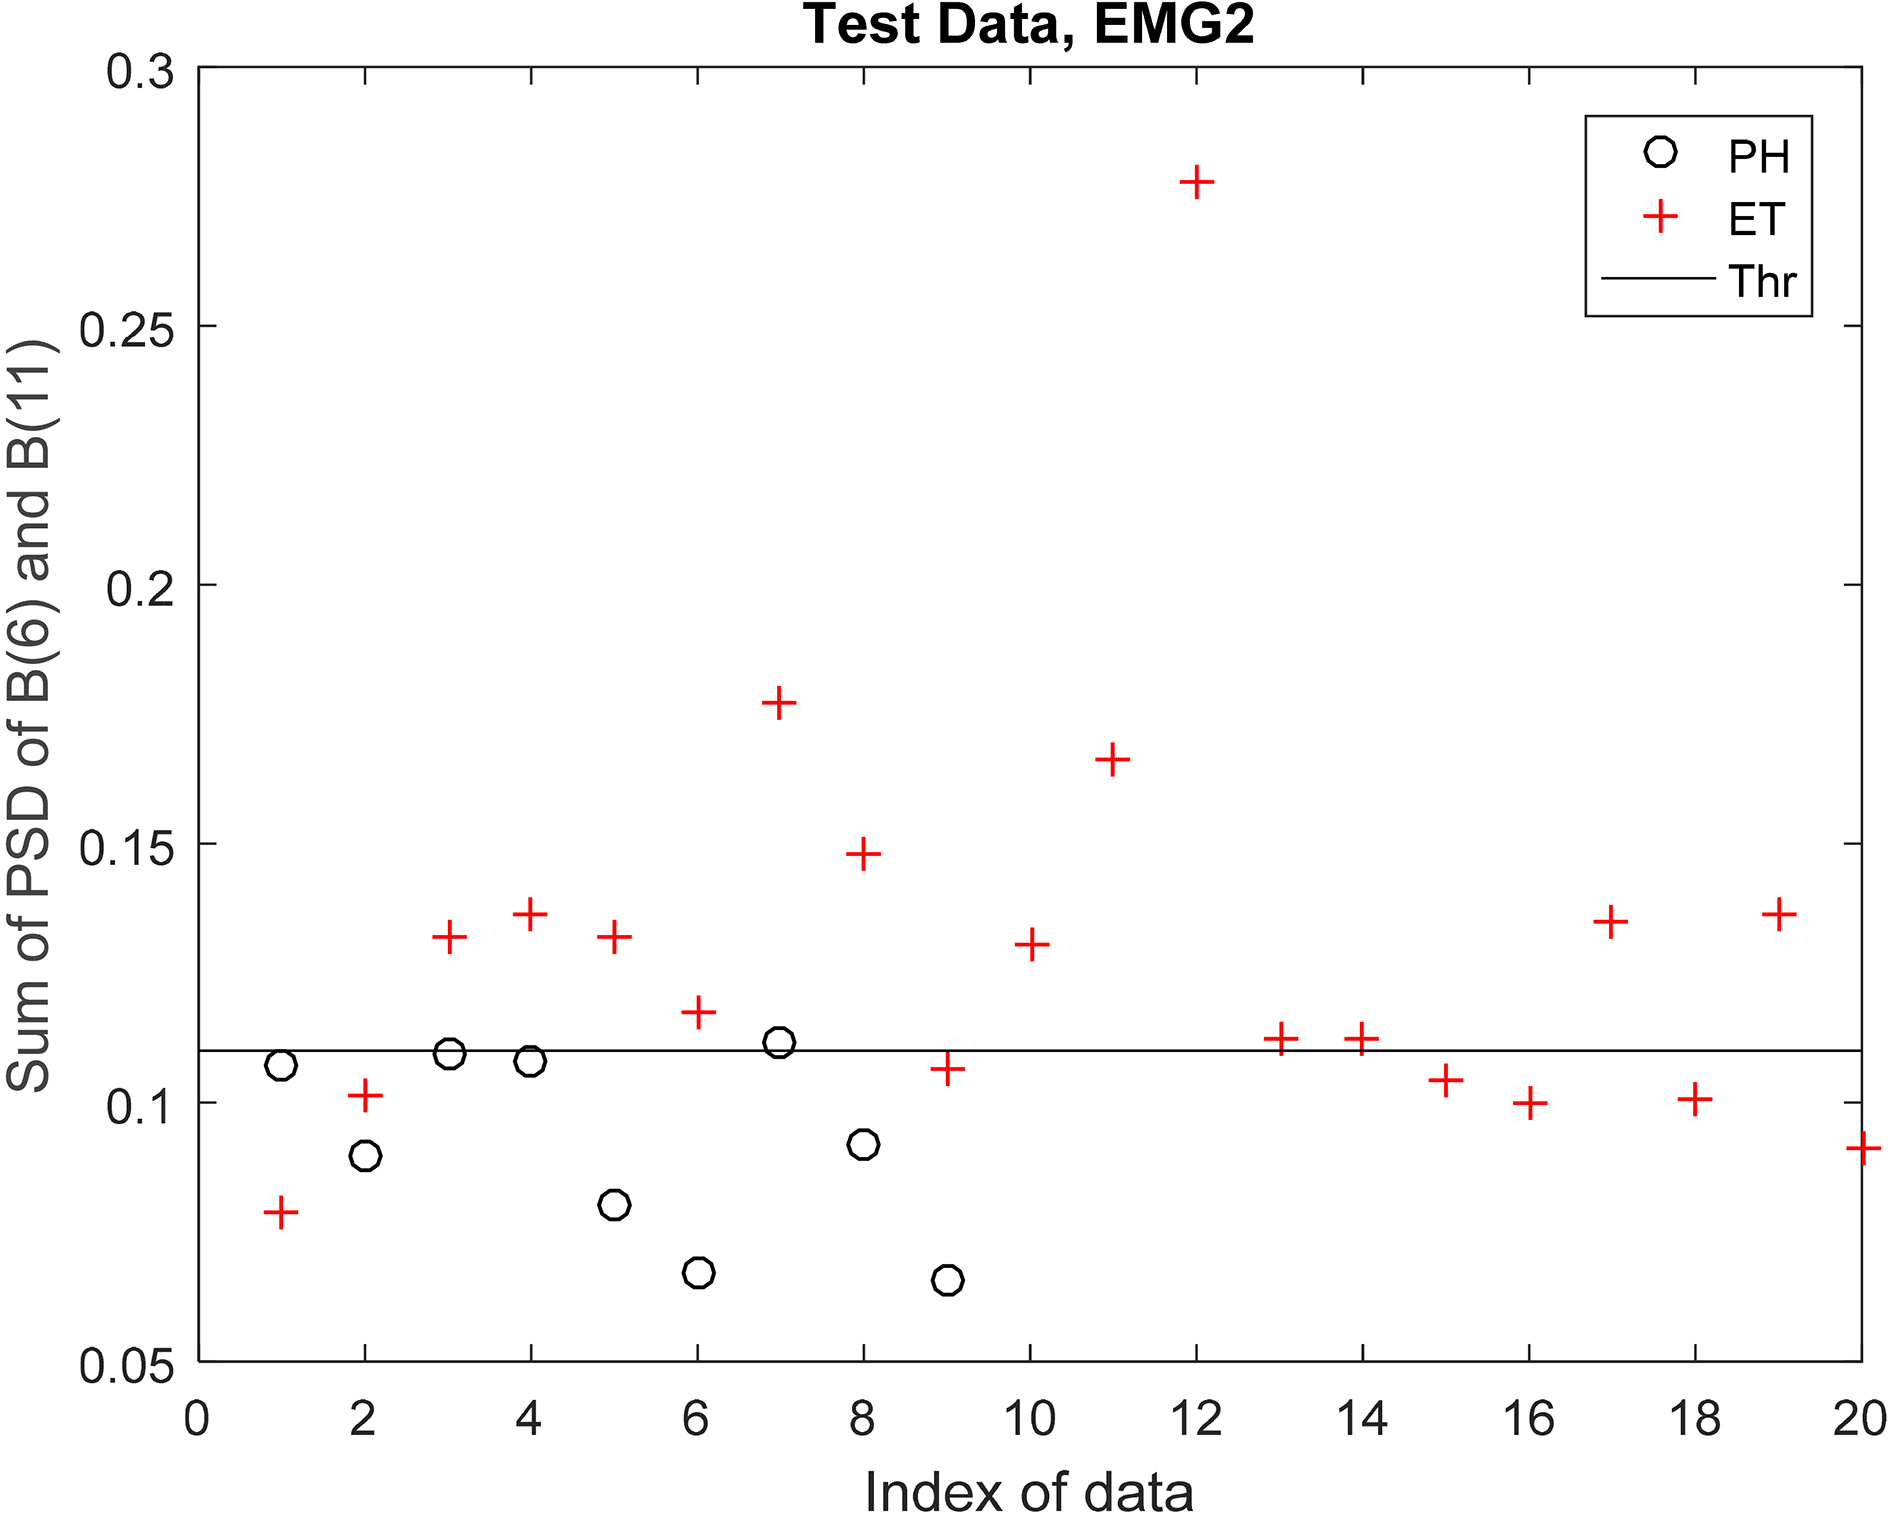
Appendix A.2: Results of discrimination between PH and PD
Discrimination between PH and PD in trial data using EMG1 signal.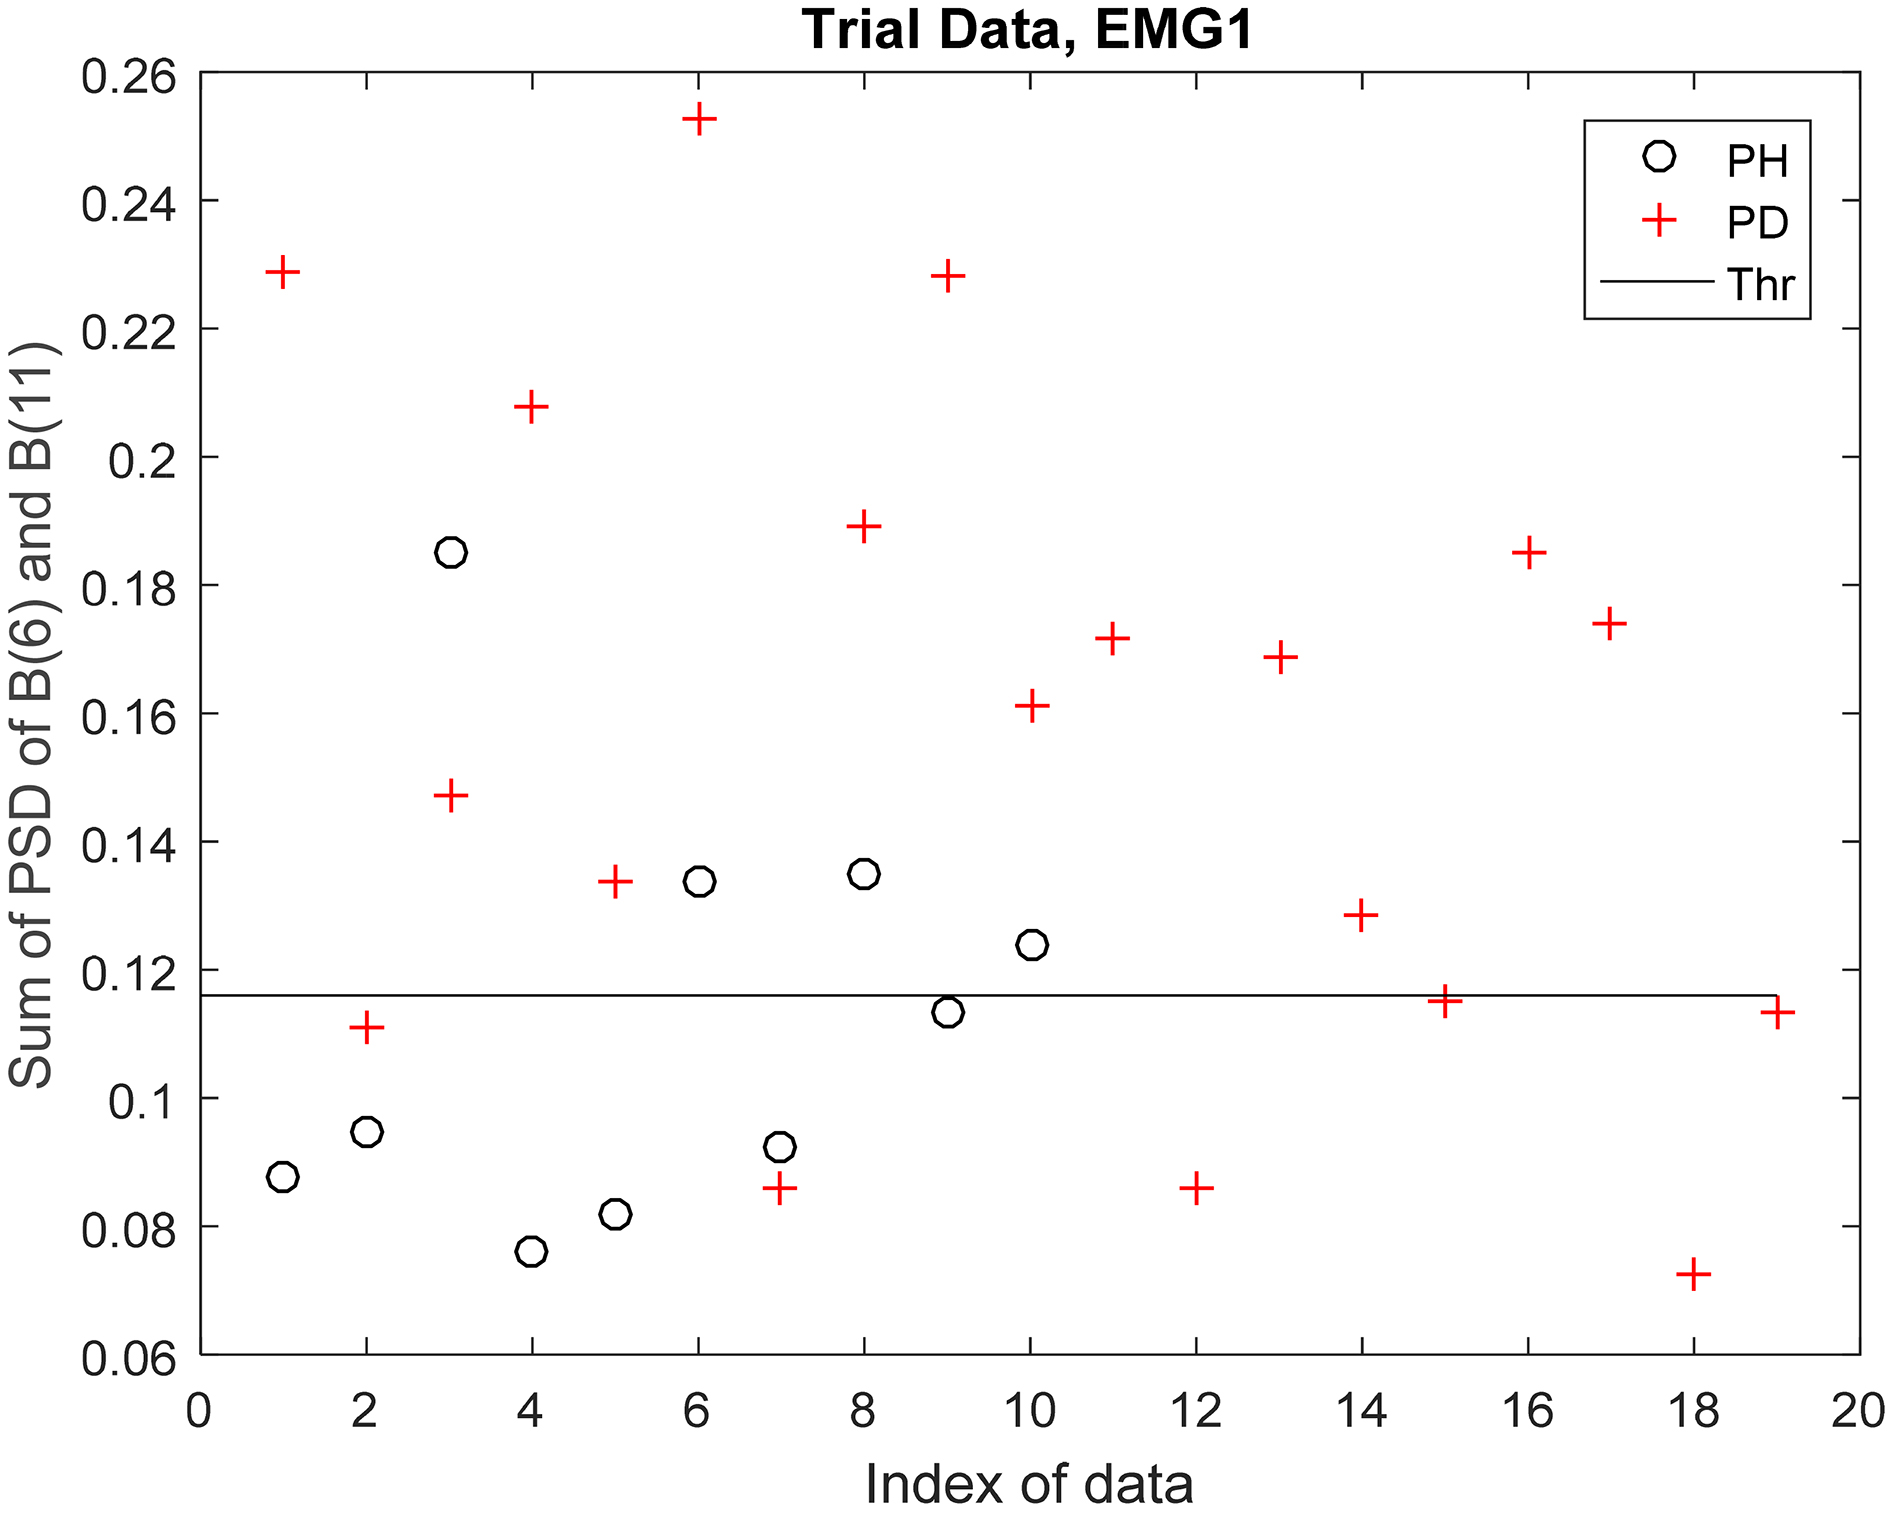
Discrimination between PH and PD in test data using EMG1 signal.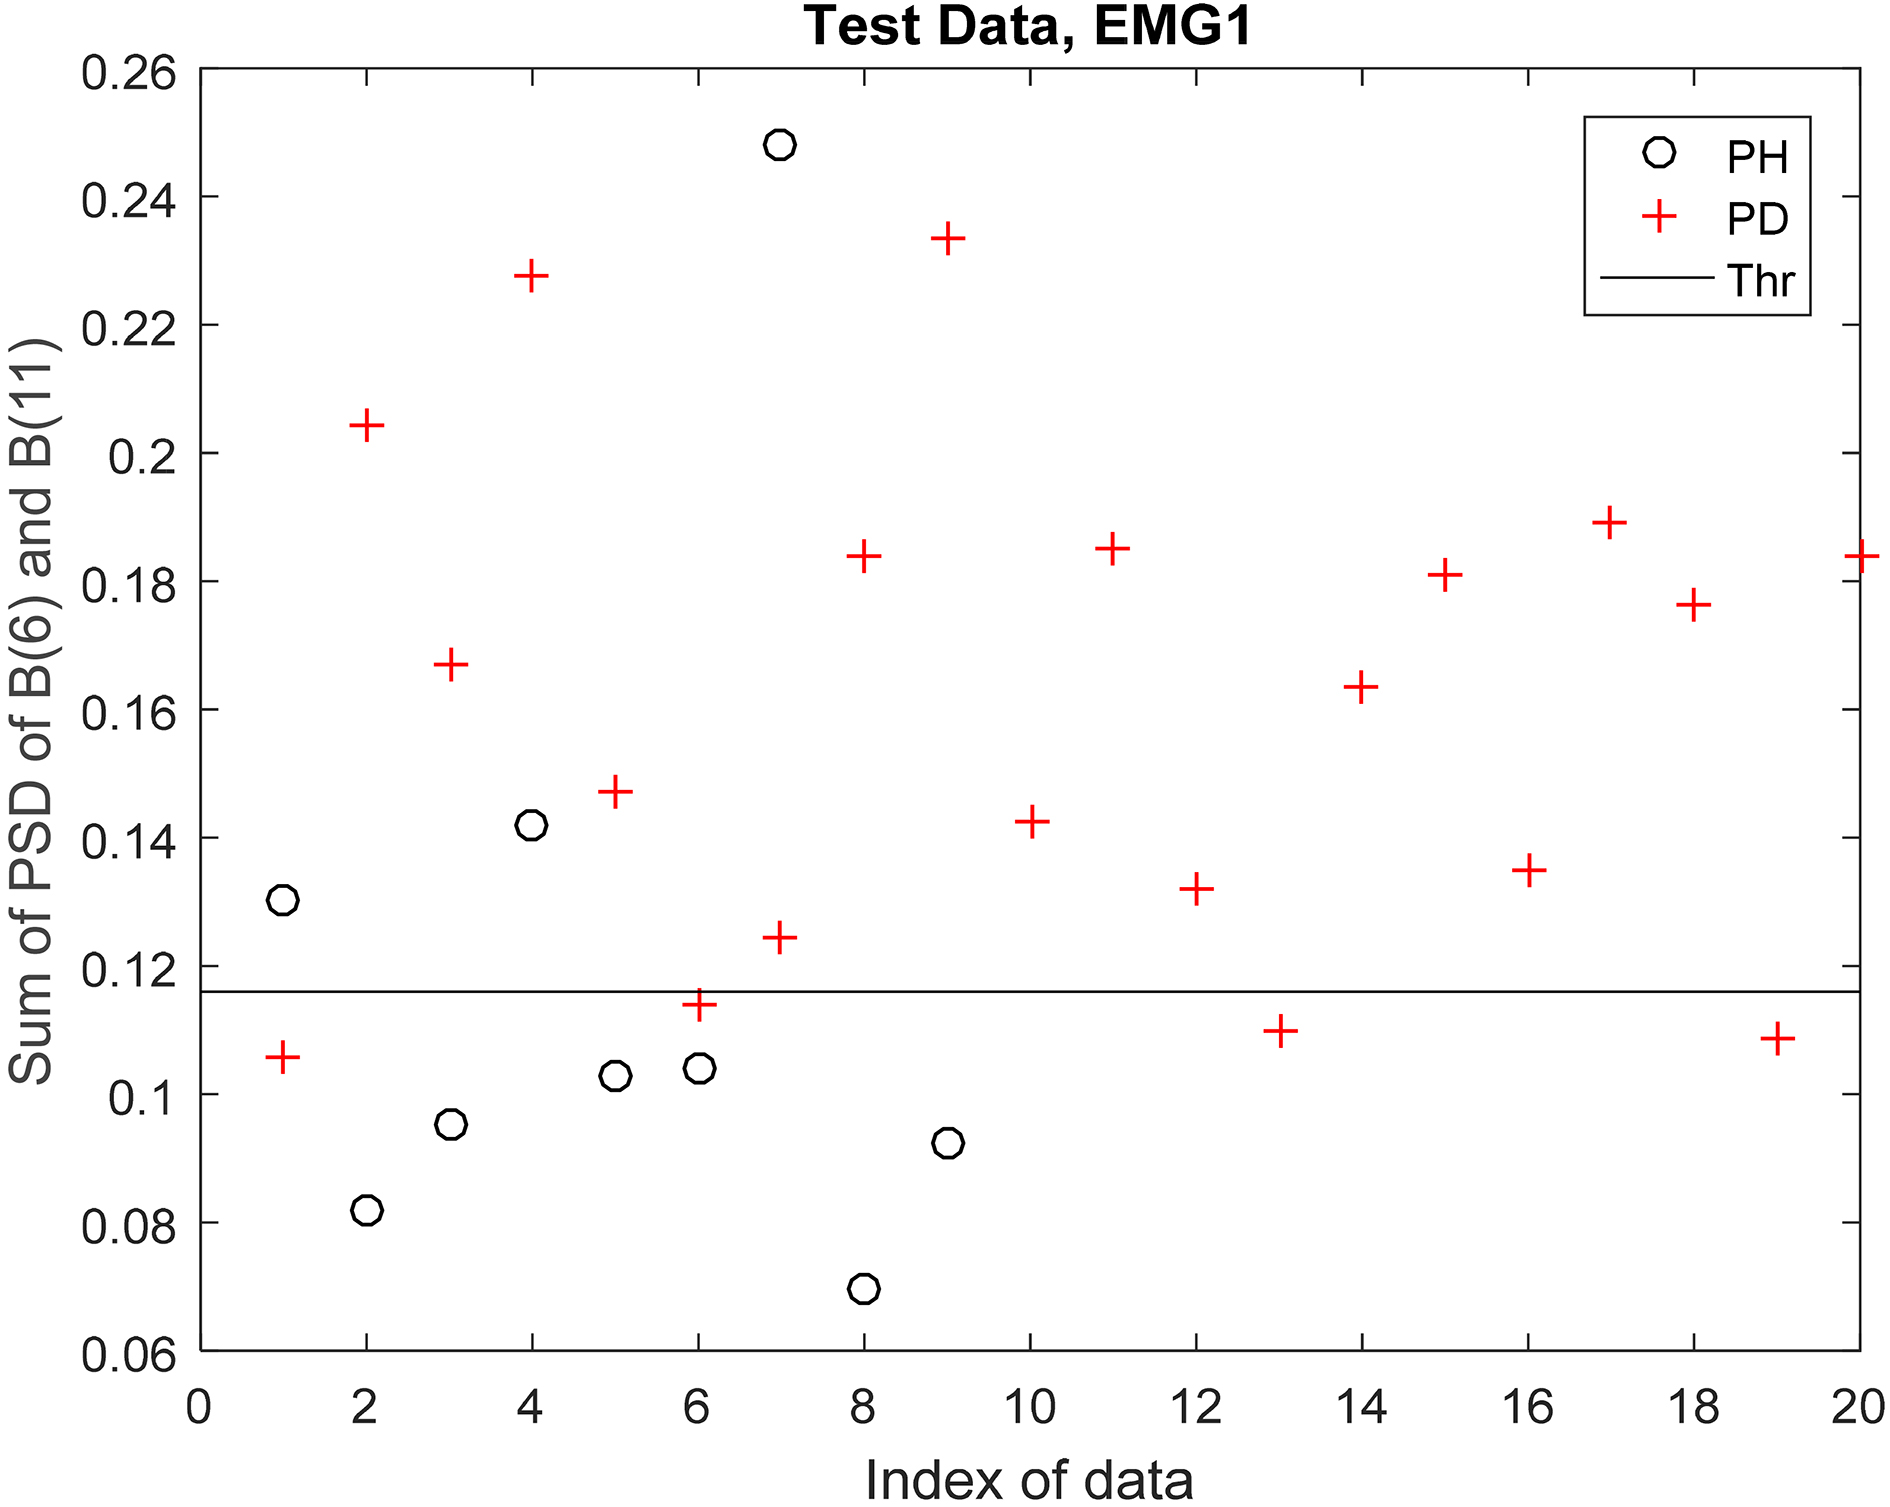
Discrimination between PH and PD in trial data using EMG2 signal.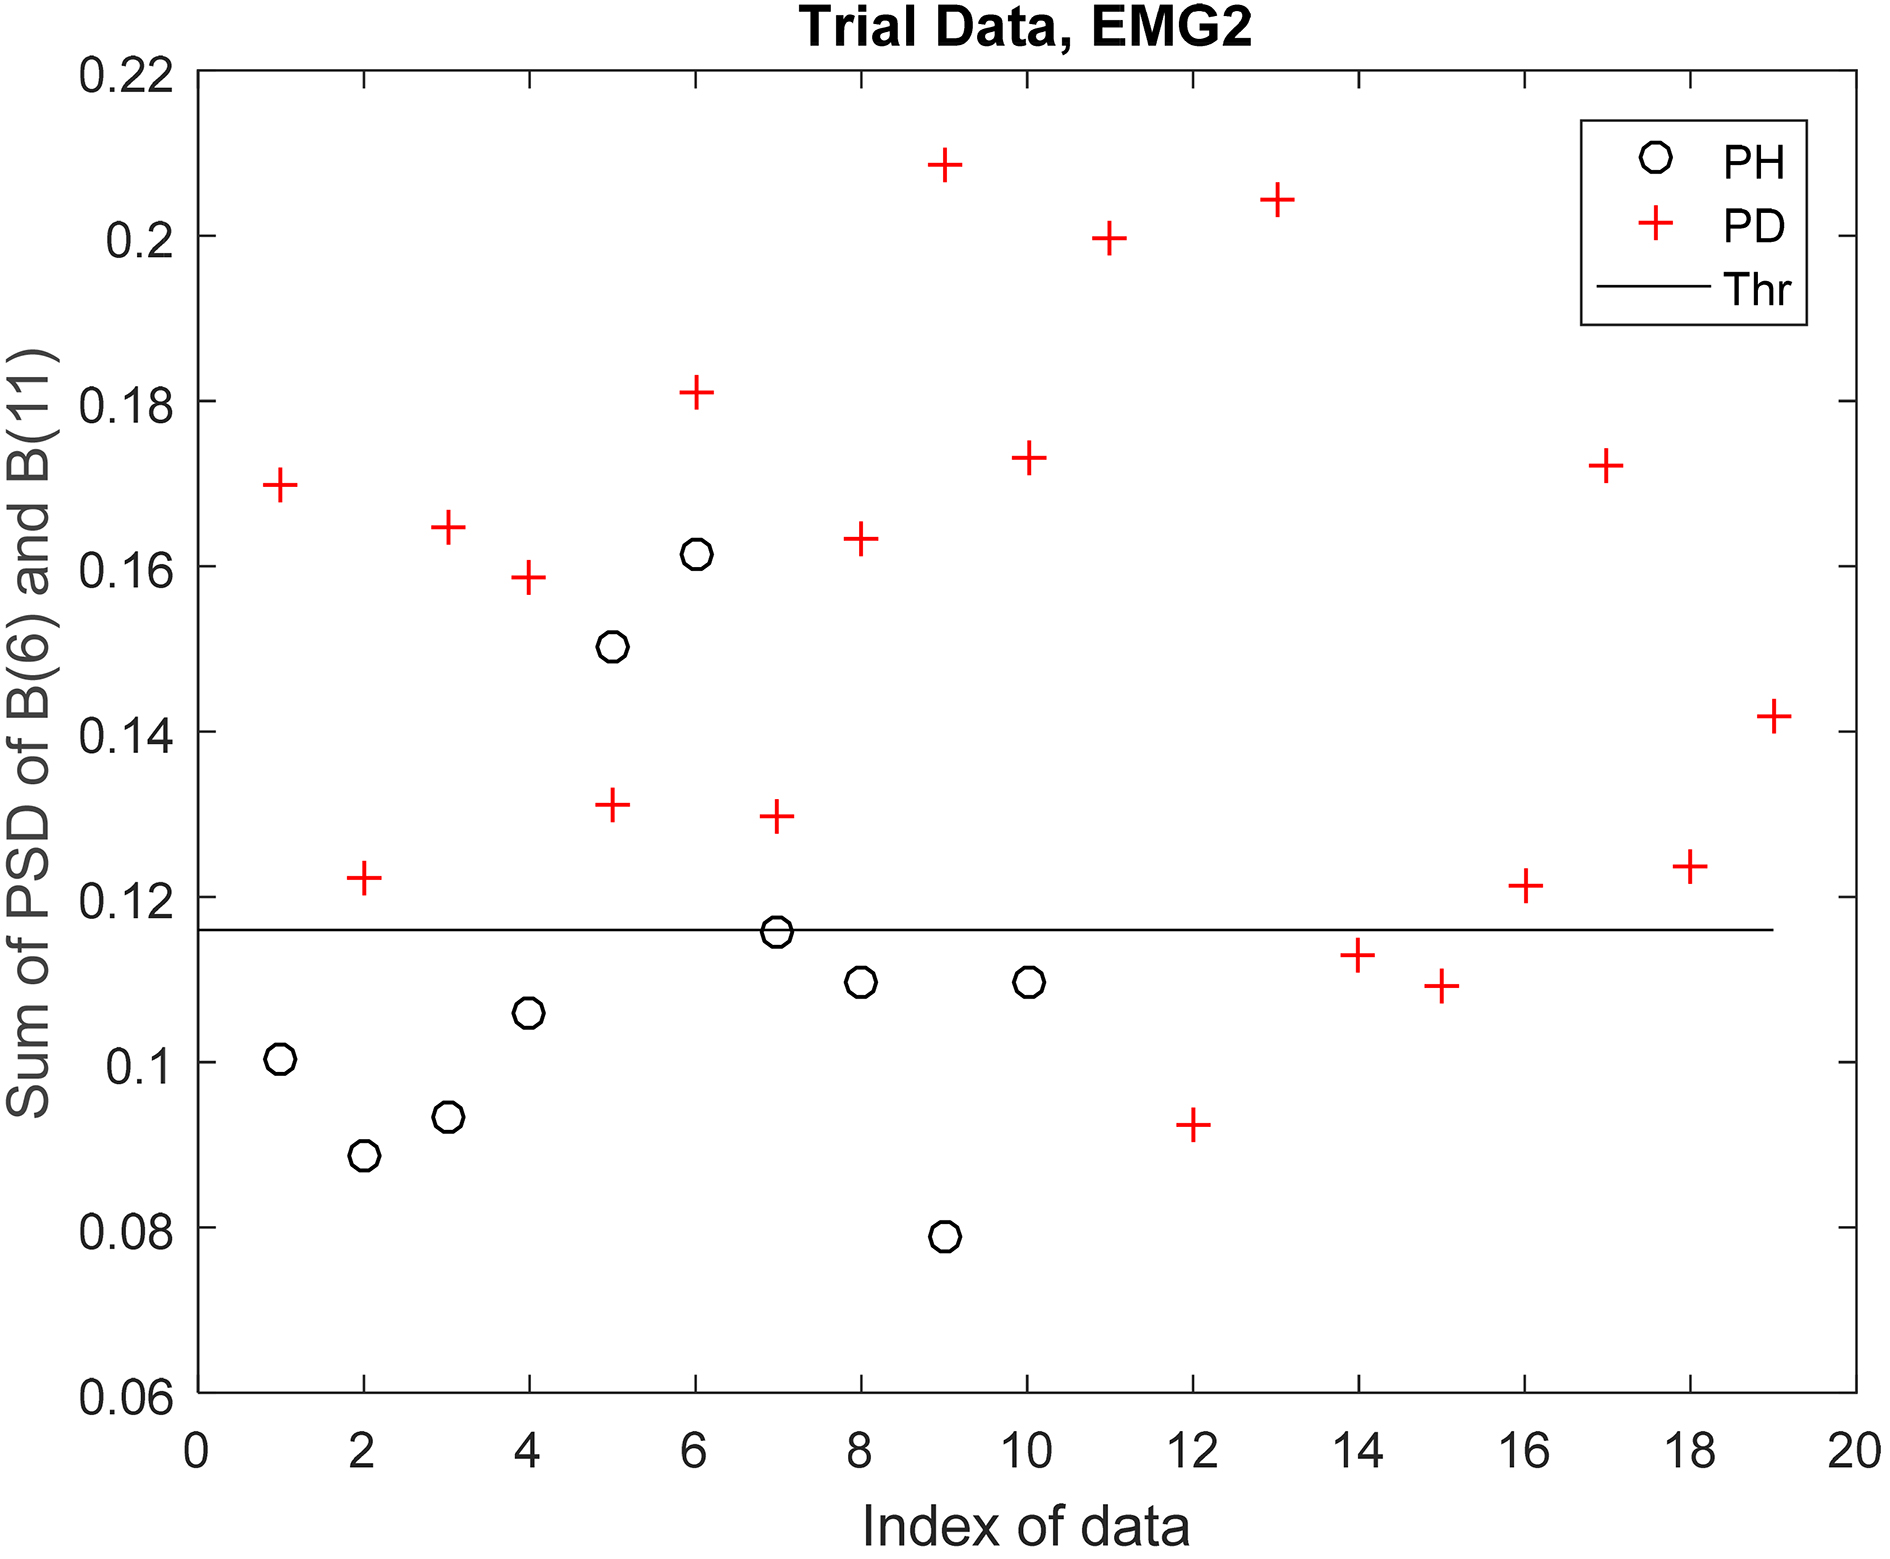
Discrimination between PH and PD in test data using EMG2 signal.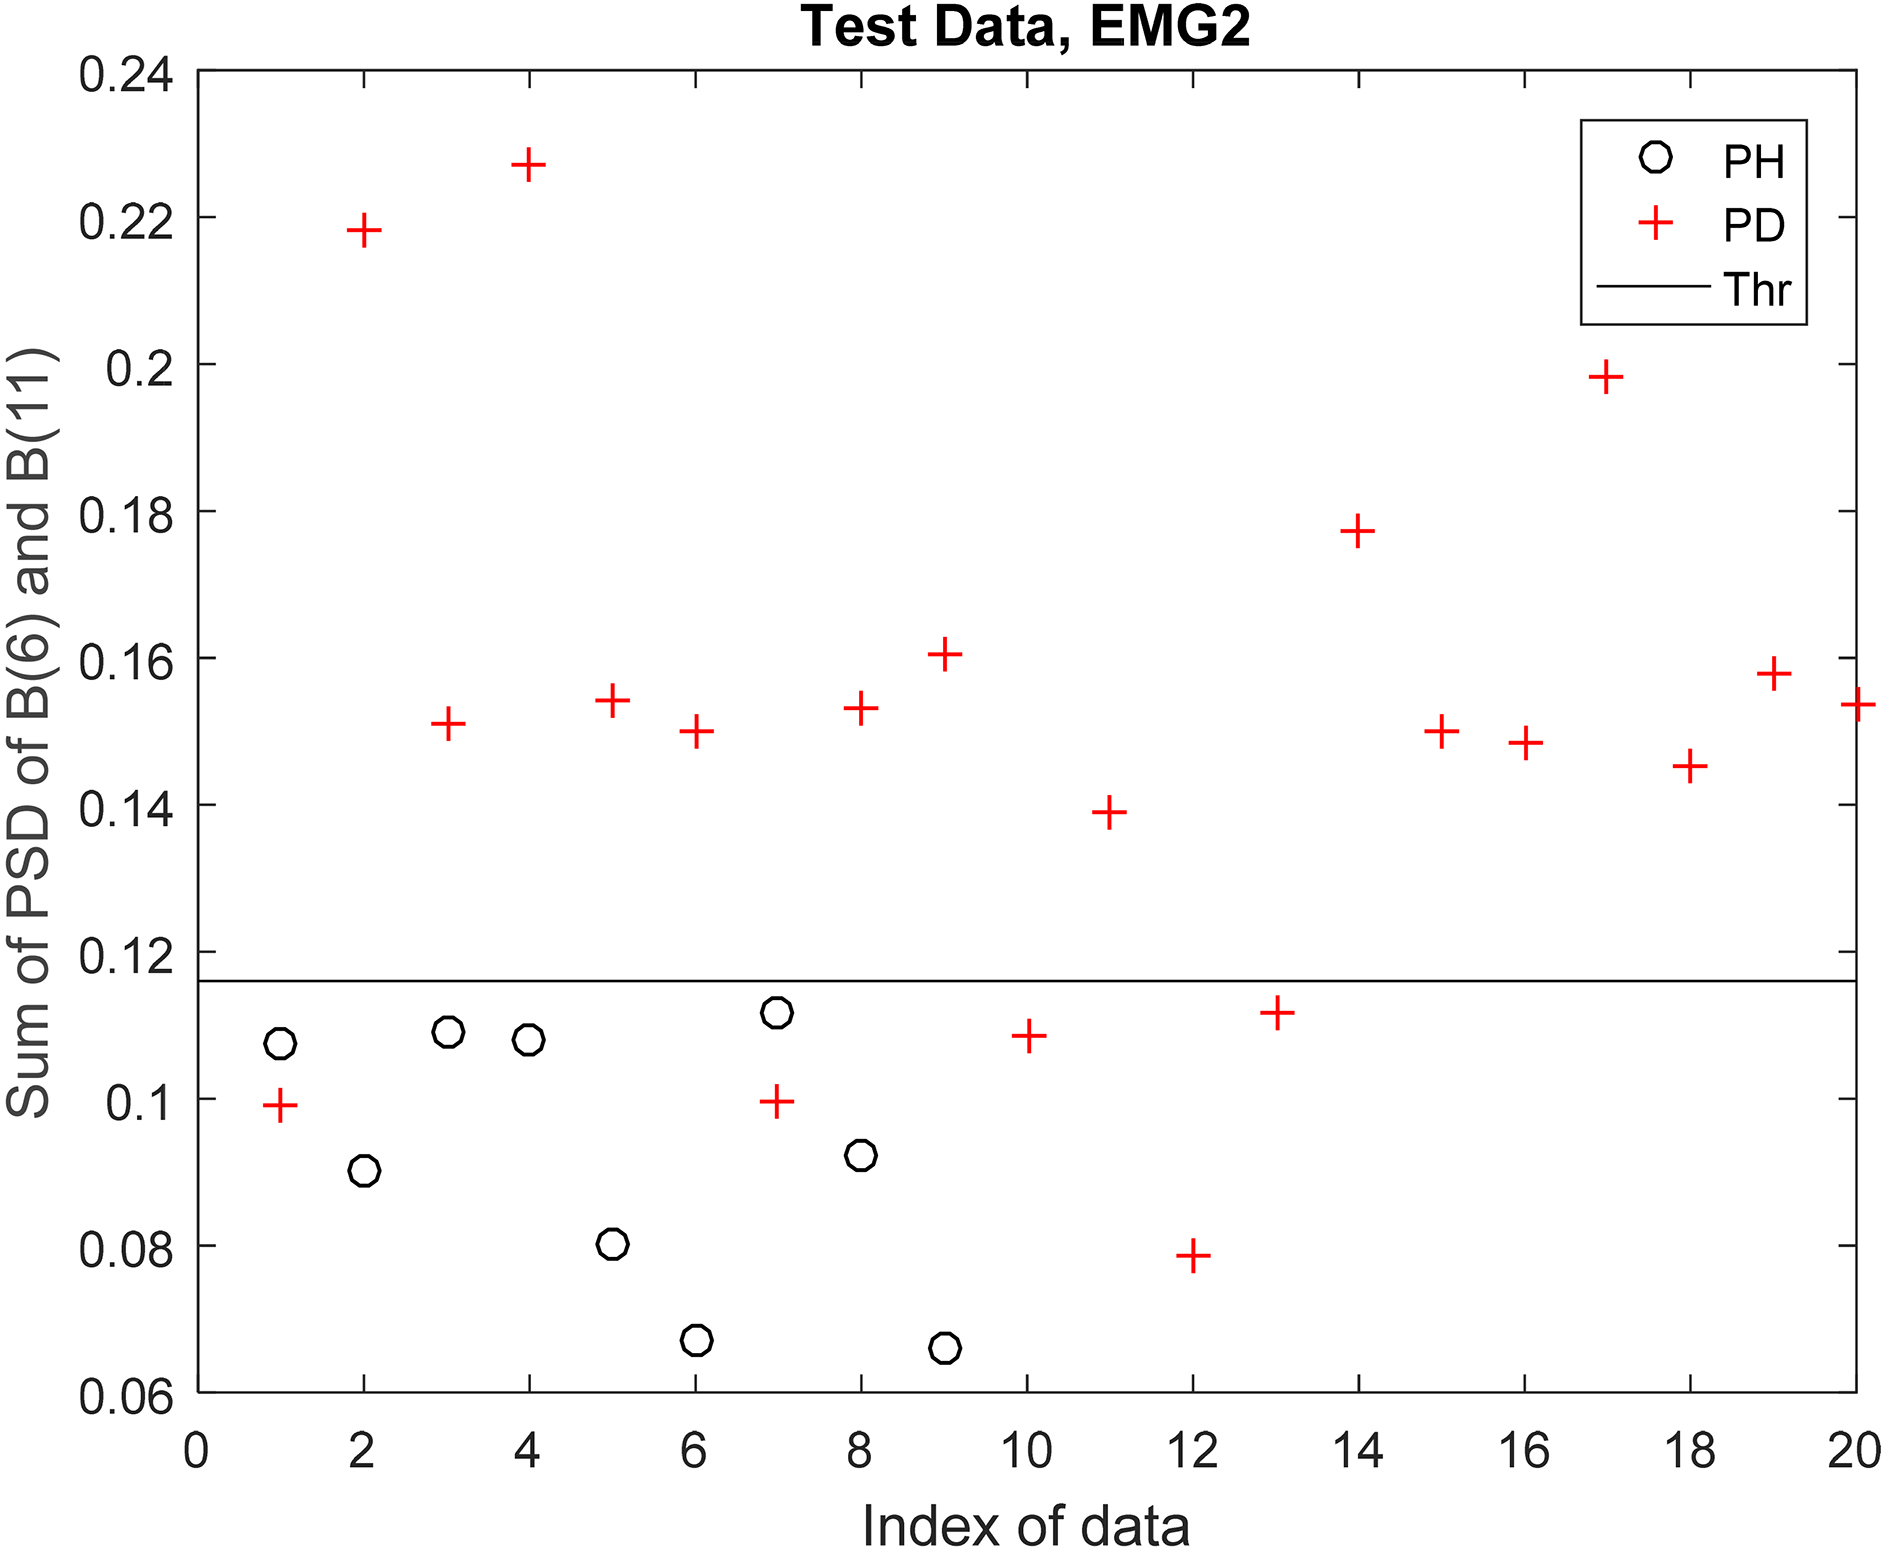
Appendix A.3: Results of discrimination between PH and (PD or ET)
Discrimination between PH and (PD or ET) in trial data using EMG1 signal.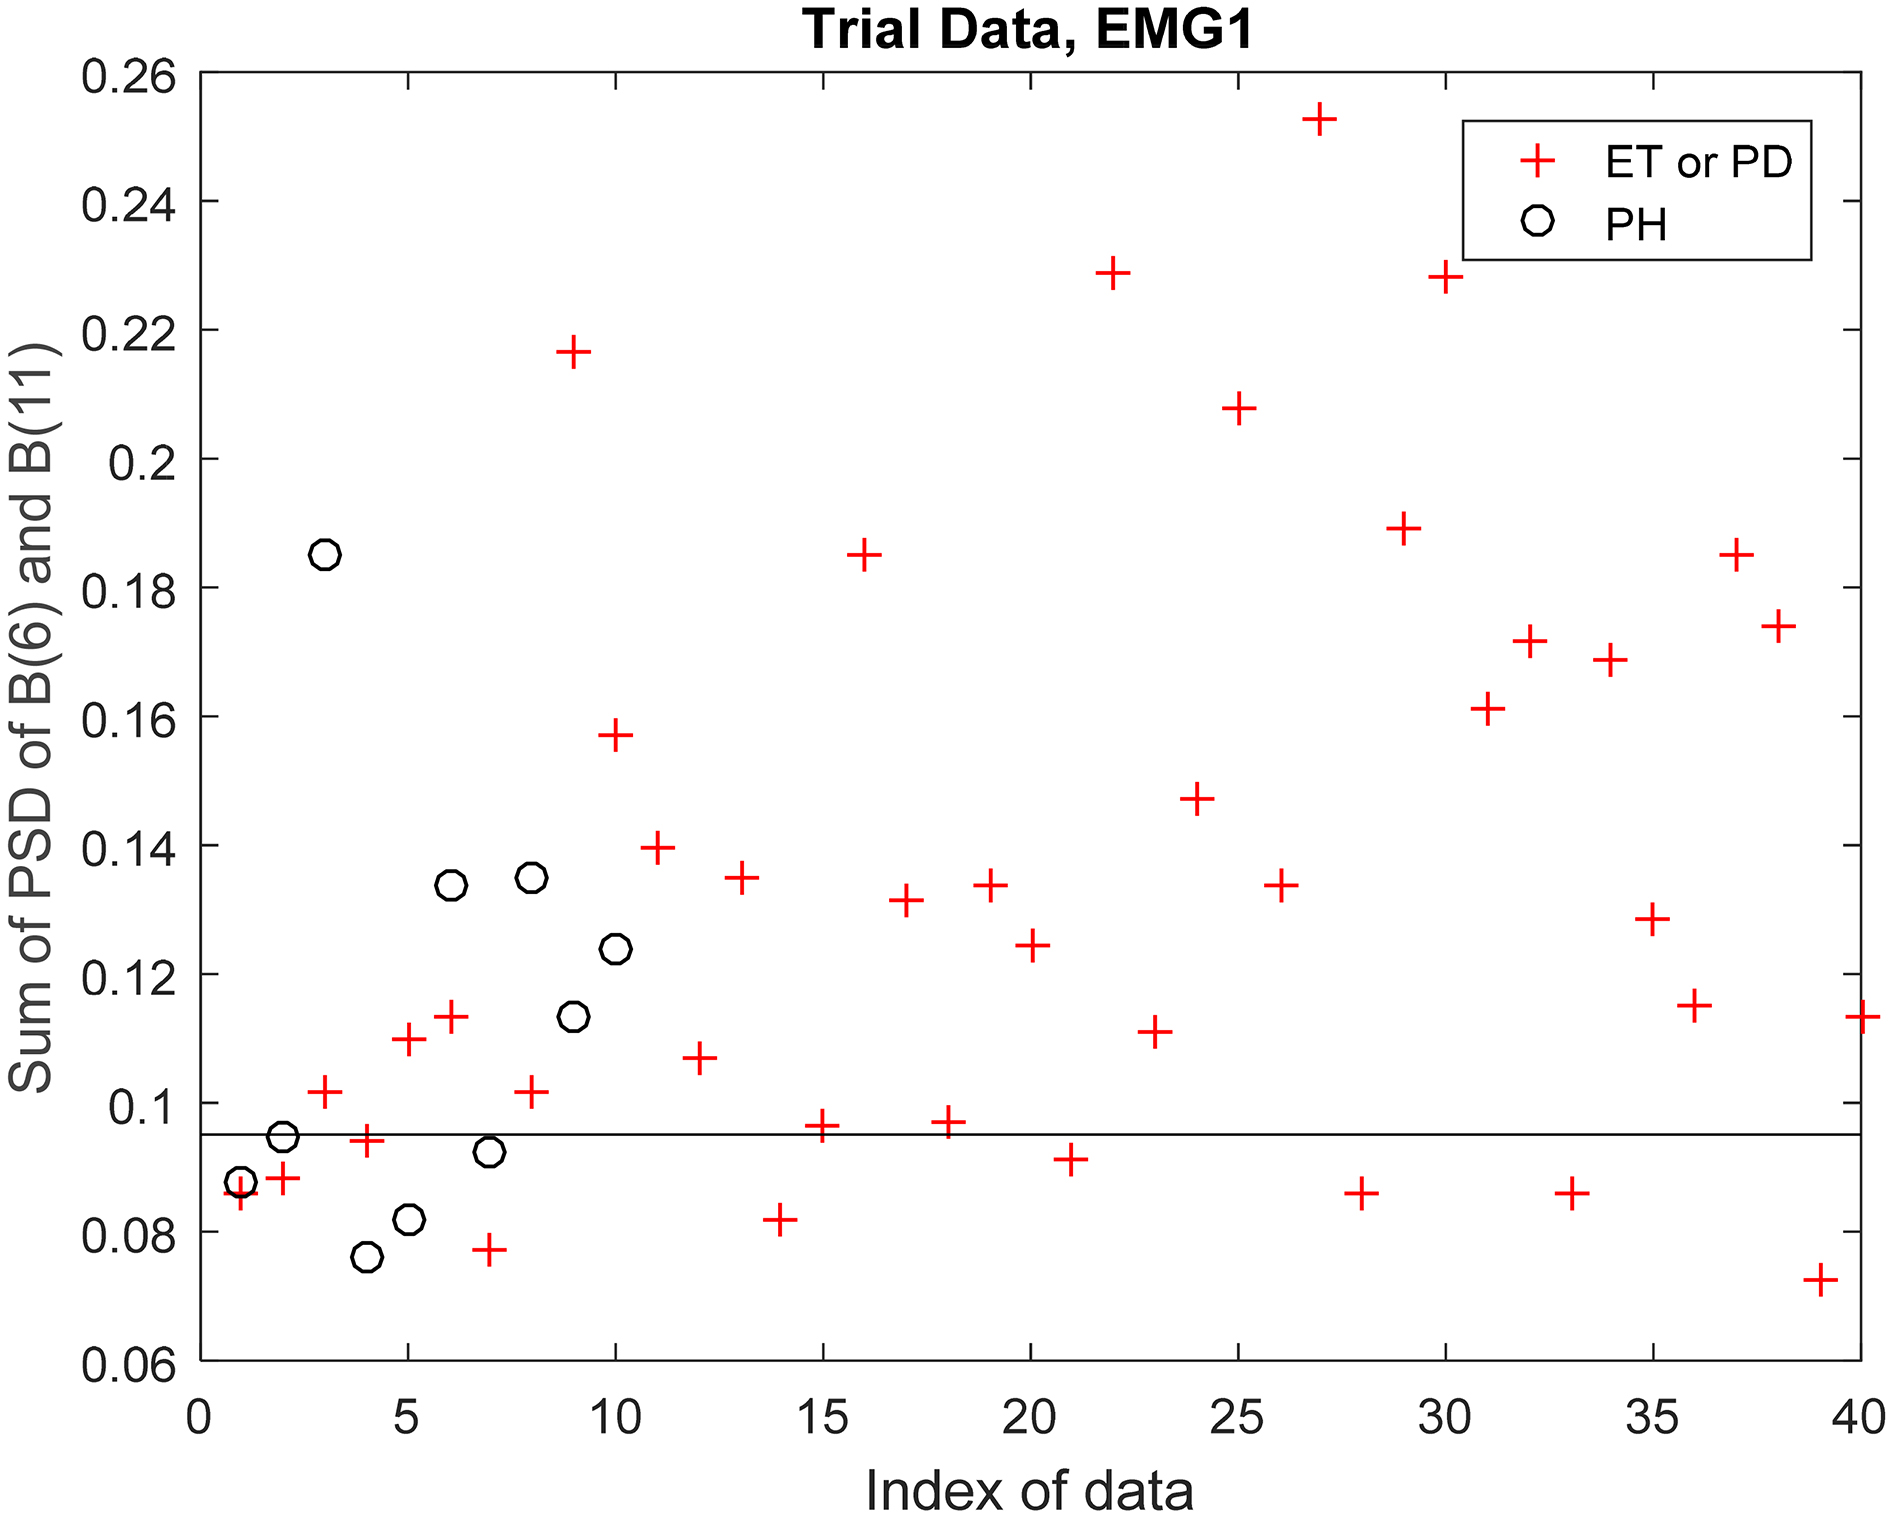
Discrimination between PH and (PD or ET) in test data using EMG1 signal.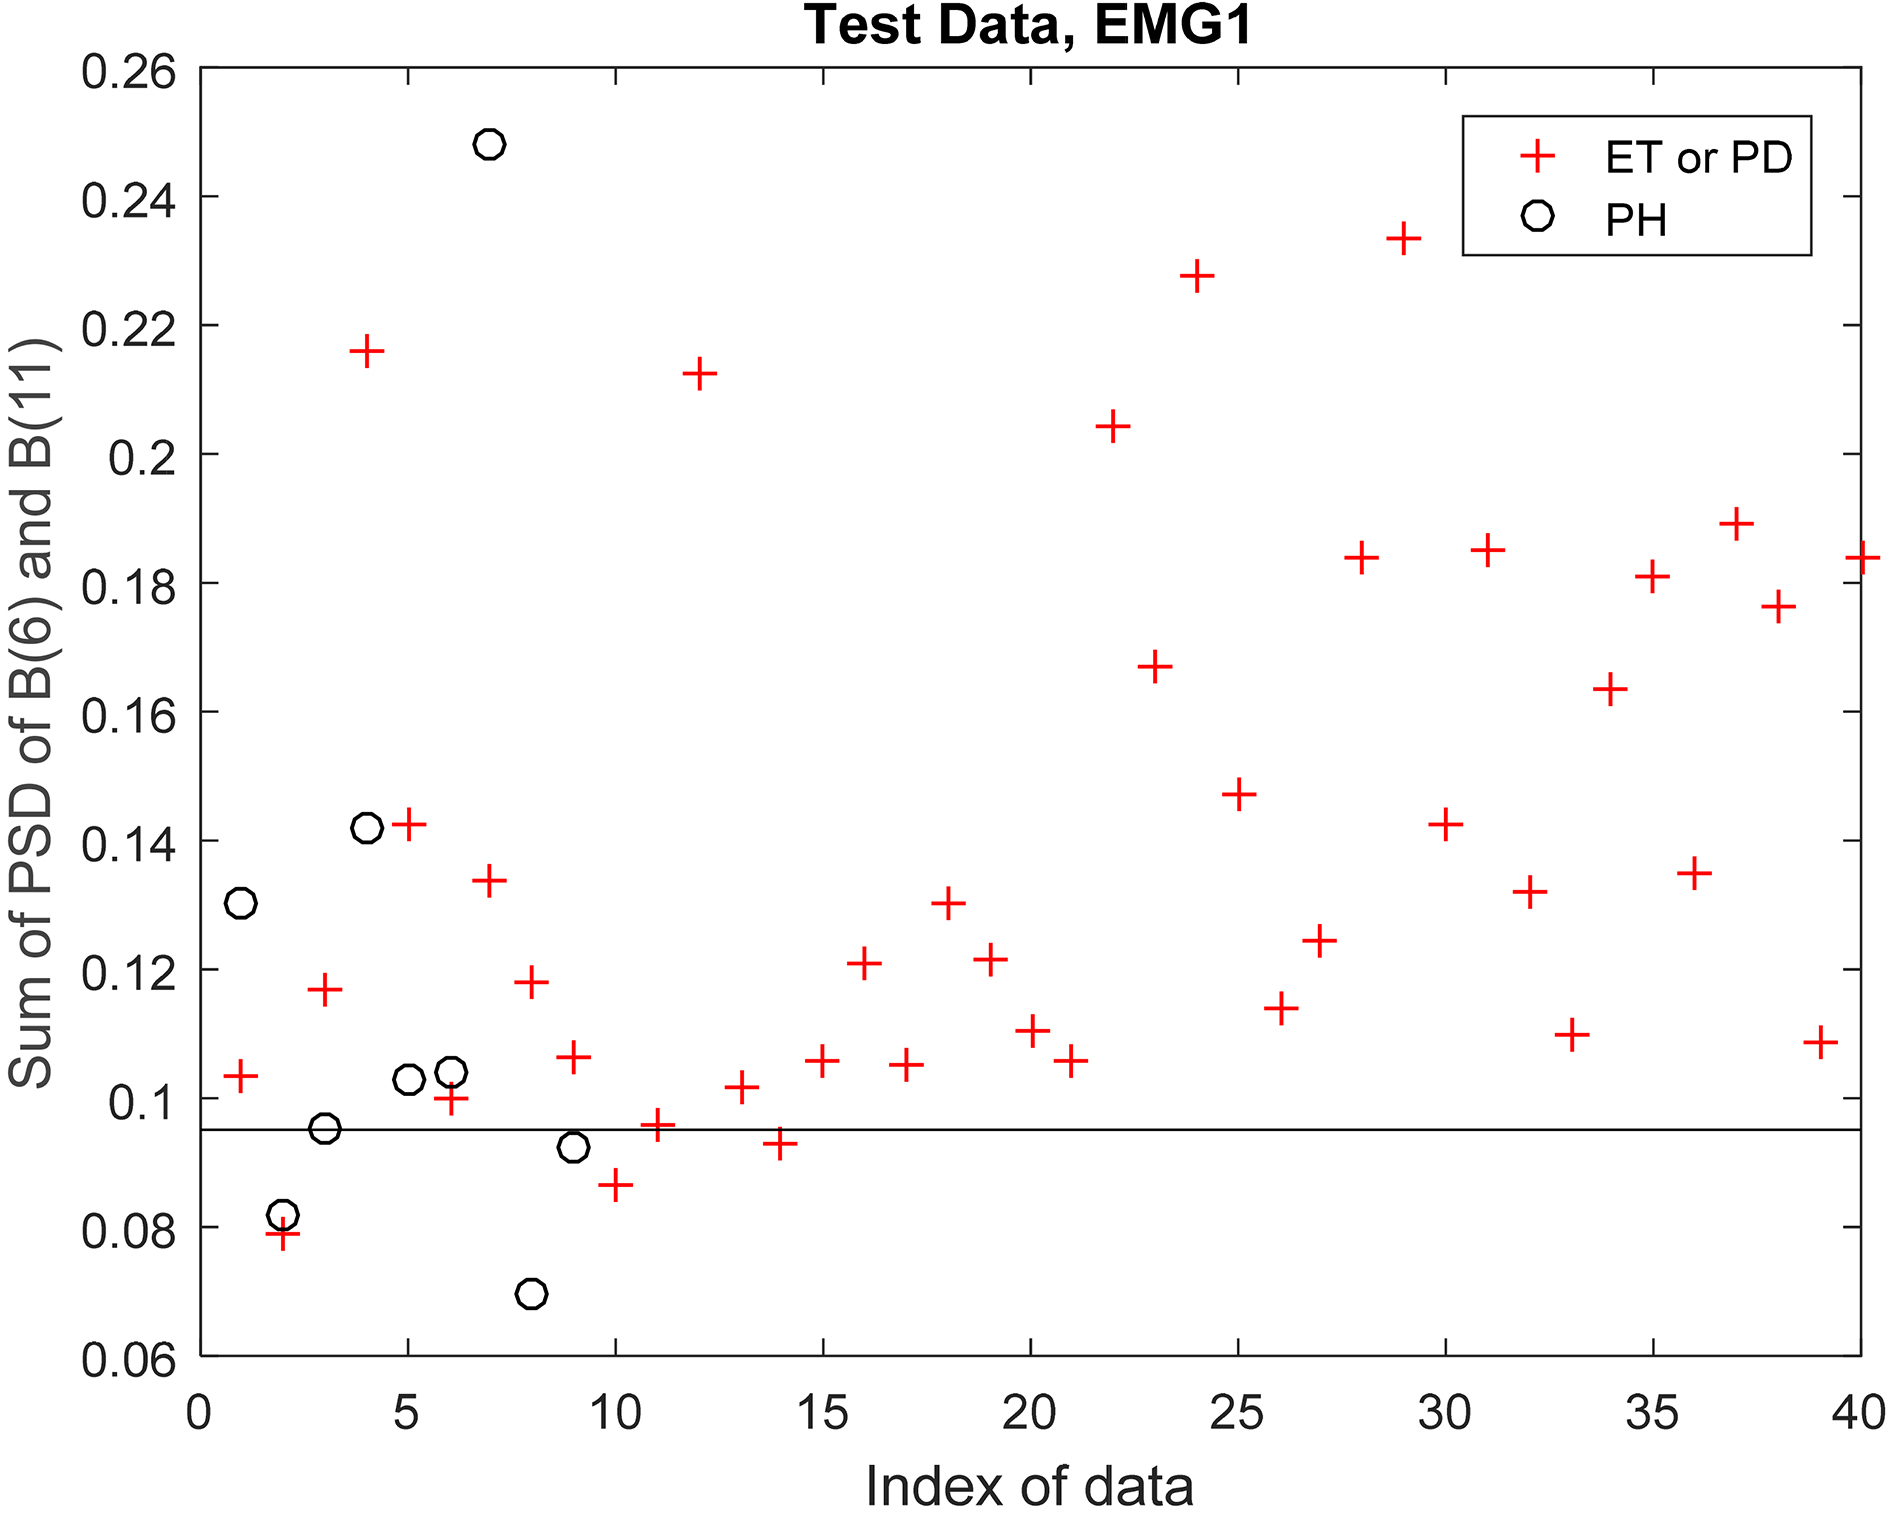
Discrimination between PH and (PD or ET) in trial data using EMG2 signal.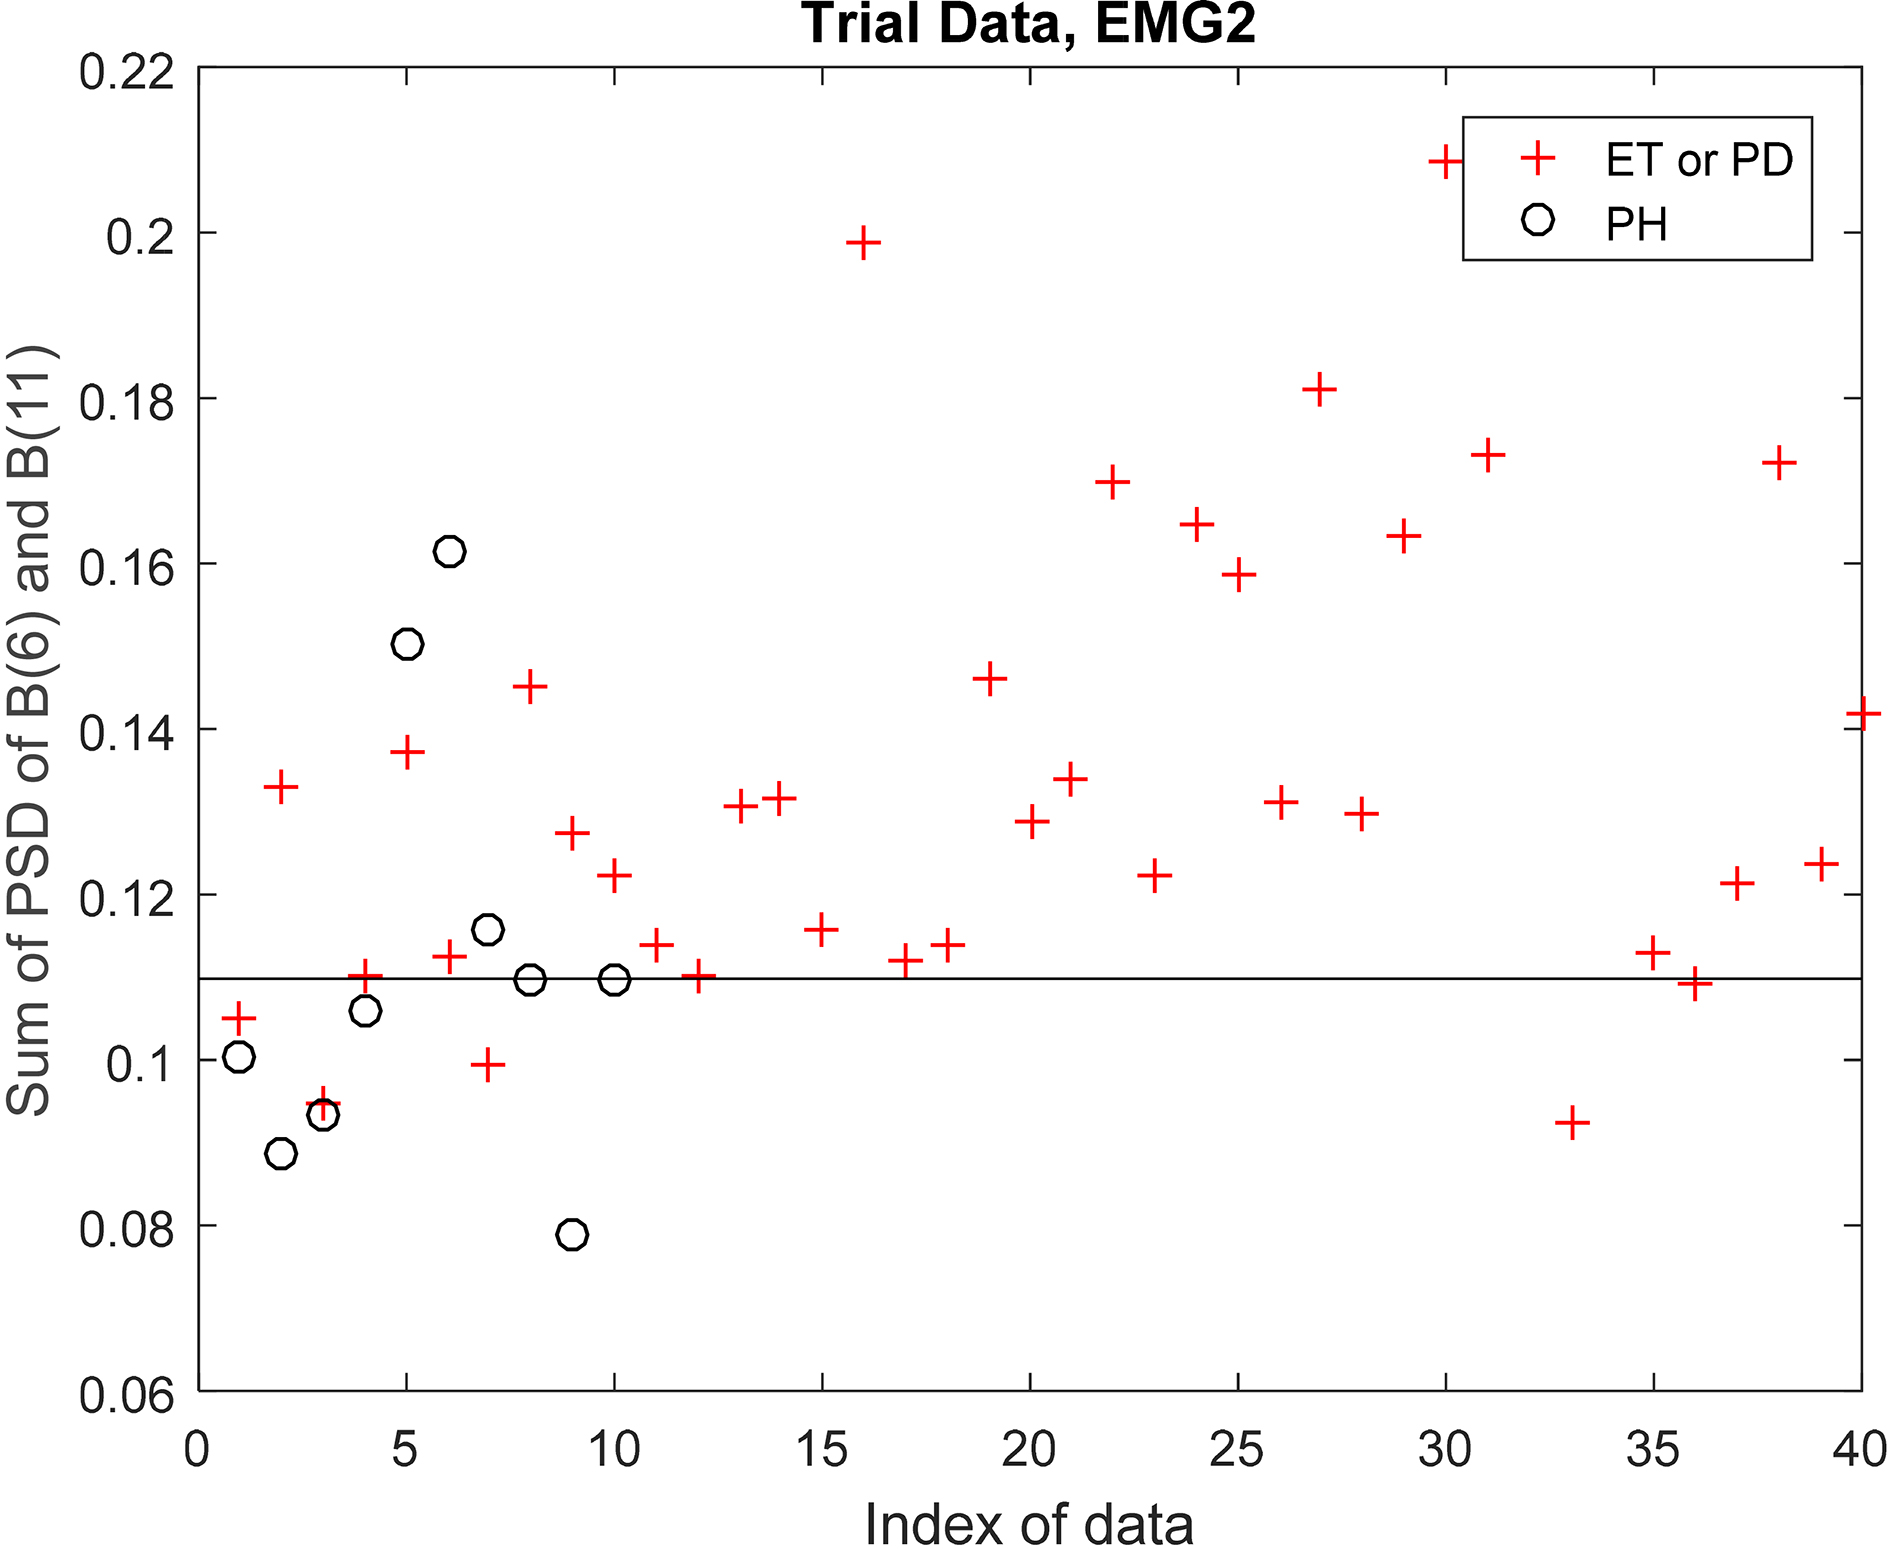
Discrimination between PH and (PD or ET) in test data using EMG2 signal.