
Abstract
BACKGROUND:
Early diagnosis of Alzheimer’s disease (AD) remains challenging. It is speculated that structural atrophy in white matter tracts commences prior to the onset of AD symptoms.
OBJECTIVE:
We hypothesize that disruptions in white matter tract connectivity precedes the onset of AD symptoms and these disruptions could be leveraged for early prediction of AD.
METHODS:
Diffusion tensor images (DTI) from 52 subjects with mild cognitive impairment (MCI) were selected. Subjects were dichotomized into two age and gender matched groups; the MCI-AD group (22 subjects who progressed to develop AD) and the MCI-control group (who did not develop AD). DTI images were anatomically parcellated into 90 distinct regions ROIs followed by tractography methods to obtain different biophysical networks. Features extracted from these networks were used to train predictive algorithms with the objective of discriminating the MCI-AD and MCI-control groups. Model performance and best features are reported.
RESULTS:
Up to 80% prediction accuracy was achieved using a combination of features from the ‘right anterior cingulum’ and ‘right frontal superior medial’. Additionally, local network features were more useful than global in improving the model’s performance.
CONCLUSION:
Connectivity-based characterization of white matter tracts offers potential for early detection of MCI-AD and in the discovery of novel imaging biomarkers.
Keywords
Introduction
Subjects diagnosed with mild cognitive impirement (MCI) are at risk of developing Alzheimer’s Disease (AD) with a disease progression rate of 10%–15% per year (ALZ.org). It is often challenging to predict MCI associated with AD since those affected can often function normally without any noticeable behavioural changes. Additionally, the lack of general consensus on the diagnostic-criteria, risk-factors, causes and the underlying biological mechanisms pertaining to the origin and progression of the disease makes AD a challenging problem [1]. Conventional diagnostic procedures include cognitive testing, genetic screening and identifying atrophies in the hippocampal, cortical and ventricular regions from imaging techniques. Several hypotheses regarding AD onset and progression have been proposed [2, 3]. One particular hypothesis suggests that certain neurological diseases, including AD, spread via specific structural and/or functional brain pathways [4, 5]. Due to advancements in noninvasive neuroimaging techniques, particularly in functional magnetic resonance imaging (fMRI) and diffusion tensor imaging (DTI), it is now possible to investigate such hypotheses [5, 6].
The brain can be viewed as a network of connected regions where each region of interest (ROI) is functionally or structurally connected to other ROI(s) [7]. Several neurological diseases can be modeled as aberrations in connectivity patterns [8, 9, 10] and it is important to relate these aberrations to their corresponding underlying brain abnormalities. Diffusion tensor imaging (DTI) is a neuroimaging modality that measures the direction of water diffusion in tissues to reveal white matter (WM) connectivity [11]. Different physiological maps such as fractional anisotropy (FA), mean diffusivity (MD) and axial diffusivities (AxD,
We propose a connectivity-based approach to predict AD related MCI using DTI images. Our approach utilizes white matter structural connectivity between regions and evaluates the effectiveness of the connectivity parameters to predict progression to AD. This is a data-driven approach where parameters derived from white matter tract networks were used to train pattern recognition models to empirically select a subset of disease-relevant parameters that improve the performance of the pattern recognition models. DTI data from both MCI-AD and MCI-control subjects were used in this study. Different physiological networks and graph-theoretical tools were used to extract local and global network measures [15]. To test the effectiveness of the measures, they were used to train supervised machine learning (ML) algorithms and the algorithms were evaluated for their efficiency in distinguishing the two classes (MCI-AD vs. MCI-control) using a ten-fold cross validation technique. The subset of features and the computational models that were most effective in discriminating the two classes were determined empirically and are reported.
Materials and methods
Data acquisition and pre-processing
All data was acquired from the ADNI (Alzheimer’s disease neuroimaging initiative) database which is an initiative for the discovery of biomarkers for AD [16]. Fifty-two subjects were included in the study. The subjects were divided into two groups; MCI-AD and MCI-control. The MCI-AD group included 22 subjects with MCI who eventually progressed to develop AD. The MCI-control group included 30 subjects with MCI, but did not develop AD. The age and gender differences are described in Table 1. The DTI images for all subjects were obtained from a 3.0 Tesla scanner (GE Medical Systems).
Patient information used in the study
Patient information used in the study
The raw data was converted to the appropriate format and preprocessing steps were performed before analysis (Fig. 1). We followed a protocol described elsewhere [16] and used the software tool ExploreDTI for analyzing the DTI images.
Pre-processing data pipeline from raw data to the extraction of the connectivity matrices.
Standard pre-processing procedures such as eddy current correction, echo-planar imaging susceptibility correction and head motion artifact correction were performed [17]. After correcting for artifacts, a deterministic fiber tractography algorithm [18] was used to reconstruct the white matter tracts for the whole brain. An automated atlas-based template (AAL), consisting of 90 regions of interest, was used to parcellate the regions and the inter-nodal tracts only for these regions were considered.
Several physiological networks for each patient was extracted (Fig. 2). Each network can be described as a connectivity matrix (CM) and CM
The adjacency matrices of connectivity networks of various physiological parameters (Number of tracts between ROIs, fractional anisotropy, mean diffusivity, axial diffusivity, 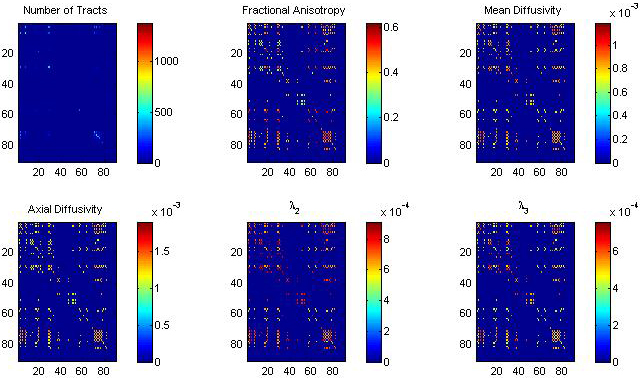
We considered the following physiological parameters between ROIs in our study; (a) fiber count (or number of tracts NT) which is an estimate of the number of fibers between the regions (b) fractional anisotropy (FA), which is the degree of anisotropy of the diffusion process of water molecules in the tracts (c) axial diffusivity (AxD),
Three types of measures are used as features in this study; global, nodal (or local) and inter-nodal. A local measure is a metric that pertains to a specific ROI. One local measure commonly used in brain studies is the clustering coefficient [19]. The clustering coefficient of a specific ROI (
where,
A global measure is a non-specific metric of the network as a whole. Two global measures; global clustering coefficient and global efficiency are used in this study. The global clustering coefficient of the network ‘
Thus, for each network, we have one global clustering coefficient and 90 ROI clustering coefficients. The global efficiency,
where,
Model training and parameters
Details about the classification models, optimization objective and the model parameters are described in this section. First, a class of supervised learning algorithms called decision trees were used. Decision trees split the high-dimensional feature space, based on an optimization objective, into regions that are exclusive to one class label (i.e., MCI-AD or MCI-control). CART is one of the simplest algorithm among these and the optimization objective used in this study is,
which minimizes the misclassification fraction, where
Support Vector Machines (SVM) is a classification model [22], that constructs hyperplanes in high-dimensional feature space to separate the two classes. By using radial Gaussian function, the model can be modified to handle nonlinearity. The kernel used in this study is,
where,
After determining the ROI features that were most effective in improving the model performance, the inter-nodal tract features (totaling 4095) were added sequentially to train the models and their performance evaluated each time. The final subset of features contain parameters that were most effective in the discrimination of subjects. The feature selection scheme that we employ had the following steps. First, only the global efficiencies and the clustering coefficients of each physiological parameter were used. Later, the performance of the predictive accuracy percentage of the model was evaluated using a ten-fold cross-validation protocol. Then, each of the ninety ROI features were added to feature set and the model was evaluated.
Evaluation via ten-fold cross-validation and random permutation of data
A ten-fold fold cross-validation scheme with the random permutation of the data was used to evaluate the performance of the supervised models. In this scheme, the dataset was evenly split into ten partitions and the model is trained using the first nine parts and tested and is validated on the tenth partition. This process is repeated ten times such that each partition will be used to both training and cross validation. It was also noted that the random permutation of data prior to ten-fold cross validation resulted in differences in the accuracy percentage. To minimize this, we randomly permuted the data each time before testing the model with a new feature and reported the average accuracy percentage for all the trials.
Methodology summary
To summarize the methodology,
Whole-brain deterministic streamline tractography based on the AAL template is performed. The AAL template consists of 90 ROIs based on which the network is constructed. The physiological parameters considered are fractional anisotropy, fiber count, mean diffusivities, and principal diffusivities. Global clustering coefficients and efficiency, nodal clustering coefficients, and inter-nodal measures are used as features. The features that are most effective in discriminating between the classes are chosen. Margin classifiers, dimensionality reduction and tree based algorithms are used as supervised models. A ten-fold cross-validation protocol is used to evaluate the performance of the model.
No approval from an ethics committee was required. All data was de-identified and publicly available.
Results
Instead of investigating a specific ROI or tract, a whole-brain approach which includes all the regions and tracts was used and then the specific regions that maximized the model’s performance is reported. First the global connectivity parameters derived from different biophysical maps were used to evaluate the model. Then local parameters such as ROI clustering coefficients and inter-nodal tract features were used in conjunction with the global parameters to evaluate the model’s performance.
Global measures
A CART model was trained and validated using a ten-folded cross-validation procedure. The model accuracy percentage based on GCC derived from a single map is plotted in (Fig. 3a). Individual map parameters have poor performance (
(a) Performance of individual map CCs (b) model performance as a function of false negative cost penalty. A cost of 0.5 had best impact on model performance.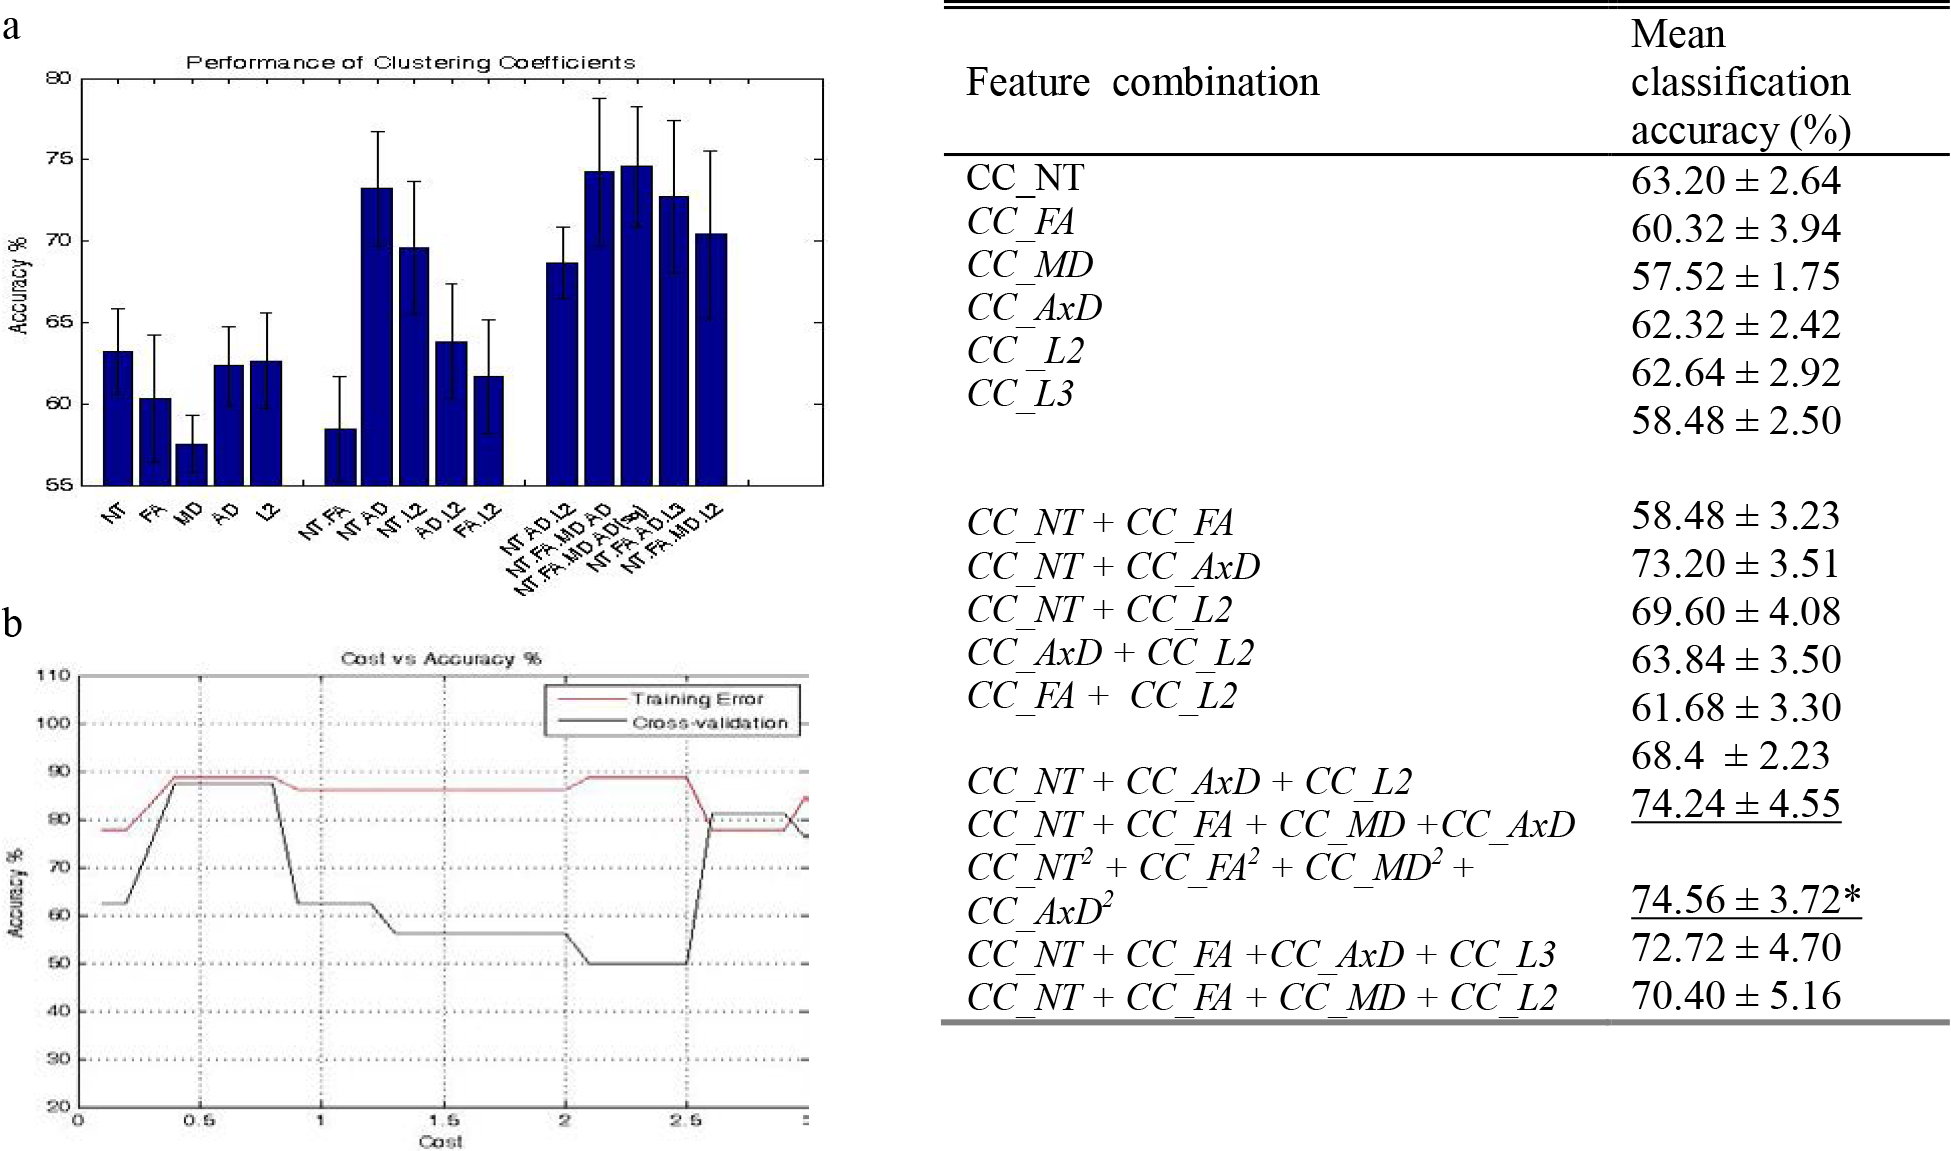
Six physiological maps were considered in this study. Each physiological map consists of ninety ROIs and the clustering coefficient for each ROI was computed. Therefore, a total of 90
(Left) ROI clustering coefficients vs accuracy percentage (normalized to 1). The inclusion of CC of the Cingulum Anterior (R) from the FA, AD, L3 and the CC of pallidum (R) from the AD map improved the average classification performance. (Right) The Anterior Cingulum is highlighted in a sagittal section of an MRI scan.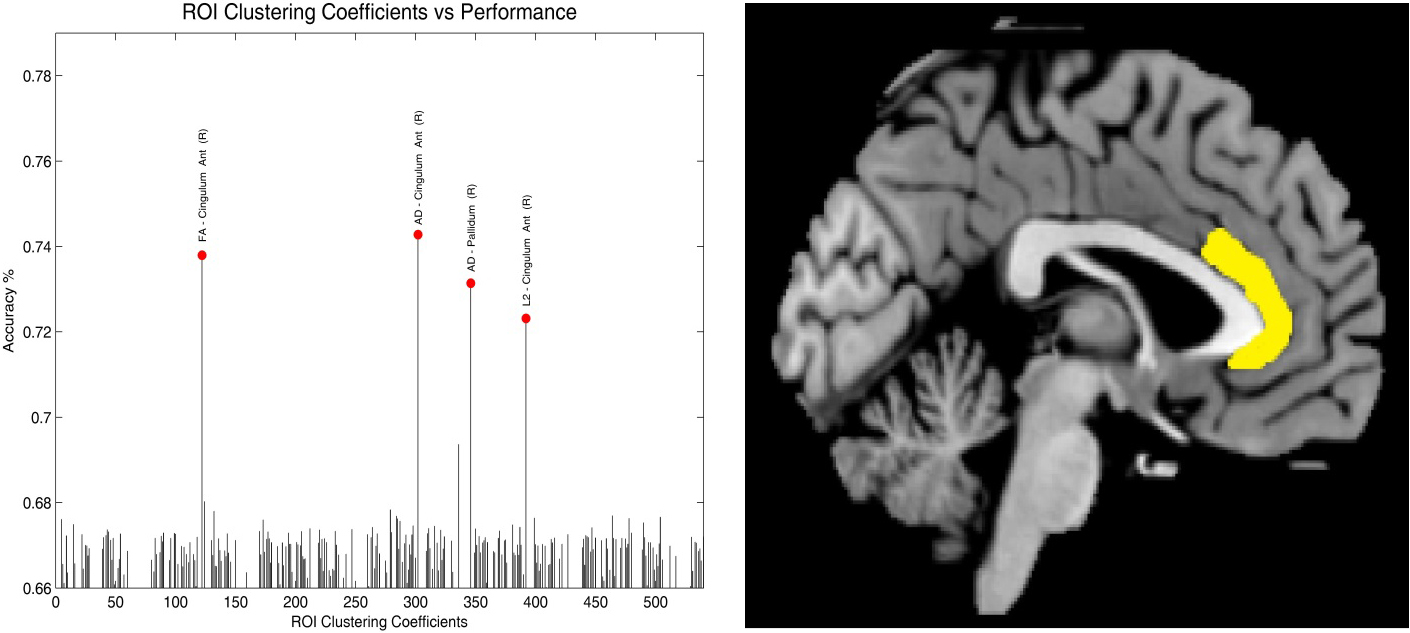
The CC of the right anterior cingulate cortex (ACC) derived from the FA, AxD and L2 maps and the CC of the right pallidum derived from the ADx map had the most impact on the model’s performance (Fig. 4). The percentage accuracy of the model increased by about 6–8% when these features were used in conjunction with the GE measures in comparison to using the global efficiency features alone. Some features derived from the FA, AxD and L2 improved the model’s performance, however, features derived from the NT, MD and L3 maps had little effect on the model’s performance.
The performance of classification models were evaluated and compared. Two tree based models (CART and BDT) and two margin based classifiers (Linear SVM and Gaussian SVMs) were compared. The CART model’s performance (as a function of cost) and the BDT’s performance as a function of the number of trees is shown (Fig. 5). BDT, a bootstrap aggregation algorithm, uses a small random sample (with replacement) of the observations to construct a tree and the performance is validated on the samples that weren’t selected in that trial (out-of-bag samples). This process was repeated multiple times for many trees by selecting samples randomly. The reported accuracy is the aggregated response of the performance from all the constructed trees. Random subsampling and ensemble aggregation reduces over fitting and resulting in better performance. The out-of-bag classification performance of BDT was the highest for around 152 trees. Tree and ensemble aggregation methods (CART and BDT) performed better when compared to margin classifier models.
A comparison of various classification models (a) Performance of CART model as a function of cost for model training. A cost 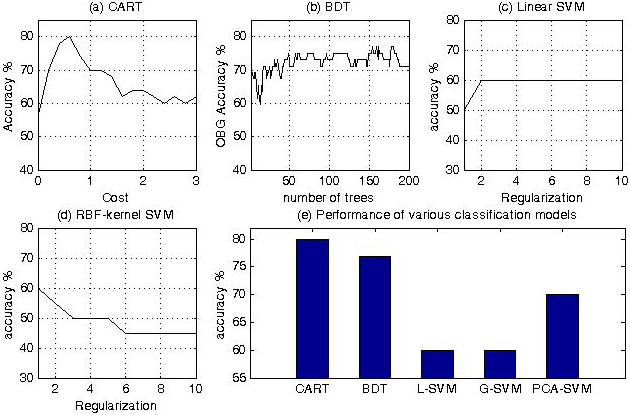
The performance of the linear-SVM model and the Gaussian SVM model as a function of the regularization parameter is shown (Fig. 5c and d). The performance of SVMs was poor in comparison to tree-based ensemble methods. The PCA algorithm was used to orthogonally project the high dimensional features into a low-dimensional feature space in a way that maximizes the variance of the projected data. The resulting features were then used to train linear and Gaussian SVM. The performance of the PCA based SVM was higher than models that only utilized raw features (
The third feature type examined was the number of tracts between the ROIs. Using the AAL template, there were 90
Discussion
In this study, computational models were trained using connectivity parameters from DTI images and the ability of the model to distinguish MCI associated with AD and MCI associated with normal aging was investigated. We hypothesized that differences in connectivity measures between MCI-AD and MCI-controls can be useful in distinguishing the two groups. Raw DTI images from both MCI-AD and MCI-control subjects were preprocessed and corrected for errors and parcellated using the AAL template. Several network based measures based on global, local and inter-nodal metrics were derived. Machine learning algorithms based on trees, ensemble aggregation methods, support vector machines and dimensionality reduction algorithms were trained using data from MCI-AD and MCI-control subjects. The performance of the models were evaluated using a ten-fold cross-validation. The parameters and the models that resulted in maximum prediction accuracy are reported.
Global features: Among global measures, the global clustering coefficient of the network had a greater impact on the model’s performance compared to global efficiency. In particular, the clustering coefficient of the NT, FA, MD and AD maps were the most effective in discriminating the MCI-AD and NCI-control group. Voxel-based and connectivity-based studies have previously reported that these maps are useful in discriminating the two groups [13]. Global efficiency is a distance measure and is an indication of how efficiently information is facilitated in a network. Our finding that the GE measures are affected in early stages of MCI-AD is consistent with previous reports [16]. In addition, the inclusion of features from the ‘binary matrix’ which indicates whether any two regions are connected or not had no effect on the performance of the model. This could imply that during the early stage of the disease, connectivity between two regions are not severed completely, but only that the strengths of local connectivity of the ROI are altered.
Local features: After selecting global features that were most effective in improving the model’s performance, each one of the 540 nodal CCs were added to the feature set sequentially and the performance of the model was evaluated (Fig. 3) each time. Among all the nodal CCs, features extracted from the right ACC particularly from NT, FA, AxD and L2 map and the CC of the right pallidum extracted from the AxD map had the highest impact on the model’s performance. The ACC is implicated in a number of autonomic, endocrine and cognitive functions [23] and behavioral functions such as ‘unawareness of deficits’ [24]. Decrease in FA and microstructural alteration of the ACC has previously been associated in AD [25, 26] and parameter derived from the ACC have been shown to predict AD in MCI patients [27]. Axonal disruptions in WM tracts is associated with AD-related behavioral changes such as apathy [26]. The predictive power of FA maps of the ACC region suggest possible disruptions in axonal flow and changes in the number of axons in the ACC during MCI-AD. The CC of the right pallidum from the AxD map improved the performance of the model. A previous MR study examining glucose metabolism has reported that the pallidum is relatively unaffected during AD [28, 29]. The role of right pallidum in the evolution of AD pathology requires further investigation. Another phenomena that we observed was that all local features that improved the model’s performance were from the right hemisphere of the brain. Our findings are consistent with reports from several others studies that have implicated the right hemisphere during the earlier stages AD [30, 31]. In contrast, others have implicated the left side of the brain during MCI-AD [32, 33]. These discrepancies need further investigation.
Number of tracts: The number of WM tracts between, the right superior frontal gyrus and the right rolandic operculum, the left supramarginal gyrus and the left angular gyrus, and, the left heschl gyrus and the left temporal lobe resulted in improving the model’s performance the most.
Model comparison: Initially all the features were used to train the model in a high dimensional feature space, it resulted in high variance and poor performance; a common problem with datasets consisting of few observations compared to features [34]. SVM (both linear and Gaussian) did not provide satisfactory performance. We used PCA to reduce the dimensionality of the data by projecting the data into a lower dimensional data (with only the first 50 principal components) before using a SVM classifier, but the use of PCA did not impact the performance of the model. Random forests and BDT gave satisfactory performance. In our analysis, tree and ensemble methods perform better than margin classifier methods.
During the early stages of AD characterized by MCI, it is speculated that changes in WM tracts are subtle and precede structural atrophy that is observed in AD. In this study, we used connectivity-based features from DTI images from MCI-AD and MCI-controls to build computational models that can predict AD. Instead of investigating a specific ROI or a WM track, a whole-brain data-driven approach was considered and features that maximized the predictive capacity of the ML model are reported. This approach is can be useful in the discovery of imaging biomarkers and in the development of diagnostic tests for early detection of AD. Incorporation of features from other imaging and non-imaging modalities such as fMRI, MRI, PET and more could improve the model performance further. Such strategies could lead to the development of early detection techniques and interventional therapies for the better management of MCI-AD patients with the goal of delaying the onset of the disease or preventing it altogether.
Conclusion
This study employs a data-driven approach to elucidate connectivity-based features that are most effective in discriminating between MCI-AD and MCI-control subjects. Our main conclusions are that features derived from NT, FA, AD and L2 maps were most useful in discrimination between the classes. Also, the global clustering coefficient and the coefficients of the right anterior cingulate cortex improved model performance. Future work would incorporate features from functional networks (fMRI modality) into the existing framework.
Footnotes
Acknowledgments
The investigators would like to thank the Neuroscience Research Repository for assistance with obtaining the specimens and all the nurses and physicians who take care of patients in the NSICU at Memorial Hermann Hospital – Texas Medical Center.
Conflict of interest
The authors declare no conflict of interest pertaining to this work.
Author contributions
JS, HC, RK and DK were involved in the conception and design of the study. JS was involved in the acquisition and analysis of data. JS, DK and HC contributed substantially in drafting the manuscript and figures.