



Abstract
BACKGROUND:
The haemodynamics determined by different approaches for studying fluid dynamics – i.e. computational fluid dynamics (CFD), particle image velocimetry (PIV), and phase-contrast magnetic resonance imaging (PC-MRI) – have rarely been thoroughly compared; nor have the factors that affect accuracy and precision in each method. As each method has its own advantages and limitations, this knowledge is important for future studies to be able to achieve valid analyses of fluid flows.
OBJECTIVE:
To gauge the capacity of these methods for analysing aneurysmal flows, we compared the haemodynamic behaviours determined by each method within a patient-specific aneurysm model.
METHODS:
An in vitro silicone aneurysm model was fabricated for PIV and PC-MRI, and an in silico aneurysm model with the same geometry was reconstructed for CFD. With the same fluid model prepared numerically and physically, CFD, PIV and PC-MRI were performed to study aneurysmal haemodynamics.
RESULTS:
2D velocity vectors and magnitudes show good agreement between PIV and CFD, and 3D flow patterns show good similarity between PC-MRI and CFD.
CONCLUSIONS:
These findings give confidence to future haemodynamic studies using CFD technology. For the first time, the morphological inconsistency between the PCMRI model and others is found to affect the measurement of local flow patterns.
Keywords
Introduction
Cerebral aneurysm rupture has been one of the most dangerous conditions threatening people’s health, although with current medical facilities aneurysms can be detected before they rupture [1, 2]. Since the aneurysm treatment process also has a substantial risk of causing severe harm to the patient, medical doctors are faced with a dilemma of whether to treat an aneurysm or not [3, 4, 5, 6, 7].
Haemodynamics – encompassing things such as blood flow patterns, velocities, pressures and wall shear stresses – is thought to be a very important factor related to the rupture of intracranial aneurysms [8, 9, 10, 11, 12, 13]. Therefore, it is widely believed that understanding the haemodynamics within an aneurysm may help medical doctors to assess the risk posed by the aneurysm and then make the decision as to whether to intervene or not.
In order to evaluate the condition of a patient-specific aneurysm by determining the intra-aneurysmal flow patterns, the velocity vector fields inside the aneurysm are often selected for study. These velocity vector fields have been determined by a variety of different methods in the literature: (1) particle image velocimetry (PIV), which is an optical method to visualise the flow movement in in vitro models; (2) computational fluid dynamics (CFD), which is a numerical method to analyse fluid flows in virtual models; and (3) phase-contrast magnetic resonance imaging (PC-MRI), which is a specific type of medical imaging technique used primarily to determine the vector field of flow velocities in the 3D fluid zone at different times and can be used in both in vivo and in vitro measurements.
Studies using different methods to study the vascular haemodynamics have been conducted in the past. Raschi et al. [14] studied the haemodynamic behaviour in a growing patient-specific intracranial aneurysm by comparing PIV and CFD results; despite the differences found in the near-wall region and errors caused by inherent limitations of each technique, the overall flow patterns were reported as being consistent. Bouillit et al. [15] observed the flow pattern and velocity reduction in an idealised sidewall aneurysm before and after three commercial flow-diverting stent deployments, using both PIV and CFD methods, and they reported a good capability of CFD to reproduce PIV results for the unstented cases but limitations in the reproduction of results from stented conditions. Isoda et al. [16] studied aneurysmal haemodynamic parameters using PC-MRI and CFD, and found a moderate agreement upon comparison of the results. Khodarahmi et al. [17] reported the capability of PCMRI to estimate the haemodynamic parameters in an idealised stenosis model by comparing against PIV and CFD. Van Ooij et al. [18] studied the flow pattern in a patient-specific aneurysm with CFD, PIV and PC-MRI, which revealed comparable results in the qualitative comparisons. Roloff et al. [19] recently studied the aneurysmal flow using three different PIV techniques and compared these with PC-MRI and CFD results, which revealed a limited capability of PC-MRI to produce quantitative data for the aneurysmal flow.
Each method has its own advantages and limitations. Flow patterns for the same geometry determined by PIV, CFD and PC-MRI have been compared in just a few cases; in particular, there is only limited knowledge of the complex flow behaviours that may occur in real aneurysm geometries. Moreover, agreements and discrepancies found in such comparisons between different research approaches – along with the ways in which influence factors may cause or enhance the errors – have not yet been carefully studied. However, such knowledge would be important to obtain an accurate analysis of the fluid flows, which is also the foundation for more sophisticated studies about aneurysmal haemodynamics.
The purpose of this research is to compare the aneurysmal velocity vector fields obtained from three different methods: PIV, CFD and PC-MRI. Through assessing the agreements and disagreements in 2D velocity vectors and 3D velocity streamlines, and through quantitative velocity comparisons, this study aims to understand the capacity of each method to determine the aneurysmal fluid flows and analyse the factors that may lead to any discrepancies.
Methods
Patient data
This study was approved by the institutional review boards of Nagoya University and Iwata City Hospital in Japan (no. 2010-1062-3), and we used anonymised patient data. A realistic aneurysm model was used in this research, which is a right basilar artery-superior cerebellar artery aneurysm of a 70-year-old female patient. The aneurysm was located at the bifurcation of the basilar artery (BA) into the right posterior cerebral artery (RPCA) and the left posterior cerebral artery (LPCA). The aneurysm was scanned on a 3T magnetic resonance (MR) imaging scanner (Signa HDx 3T, Healthcare) using an 8-channel neurovascular array coil. 3D time-of-flight magnetic resonance angiography (TOF-MRA) was performed with a scan resolution of 0.38
In vitro silicone phantom
With the scanned data, the astereolithography (STL) file of the blood vessels and aneurysm was reconstructed using commercial medical image processing software (OsiriX v5.8.1). With this original STL file, an in vitro model was manufactured by casting the aneurysm and its parent arteries into a silicone block (R-tech Co.), as shown in Fig. 1. Plane A, located around the aneurysm neck, was selected as the measurement plane to compare the haemodynamic results obtained from PIV, CFD and PC-MRI.
Silicone phantom of the patient-specific aneurysm: (a) magnified back view, (b) magnified front view, and (c) complete silicone block.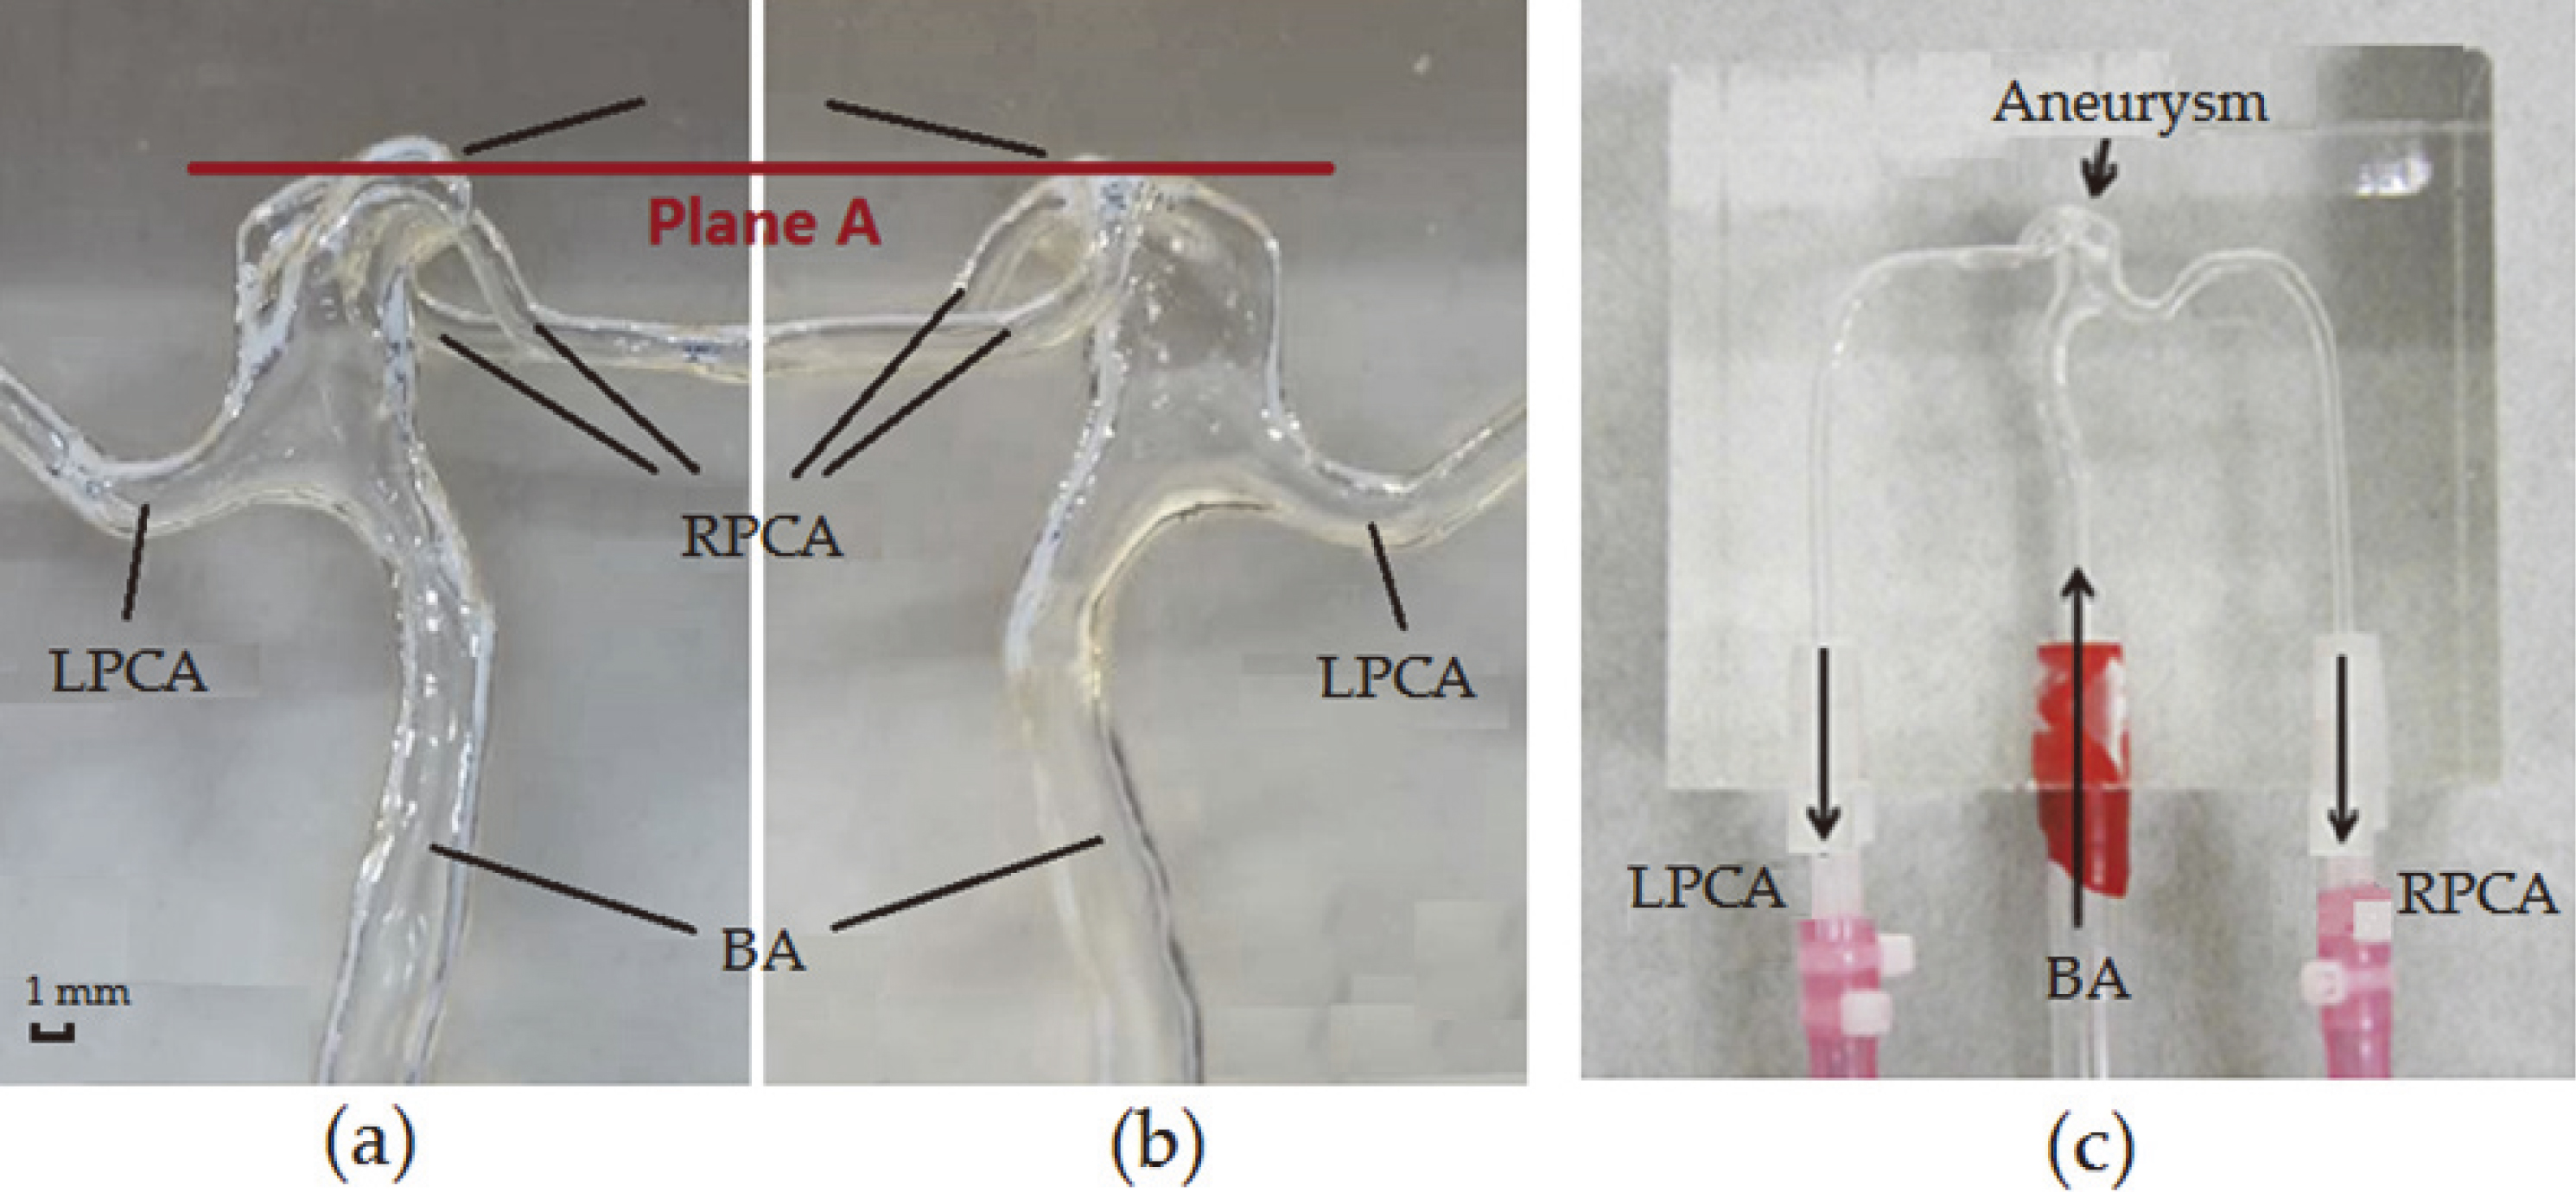
Considering the morphological discrepancies that might have arisen during the fabrication of the silicone model using a 3D printing technique, the silicone model was scanned with a MicroCT scanner (ScanXmate-D180RSS270, Comscantec). In order to capture the detailed morphological characteristics, we adopted a resolution of 40
Based on these slice-by-slice scans, image segmentation and 3D reconstruction were performed using commercial medical image processing software (OsiriX MD, Pixmeo SARL, Switzerland), and the lumen boundary was extracted and reconstructed into a 3D virtual model in STL format, as shown in Fig. 2. Based on this process, the morphology of the silicone model and the geometry used for CFD simulation were considered to be equivalent.
Blood-analogue fluid (BAF) for PIV and MRI
A BAF was created for flow modelling in both the PC-MRI measurement and PIV experiment. Fluid properties that may affect its haemodynamic behaviour, such as fluid density and viscosity, were specified to be as close as practical to those of human blood, as shown in Table 1. To meet the fluid measurement requirements for each experimental approach, the solution compositions were slightly different. As an optical method, the refractive index of the BAF used in PIV was specifically controlled to match that of the silicone model, so that the visualisation of flow movement would not be influenced by undesired refraction [20]. Since the BAFs for PIV and PC-MRI were created separately, unavoidable differences existed in the solution properties, but these were within an acceptable range, with 8 and 14% differences respectively for density and viscosity.
Blood-analogue fluid in PC-MRI and PIV
Blood-analogue fluid in PC-MRI and PIV
Reconstructed 3D aneurysm model.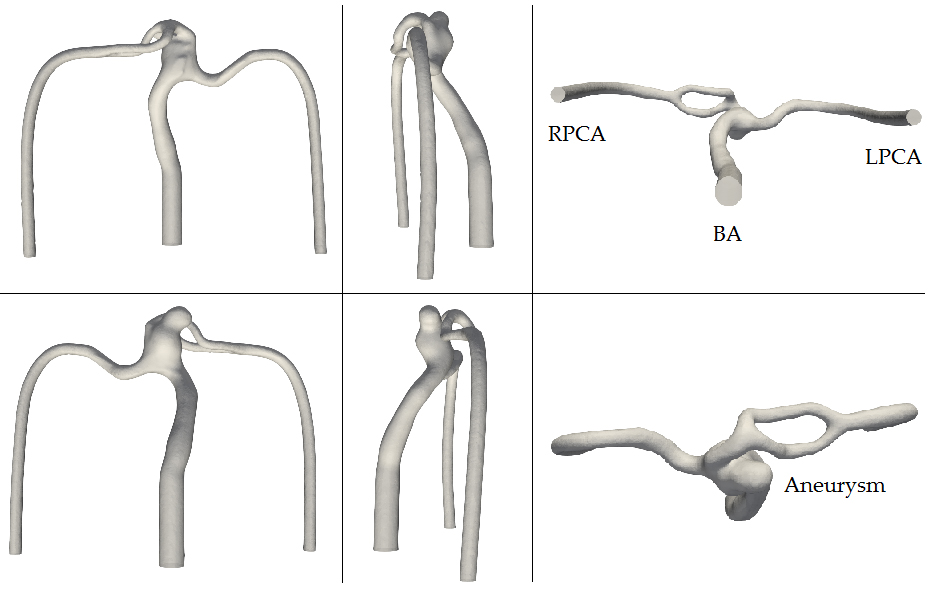
The silicone aneurysm model was connected to a pump (NBL30PU, R’Tech, Japan) through tubes, with BAF running into the aneurysm model from the BA as the inlet and coming out from the LPCA and RPCA as outlets [21]. A straight tube of 1 m length was added before the inlet of the silicone block in order to provide enough distance for the inflow to be fully developed before entering the aneurysm [21]. The pump generated a flow of 290 mL/min, which is close to the average flow rate of human blood in the BA. Three Coriolis flow meters (FD-SF1, Keyence Corporation, Japan) were connected to the circulation system to monitor the inlet and outlet flow rates, while valves were used to assist in adjusting the outlet flow rates to maintain the expected values in the RPCA and LPCA of 170 and 120 mL/min, respectively. These target flow rates were obtained from clinical data. Seeding particles with the same density as the BAF were added to the BAF at low concentration: in that way the movements of particles embedded in the flowing BAF can be captured by a camera.
A high speed camera (FASTCAM SA3, Photron) with a resolution of 17
PC-MRI setup
The same circulation system as used in the PIV experiment was employed for the PC-MRI (MAGNETOM Verio 3T, Siemens Healthcare) measurement, with BAF for PC-MRI also running at the same flow rates. 3D cine PC-MRI was performed with a resolution of 1
Post-analysis of the magnetic resonance fluid dynamics (MRFD) was performed using commercial software (Flova, R’Tech, Japan) to determine the haemodynamics in the 3D fluid zone. The 4D-flow signal strength and flow velocity data were first loaded into the software in DICOM format, and the blood vessel wall was then generated based on the signal intensity of the 3D TOF-MRA, using a marching-cube or region-growing method. Velocities were computed with arbitrary spatial resolution after that, from which more haemodynamic parameters were then able to be displayed.
CFD simulation settings
Using the reconstructed 3D aneurysm model, a computational grid was created for the entire fluid zone using a commercial software application, ICEM CFD (Ansys, USA); the grid comprised tetrahedral and prism elements, with three boundary layers. To ensure simulation accuracy, the quality and robustness of the computational grid was checked by performing a mesh dependency test, which indicated that the meshing scenario with a total of 1.4 million elements was stable enough for an accurate simulation.
The flow was assumed to be an incompressible Newtonian fluid at a steady state undergoing laminar motion. Boundary conditions were set to replicate the flow environment created in both PIV and PC-MRI, as shown in Table 2. The blood density was specified as 1050 kg/m
Fluid boundary conditions
Fluid boundary conditions
A 2D velocity variable was created in post-processing of the CFD simulation for comparison with 2D velocities obtained from the PIV experiment. The projection of velocity on the measurement plane (plane A) was also generated for visualisation.
Results
Shape comparison for plane A: PIV, CFD and PC-MRI
The location of plane A is around the aneurysm neck, as shown in Fig. 1. Figure 3 shows the flow area for plane A as measured by different methods; the elliptical shape on the left side indicates the shape of the aneurysm neck while the concave triangular shape on the right side is the cut plane through the outlet artery (RPCA). As can be seen from the figure, the profiles obtained from PIV and CFD are in good agreement in terms of both the shape and size. While the flow area shapes obtained from PC-MRI are able to depict the general morphology of the aneurysm neck and the outlet cut plane, they show less similarity to those obtained from PIV and CFD. In Fig. 3c the elliptical shape is larger, especially in the top-right area where the neck plane almost reaches the junction between the aneurysm and the bifurcation. The elliptical shape representing the neck was selected as the measurement plane for further velocity vector field comparisons.
Shape of the target plane for different methods: (a) PIV, (b) CFD and (c) PC-MRI.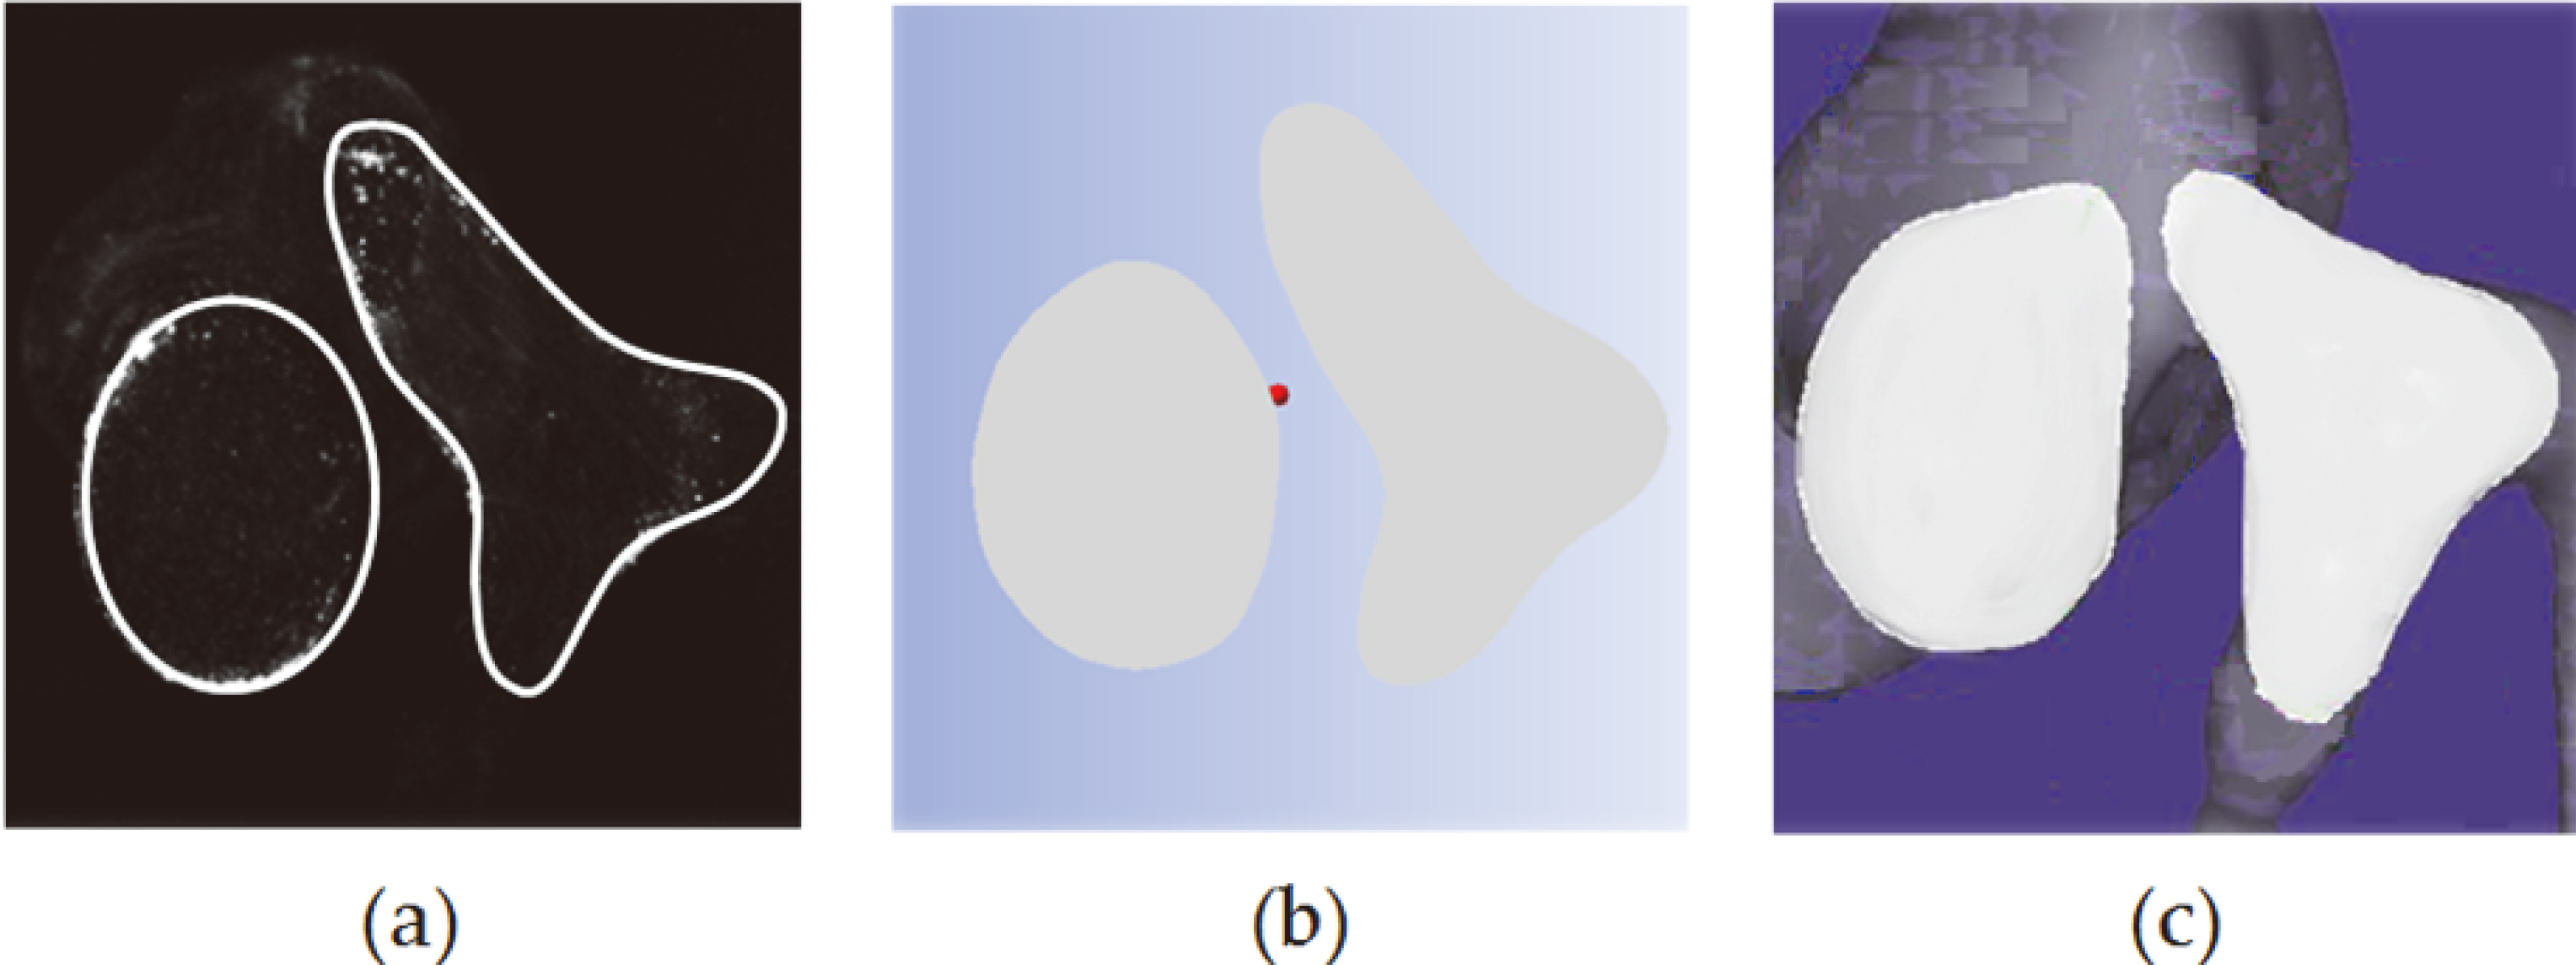
From the comparison of 2D velocity vectors on the measurement plane in Fig. 4, the velocity vector fields obtained from the PIV experiment and CFD simulation show good agreement, in terms of both the flow pattern and velocity magnitude. A vortex appears at the centre, with flow rotating in the anti-clockwise direction, and lower velocity is detected at the vortex centre compared to the surrounding flow. When the flow rotates to the upper region of this plane it splits off in different directions, forming a separation point. Velocities greater than 0.1 m/s are detected in the rotating flow around the vortex centre in both the PIV and CFD results; meanwhile, low velocities are also found at similar positions in both sets of results, namely at the vortex centre, in the lower region close to the aneurysm wall, and in the flow separation zone.
Velocity vector fields on plane A for one set of measurements each from PIV, 2D and 3D CFD and PC-MRI, presented with two alternative colourbar scales, in which the maximal velocity is respectively set as (a) 0.1 m/s or (b) 0.2 m/s.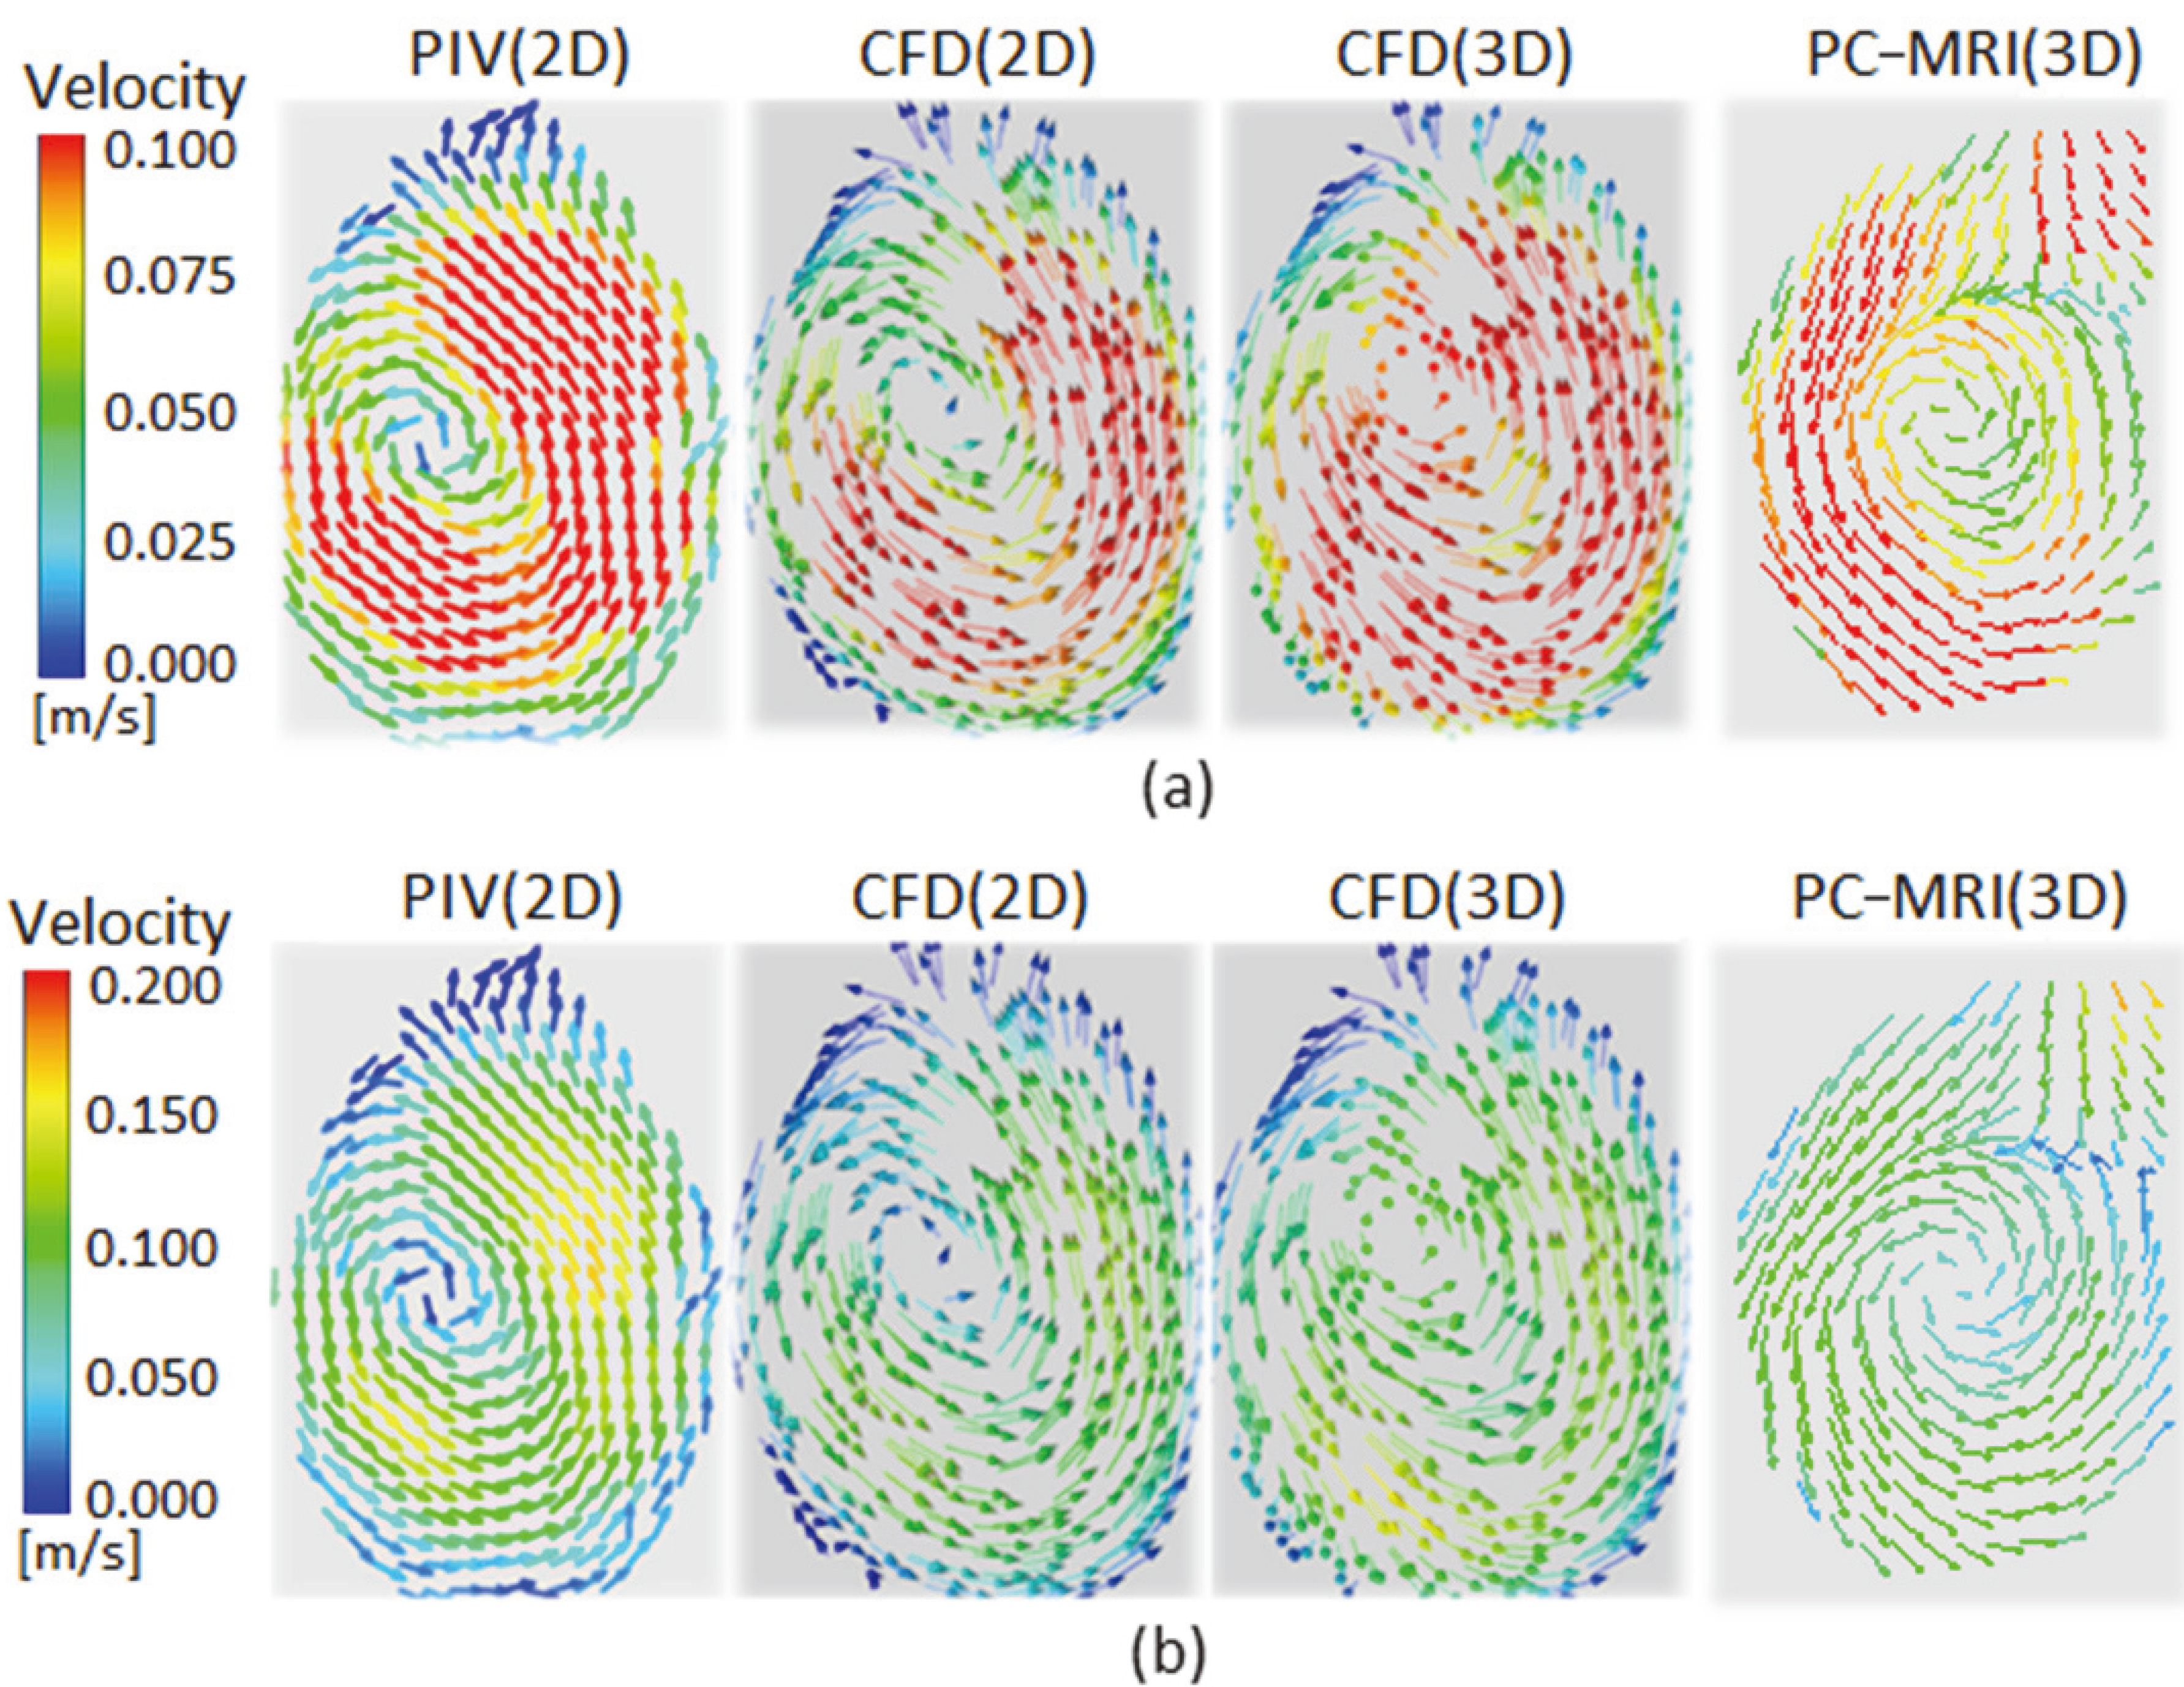
3D streamlines within the aneurysm obtained from CFD and PC-MRI (viewed from various angles).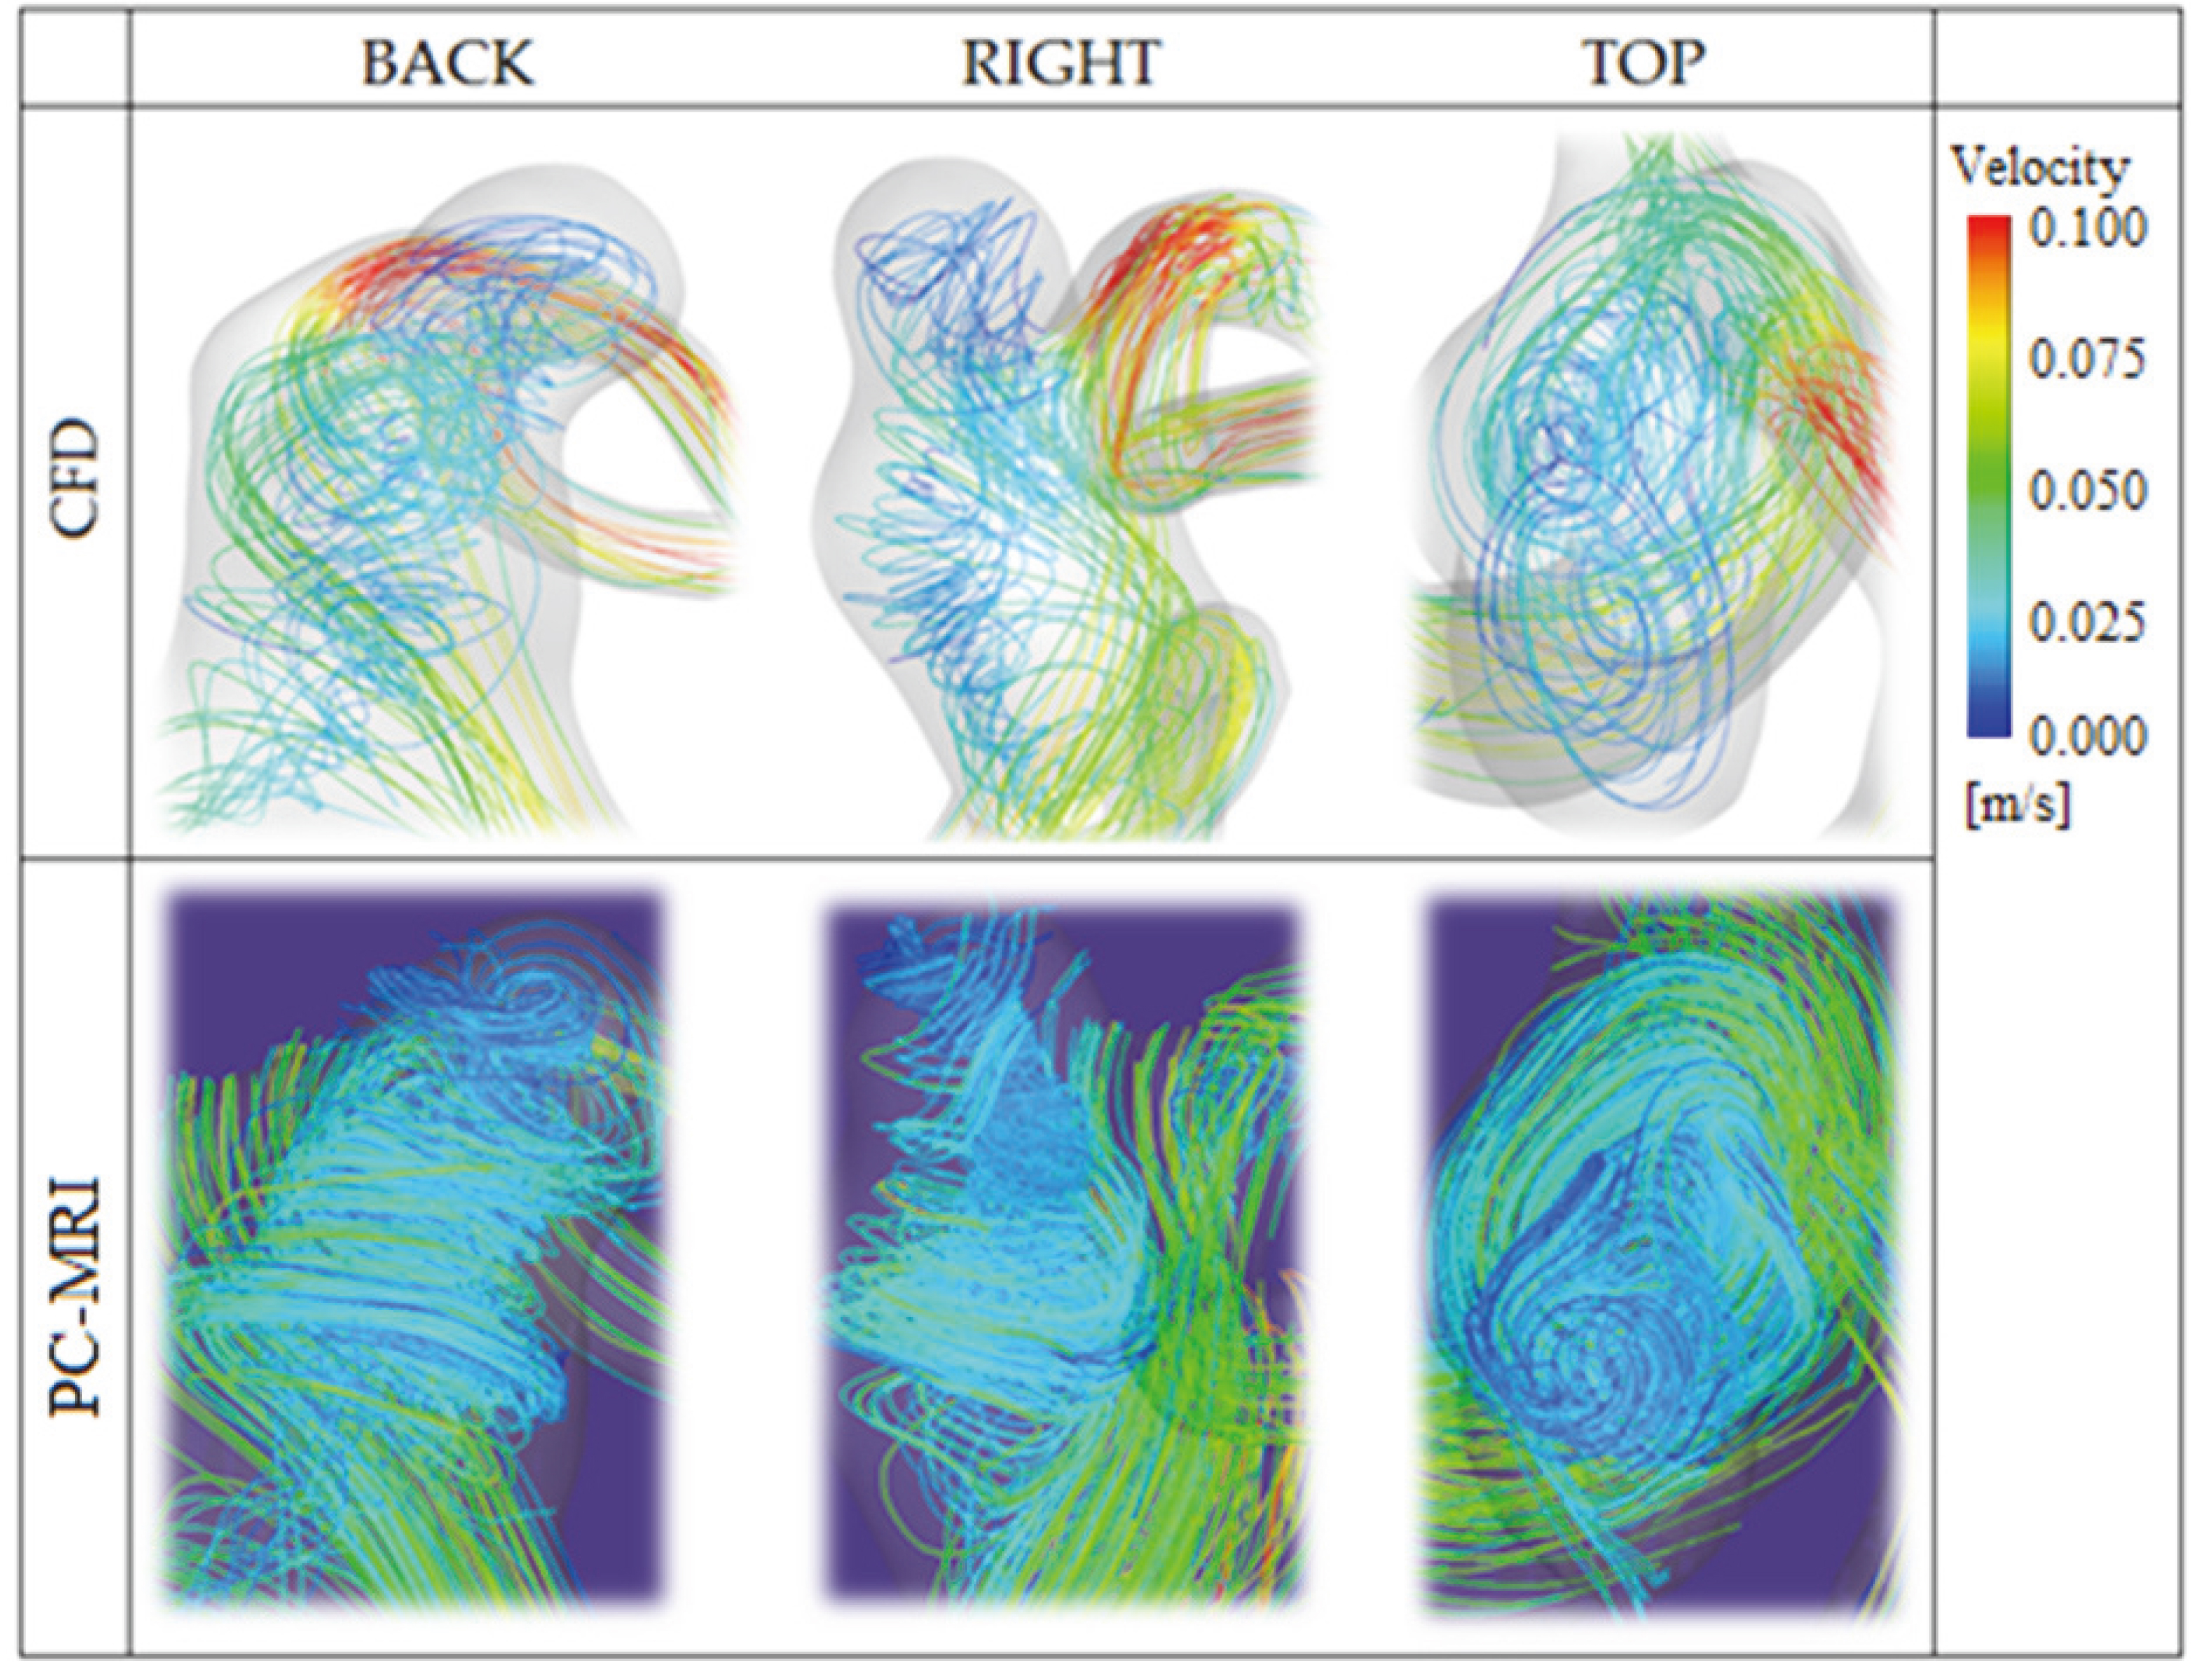
As for the velocity vectors obtained from PC-MRI in Fig. 4, the anti-clockwise rotational flow pattern in the centre can still be captured, with higher velocity than that from PIV and CFD; however, the flow pattern close to the boundary shows some discrepancies. Comparison to the PIV and CFD results shows that flows from above and below converging into a single leftward flow around the top-right of the vortex, which is also the position of the dissimilarity found in comparing the flow areas on the plane.
3D velocity streamlines in the aneurysm sac were visualised with results from both CFD and PC-MRI, as shown in Fig. 5. Although some dissimilarities exist around the model wall, the flow pattern in the centre of the 3D fluid zone shows good agreement between the prediction from CFD and the measurement by PC-MRI, in terms of both the velocity magnitudes and the position and direction of the vortex.
Quantitative velocity comparison: PIV, CFD and PC-MRI
To further check the consistency between PIV and CFD results, 2D velocity magnitudes on a horizontal line on plane A were compared, as shown in Fig. 6, which indicates good agreement. Besides that, the maximal value and average value of different velocity components on the measurement plane were also compared for the three methods, which reveals that the velocity predicted by CFD is higher than that of PIV, followed by PC-MRI. Moreover, the differences between CFD and PIV values range from 22 to 28% for different velocity components, while differences between CFD and PCMRI values indicate larger discrepancies of 32 to 41% across different velocity components, as shown in Fig. 7.
In-plane velocity magnitudes obtained from PIV and CFD. The velocity is plotted from the left to the right edge on a line across the vortex. The inset in the top-right corner indicates the position of the line.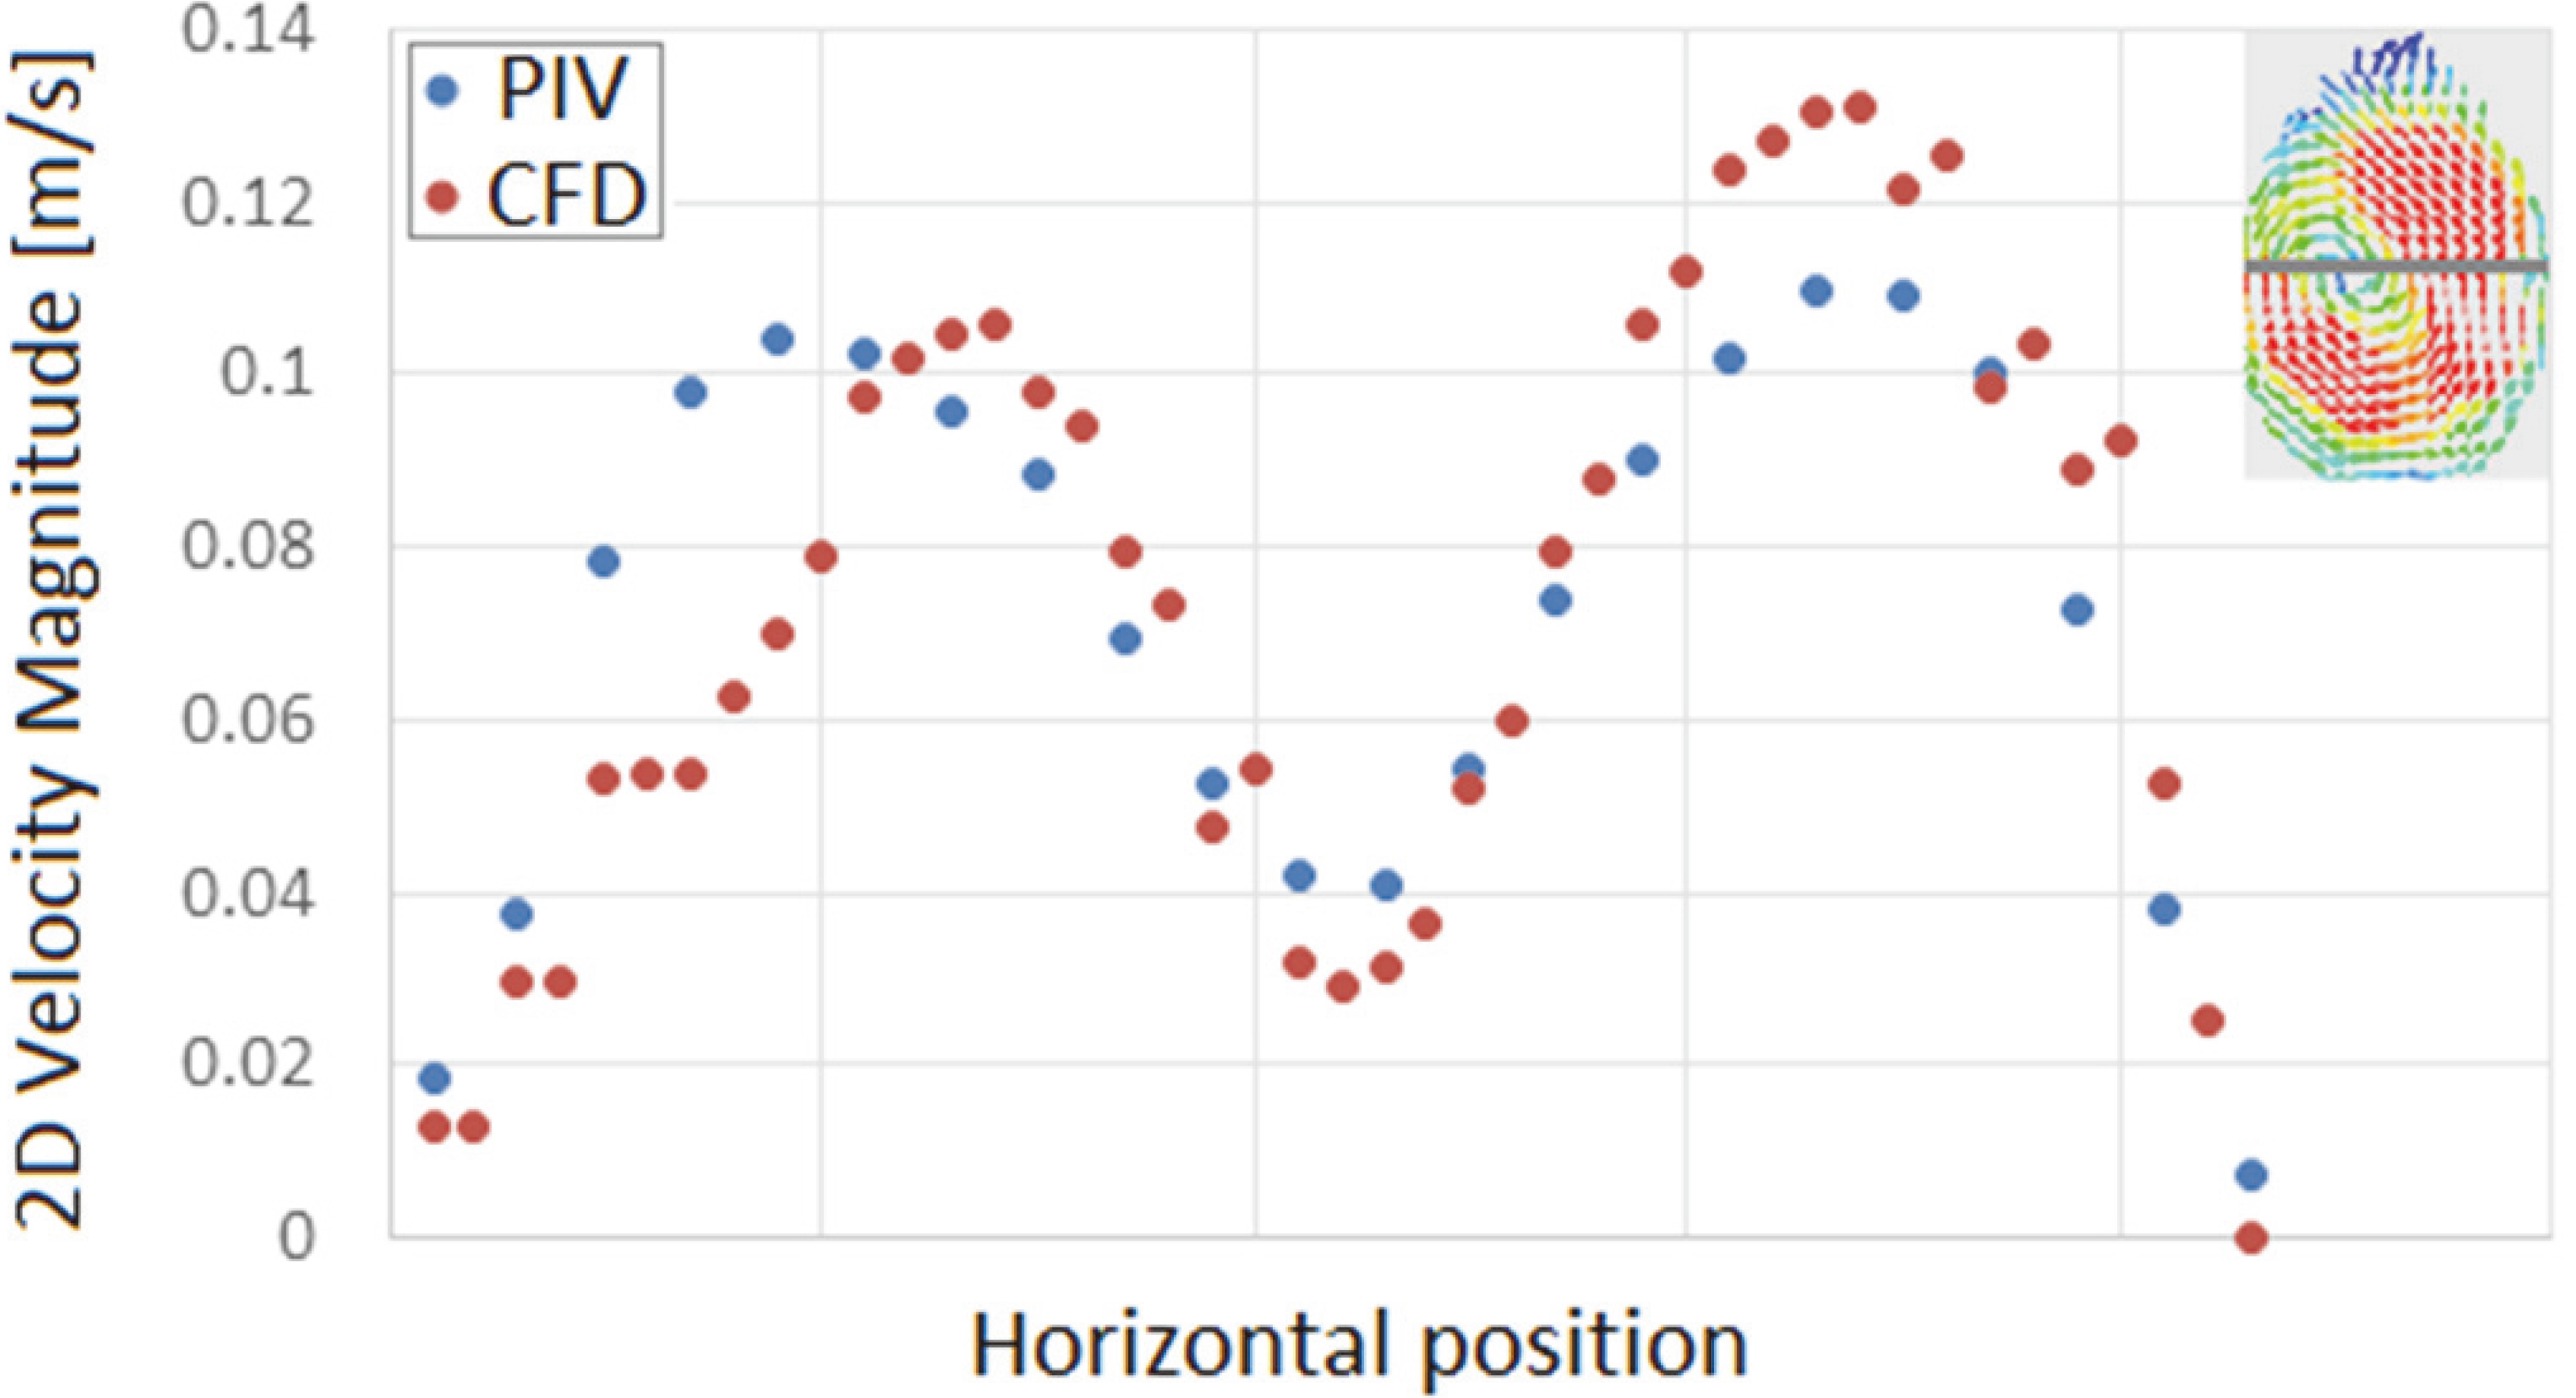
Differences in velocity magnitudes from CFD and PIV or PC-MRI.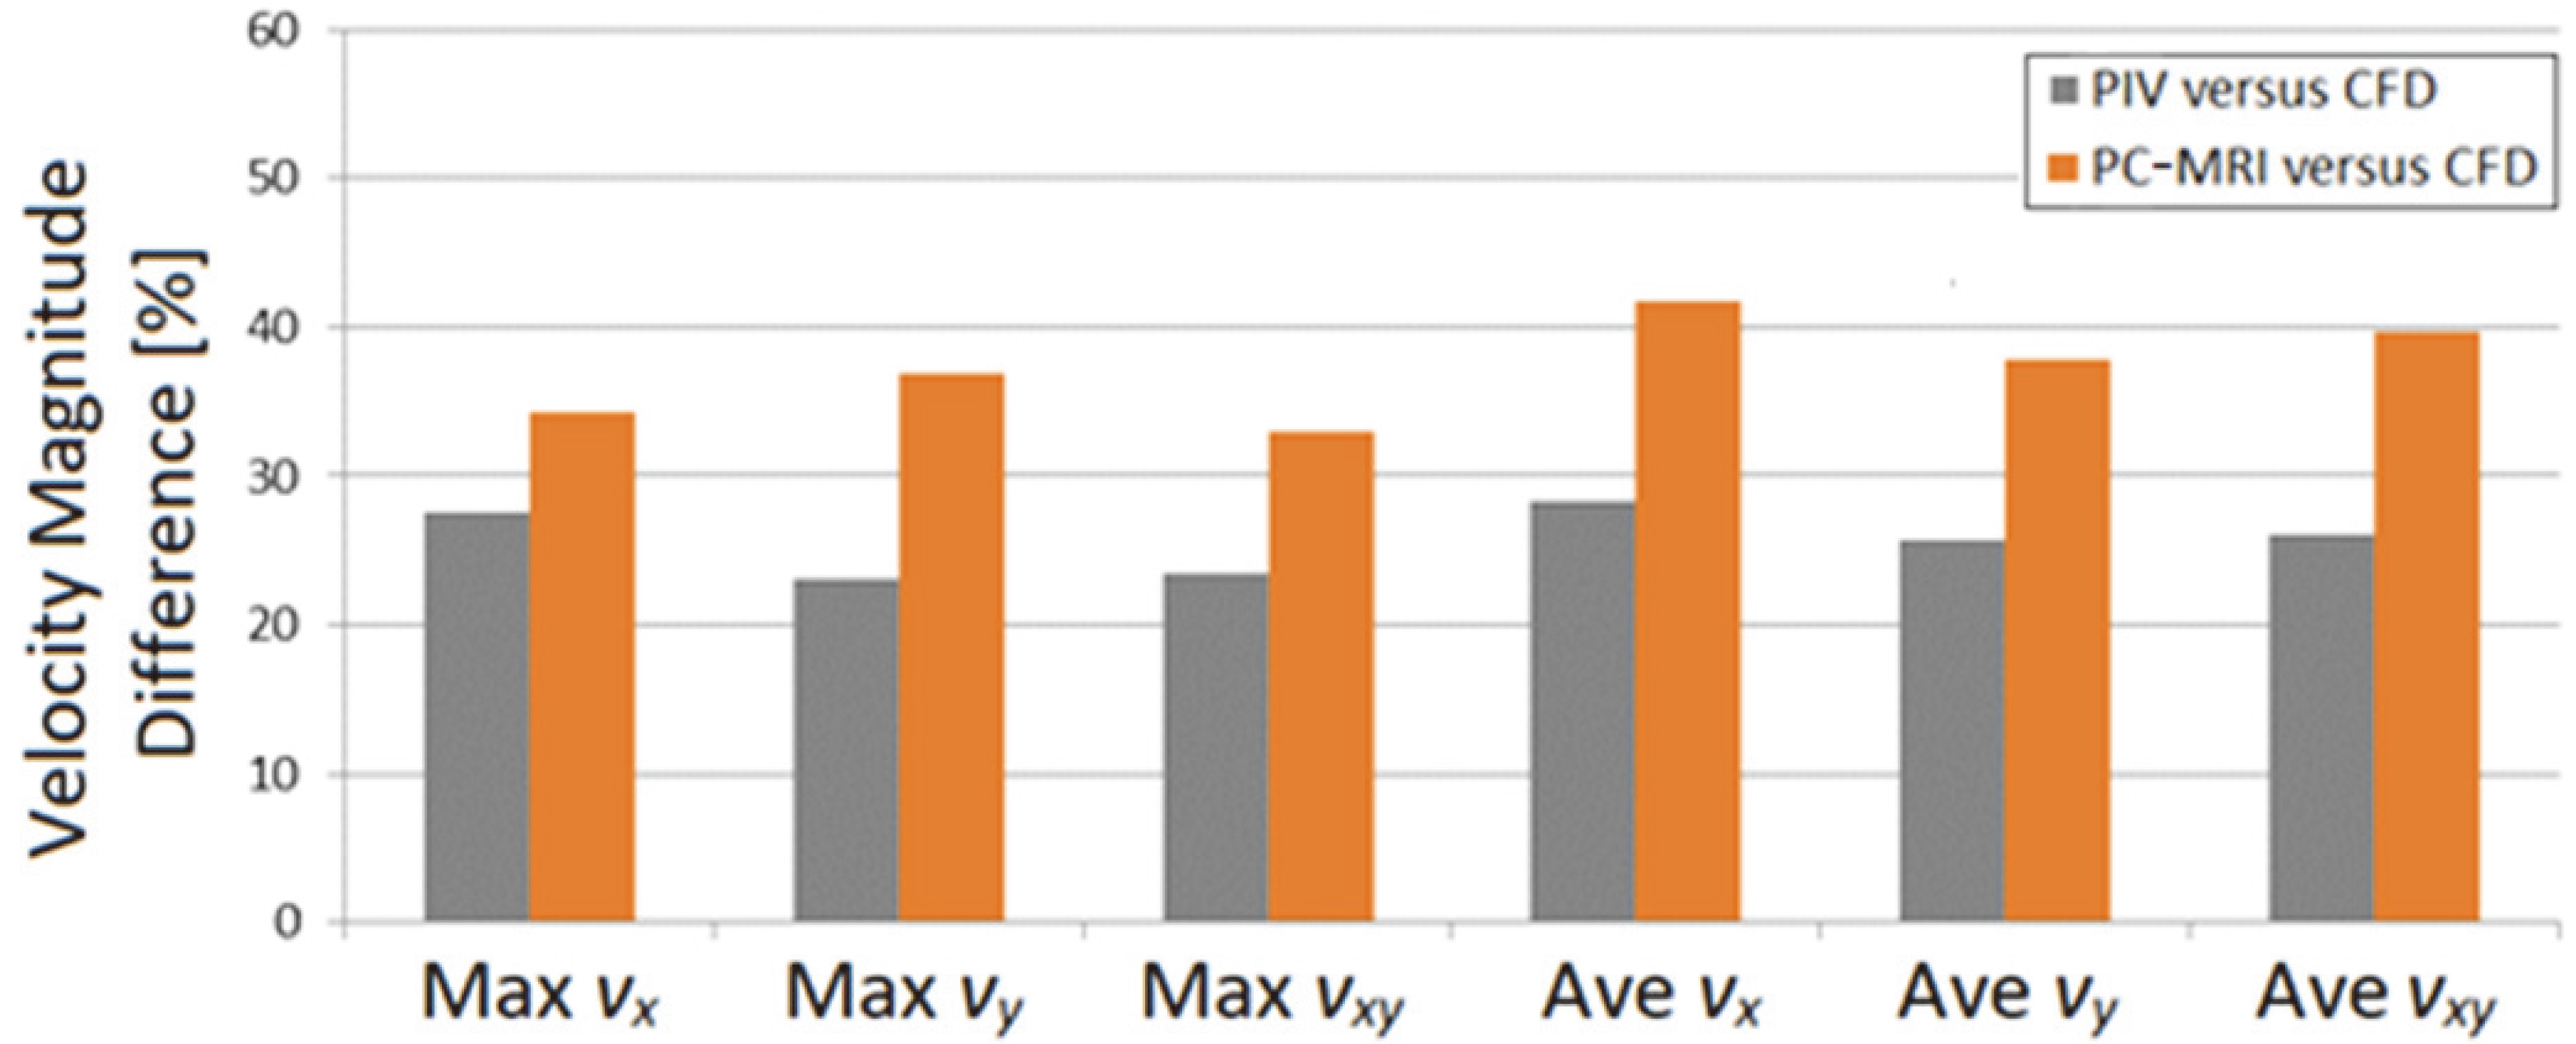
In this study the velocity vector field in a patient-specific aneurysm model has been studied using different methods – PIV, CFD and PC-MRI – which are commonly adopted numerical and experimental approaches to determine haemodynamics. Comparisons of 2D flow patterns and 3D streamlines obtained from these methods have been performed, with further quantitative checking of velocity magnitudes. There was good agreement in results for the 2D velocity vectors from PIV and CFD, as well as for the 3D flow patterns from PC-MRI and CFD. Through the comparisons, this study has revealed the characteristics of those methods – advantages and drawbacks – which could serve as useful knowledge and important references for future haemodynamic investigations using the same methods. Moreover, CFD is widely used to study the difference in haemodynamic improvements following successful and unsuccessful treatments for intracranial disorders, which causes it to be recognised as a useful tool in risk-factor analysis after clinical operations [23]; meanwhile it could also assist in evaluating the treatment efficacy of different strategies, such as clinicians’ decisions regarding the number of FD stents to deploy, whether a compaction of the stent wires is needed, etc. [13]. The present study has also examined the power of CFD technology to produce valid results that could aid decision-making before and after clinical treatments.
Model morphological difference in PC-MRI
According to the comparison of cross-sections on plane A given in Fig. 3, the discrepancies found between PC-MRI and the other approaches were located close to the aneurysm neck and the artery bifurcations of the BA and RPCA – in other words, the area with more complex morphology than normal blood vessels that may lead to unusual haemodynamic conditions.
Due to technological restrictions, the measurement resolution adopted in PCMRI could not be as fine as that attained in PIV and CFD [16]; therefore some morphological details might be unavoidably compromised. MRFD results are obtained based on the clinical imaging dataset scanned from 3D TOF-MR angiography (MRA) and 3D PC-MRI. As with other clinical imaging techniques like rotational angiography (RA) and computed tomography angiography (CTA), vascular geometries obtained from MRA are thought to be larger than the real vascular geometries, due to the partial volume effect following from the relatively poor spatial resolution [24, 25]. Moreover, PC-MRI is based on the detection of variation in spin motions of hydrogen atoms under a certain magnetic field, which relates to the phase shift that has a proportional relationship to the velocity of the hydrogen atom [26, 27]. Nevertheless, unlike the water molecules in the body that provide hydrogen atoms (both moving particles in the blood flow and motionless particles in the surrounding tissues), the silicone model that is the surrounding material of the BAF contains relatively few hydrogen atoms, which limits the performance of PC-MRI measurement close to the model wall, which is also the edge of the fluid zone.
To further characterise the morphology difference we extracted the surface of the model generated from PC-MRI measurement, which was then compared with the 3D model used for CFD (which was reconstructed from the MicroCT scans of the silicone model), as shown in Fig. 8. Looking from the front (see Fig. 8a), the geometries for PC-MRI and CFD show good similarity in terms of the overall shape and size; the features of the aneurysm, bifurcations and artery bending are accurately captured. However, local discrepancies can be found around the aneurysm neck – more precisely, the junction area between the aneurysm neck and the RPCA outlet, as marked by the blue arrows in Fig. 8b and c. The curvature of the bend from the aneurysm neck to the outlet RPCA is larger in the CFD model, resulting in a more obvious concavity between the aneurysm and outlet artery.
The morphology of 3D models measured by PC-MRI and used in CFD.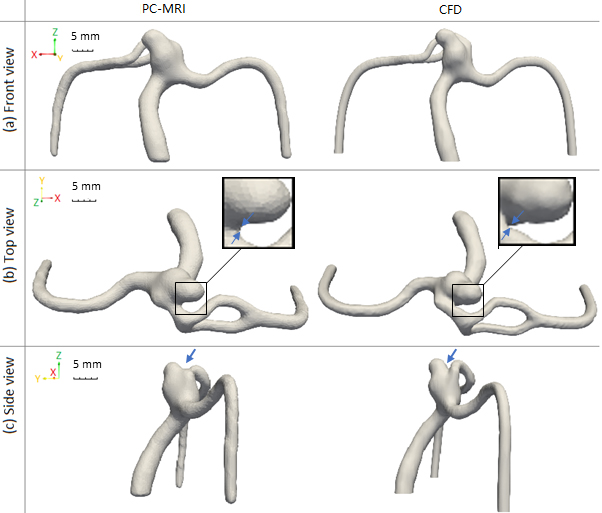
According to size measurements with the CFD model, the smallest diameters of the BA, LPCA, RPCA, and aneurysm sac were approximately 3.2, 1.8, 1.4, and 3.5 mm, respectively; however, the narrowest distance between the aneurysm and RPCA at the aforementioned concavity is less than 0.3 mm (as indicated in Fig. 8b), which is smaller than the pixel size in PC-MRI measurement (with a resolution of 0.5
This finding also explains the difference in the flow areas on plane A (see Fig. 3), as this plane is located around the aneurysm neck, and so the difference in the depth of the concavity affected the shape of the cross-sections for the aneurysm neck and the outlet artery.
Differences in the planar velocity vectors displayed in Fig. 4 can also be explained by the above-mentioned morphological difference. As the separation point on the measurement plane is affected by the direction and position of the aneurysmal inflow and outflow, any morphological variation would easily lead to a different haemodynamic behaviour.
Based on the model in Fig. 8, the location of plane A in PC-MRI should have been closer to the junction area between the aneurysm sac and the RCPA than that in CFD and PIV. Thus, while the flow vortex in the aneurysm centre is the same as determined by PIV and CFD, the PC-MRI-measured planar velocity vectors close to the aneurysm wall present a distinct flow pattern of aneurysmal outflow, before the flow joins the main stream in the parent artery, which then enters the RPCA outlet on the right side of the figure. Despite the difference in the planar flow patterns, the overall prediction of the 3D flow pattern is in good agreement with that obtained from CFD, indicating the capability of PC-MRI to properly capture the global flow characteristics. In addition, the above-indicated discrepancies in the local flow predictions could be avoided with the adoption of an improved measurement resolution [28].
To exclude the portion of the velocity vector discrepancies that are due to the model morphological differences arising from MRA measurement, an extra CFD simulation was performed with the aneurysm model generated from MRA, and the velocity vectors resulting from that simulation were compared to the MRFD results, as shown in Fig. 9. With reference to Fig. 4, improved similarities between the flow patterns can be seen here, especially on the right side, where the bifurcation connects to the RPCA, and close to the concavity. This finding confirmed the influence of the model morphological differences on the velocity vectors reported in Fig. 8.
Velocity vector fields on plane A from CFD simulation with the MRA model and from MFRD processing of the PC-MRI results.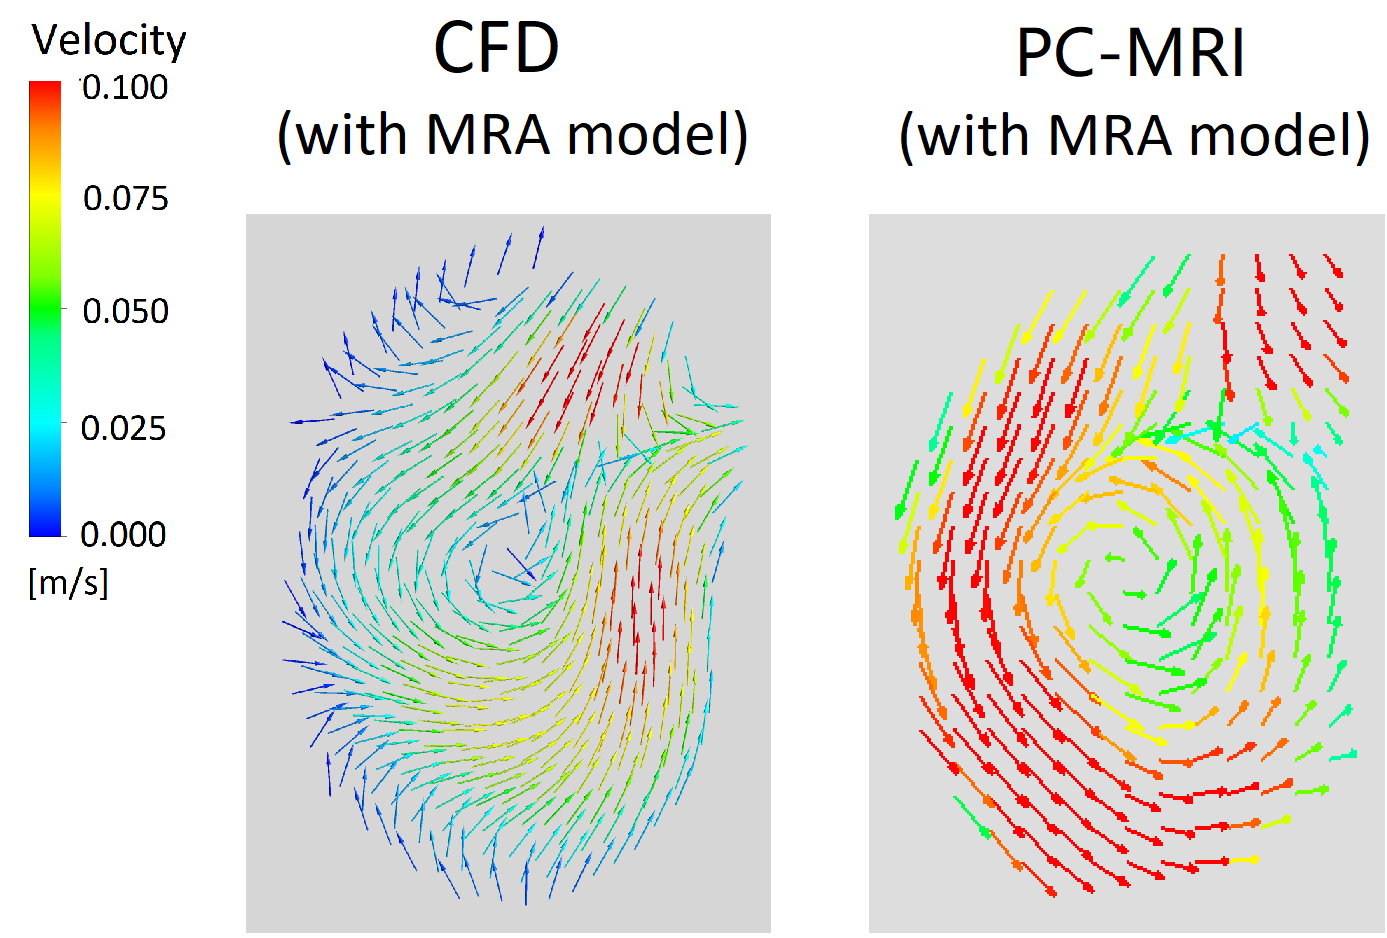
Through the investigation of aneurysmal haemodynamics determined by PIV, CFD and PC-MRI, the advantages and disadvantages for each technique were revealed.
As an optical method to visualise the flow movement in the target model, PIV can precisely capture the velocity vector field in fine resolution with the use of a high-speed digital camera, if the experimental system is properly established. Appropriate modelling of the silicone model and the BAF, matching the refractive index of the fluid with the material used for the in vitro model, and accurate calibration of pixel size in the post-processing are crucial steps affecting the validity of experimental results. In this study, the PIV analysis was only able to provide 2D velocity vector fields, due to the limitation of our 2D PIV experimental setup. With a 3D PIV system or a volumetric PIV system, the 3D planar velocity vector field or the flow pattern in a 3D fluid zone can be visualised; however, requirements for experimental setups would become more complex, with a need for more high-performance devices and more sophisticated calibration and post-processing techniques.
Compared to PIV, CFD is a more flexible tool that allows the 3D fluid behaviour to be precisely predicted, although the simulation requires necessary assumptions which may unavoidably idealise the modelling of fluid flow and the variations in the flow field. However, assumptions can be reasonably specified to avoid oversimplifications [29]. While it is important to define the boundary conditions to be as close as possible to the physical environment, in order to mimic the real flow field, some adjustments of boundary condition settings would be required in the best interests of calculation. For example, in the present CFD simulations, in order to achieve a converged calculation, a traction-free boundary condition at zero pressure was set for the BA inlet, instead of the actual flow rate measured from patients (which was used for the physical flows in the other two methods), whilst CFD boundary conditions for outlets followed the measured flowrates. However, the resulting inflow and outflows were calculated and compared to the measured flowrates afterwards, to validate the choice of boundary conditions. In a nutshell, such boundary conditions should be carefully adjusted to ensure that they would not create an unrealistic flow environment, thereby leading to discrepant flow behaviours.
For PC-MRI, while the 3D flow field is obtained without flow assumptions or compromised boundary conditions, the resolution is not as fine as that of the other two approaches, due to the current technological limitations [16]. For geometries of larger scale that do not have such small morphological features as patient-specific cerebral aneurysms, PC-MRI would be capable of capturing the flow patterns. For models with similar scales and complexities to the model used in the present study, although the measured 3D streamlines could provide a reasonable idea of the global flow pattern, adopting a finer resolution in respect of the smallest geometrical details would result in more precise local flow patterns.
Limitations
It is difficult to create flow environments for in vitro measurement and numerical simulation that are 100% identical, although the fluid flow behaviour may be sensitive to its surroundings. For example, in vitro models and batches of working fluid may present slight variations stemming from different times of production. However, in the present study the aneurysm model and the working fluid were kept consistent in terms of both the mechanical properties and the fluid properties [30].
Considering the facts that high flow rates – leading to high Reynolds numbers – might require the assumption of turbulent flow, rather than laminar flow, in a CFD simulation (albeit depending on flowrate and geometry), and that a wide range of velocities might still challenge the PIV algorithm [31], we should be aware that different inflow conditions may create unexpected problems for each method. This means that a wider range of inflow conditions for this validation study could help to examine the performance of each approach from a more comprehensive perspective. Besides that, it would be meaningful to compare the flow pattern on different target planes, and thereby investigate the agreement between these methods in relation to different local morphological complexities.
All experiments were performed under a steady-state flow condition, without consideration of pulsatility, as the intracranial blood vessels have negligible pulsation over the cardiac cycle. Other studies have demonstrated that despite small variations of the local flow due to pulsatile flow behaviour, steady-flow simulation provides a good approximation of time-average velocity magnitude in intracranial aneurysms [32], and the instantaneous shear stress and flow rate in a pulsatile flow regime can be estimated reasonably well from a steady-flow simulation [33]. It is also reported that steady-state models provide reasonable estimates for the time-averaged haemodynamics of true pulsatile flow [34].
Due to some systemic limitations, the aneurysmal flow patterns from different methods were only compared on a single target plane, at a given inflow condition in this study. However, the adopted inflow rate could be regarded as a representative level within the range of the average flow rate in human cerebral arteries; further, the selected measurement plane was located at the critical section around the aneurysm neck, where the morphology is highly complex. In view of the above-mentioned facts, we believe that the findings from this study could be representative and useful as a preliminary research outcome, even with limited flow scenarios. Studies with a more comprehensive scheme should be carried out in future work.
As resolution and precision for each method varies, the accuracy of each result can be affected. However, we performed a mesh-dependency test for the CFD simulation to provide assurance as to the simulation accuracy, a fine resolution corresponding to the best performance of the high-speed camera was adopted for PIV, and the measurements from PC-MRI also used the highest available resolution.
Conclusions
Herein we investigated the flow pattern in a patient-specific cerebral aneurysm using both experimental and numerical approaches that are commonly adopted in fluid dynamics studies – PIV, CFD and PC-MRI – and compared the cross-sections, planar velocity vector fields, and 3D streamlines obtained from those methods. The flow patterns from PIV and CFD show good agreement, in terms of the 2D velocity vectors and the in-plane velocity magnitudes. Moreover, the 3D flow pattern obtained from PC-MRI shows good similarity to that from CFD. Through these comparisons, the outcomes of CFD simulation have been quantitatively validated against experimental observations, and the results give confidence for future haemodynamic studies using CFD technology, which would better assist surgical planning and treatment strategy evaluation for intravascular disorders before and after clinical operation.
This work also provides a vital foundation for future validation studies, as the reported agreements and inconsistencies between different approaches have preliminarily revealed each method’s advantages and drawbacks. Based on this, improvements can be made to further validate analyses by these methods in a more comprehensive assessment. Moreover, deeper understanding of these research methods is beneficial for future aneurysmal haemodynamic investigations, as it might contribute to adoption of better-justified research approaches and protocols.
Footnotes
Acknowledgments
We acknowledge financial support received from the ImPACT Program of the Council for Science, Technology and Innovation (Cabinet Office, Government of Japan). This work was also supported by the JSPS KAKENHI programme (Japan Society for the Promotion of Science, Grants-in-Aid for Scientific Research) (Grant Number 25293264). We thank Prof. Osamu Sasaki and Dr. Harumasa Kano for their technical support in MicroCT scanning at the Museum of Natural History, Tohoku University.
Conflict of interest
The authors have not identified any conflict of interest to be disclosed regarding the publication of this paper.