



Abstract
BACKGROUND:
Autonomic function can be estimated non-invasively using heart rate variability (HRV). HRV of patients undergoing coronary artery bypass grafting (CABG) is investigated in time-domain and frequency-domain before and after CABG to study the effect of operation on the status of patients.
OBJECTIVE:
The main purpose of this work is to evaluate the effect of CABG surgery on patients with ischemic heart disease (IHD) before operation, and to monitor the status of patients on day 6 and day 30 after the CABG operation.
METHODS:
The statistical signal characterization (SSC) technique is used in this work in order to derive different morphology-based parameters to indirectly describe time-domain and frequency-domain HRV parameters in 24 patients undergoing CABG operation, before the operation (Group 1: G1), 6 days after operation (Group 2: G2) and 30 days after operation (Group 3: G3). The data is obtained from the Sultan Qaboos University Hospital in Oman.
RESULTS:
The SSC parameters Mean(mt) and Mean(dt) are reduced in all 24 patients and in 23 out of 24 patients in G2 compared to G1 (6-days after operation compared with before operation), respectively. Comparing G3 to G1 the reduction in Mean(mt) and Mean(dt) is noted in 18 of the 24 patients.
CONCLUSIONS:
The parameters Mean(mt) and Mean(dt) are successful parameters to follow the HRV for patients undergoing CABG surgery. A relation between those SSC parameters and the HRV time-domain and frequency-domain parameters is investigated in this paper to understand the physiological behavior of the patients.
Introduction
Coronary artery bypass grafting (CABG) is a form of bypass surgery that can create new routes around narrowed and blocked coronary arteries, permitting increased blood flow to deliver oxygen and nutrients to the heart muscle. Heart rate variability (HRV) measurements provide a low-cost, widely available, noninvasive method for assessing cardiac autonomic function in coronary heart disease patients. The HRV functions can be studied in the time domain, by statistical measures of the variations in the R–R interval durations, and in the frequency domain, through different spectral analysis techniques [1].
Many researchers in their newly published papers indicate the variation of HRV after CABG and show the clinical importance of their findings [2, 3, 4, 5, 6]. It has been shown that because of the power of the very low frequency (VLF), low frequency (LF) spectral components were decreased after CABG in 49 patients, but the high frequency (HF) power did not show any significant change [7].
There is an increasing recognition of HRV parameters as powerful independent predictors of many cardiovascular pathological conditions [4]. A study recorded autonomic functions in patients undergoing CABG on day 3, 6, 15, 30, 60 and 90 and compared that with pre-CABG HRV [8].
In the research by Hossen et al. [9], the soft-decision power spectral estimation technique based on wavelet-decomposition [10, 11, 12] was implemented successfully in investigating patients before and after CABG. The results show an improvement of HRV parameters (6 day after CABG) and (30 days after CABG) compared to HRV parameters before CABG for patients at the Sultan Qaboos University Hospital in Oman. A previous study [13] revealed that recovery of autonomic following CABG could occur as early as 30 sdays after surgery using the same data used in the study by Hossen et al. [9]. There was a significant increase in HF (vagal component) from preoperative to day 6 values (46.09 vs. 66.52,
The main purpose of this work is to study the influence of CABG in patients by investigating the statistical signal characterization (SSC) parameters of their HRV signals before CABG and 6 days and 30 days after CABG. This longitudinal study will measure pre-CABG autonomic parameters and follow them on day 6 and day 30 after the operation. Results will be shown for individual patients and as mean values for all patients using the same data used in the studies by Hossen et al. [9] and Al-Hashmi et al. [13].
The spectrum of HRV or RRI data is divided into three bands: VLF (
The rest of the paper is organized as follow: In Section 2, the data used in the work is described. In Section 3, the methods implemented in the work are investigated. Section 4 contains the main results of SSC parameters of patients’ HRV before and after CABG. Section 5 includes the interpretation of the results by relating them to the time-domain and frequency-domain parameters of HRV signals. Section 6 concludes the work.
Materials and methods
Twenty-four patients (21 males, 3 females) were included in this study. Patients were selected by the Department of Cardiothoracic Surgery at Sultan Qaboos University Hospital. After signing the informed consent form, history taking and physical examination were done by the cardiothoracic surgeon. Then, heart rate variability measurements were done using Task Force Monitor (CNSystems, Graz, Austria) [14] in the morning (7 am–12 pm). Task force monitoring was repeated on day 6 and day 30 after surgery. Information about patients’ age, weight, sex, BMI, and body surface area is listed in Table 1. Table 2 shows the clinical history of all 24 patients in the CABG study.
Mean and standard deviation of data (21 male and 3 female)
Mean and standard deviation of data (21 male and 3 female)
Clinical history information of the 24 patients in the CABG study
The Statistical Signal Characterization (SSC) method [15, 16] is applied on the HRV signal. The background of this approach is briefly explained in the following subsection.
Statistical Signal Characterization
SSC is characterized by a waveform not only as a function of the frequencycomponent amplitudes but also as a function of the relative phases of its frequency components [16]. The input waveform to the SSC process is basically divided into segments where each segment is bounded by two extrema: maxima and minima, as shown in Fig. 1. The segment amplitudes
Segments amplitudes and time characteristics.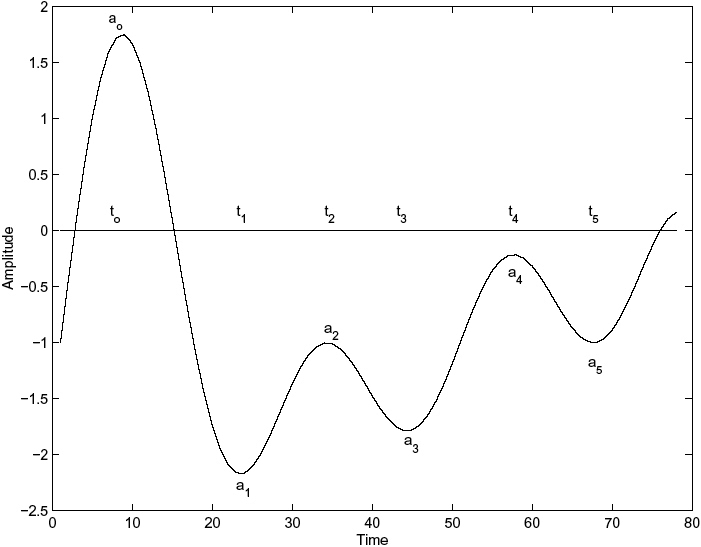
Segment amplitude of the n-th segment:
where
Segment period of the n-th segment:
where
Mean(dt) for G1 and G2.
Mean(mt) for G1 and G2.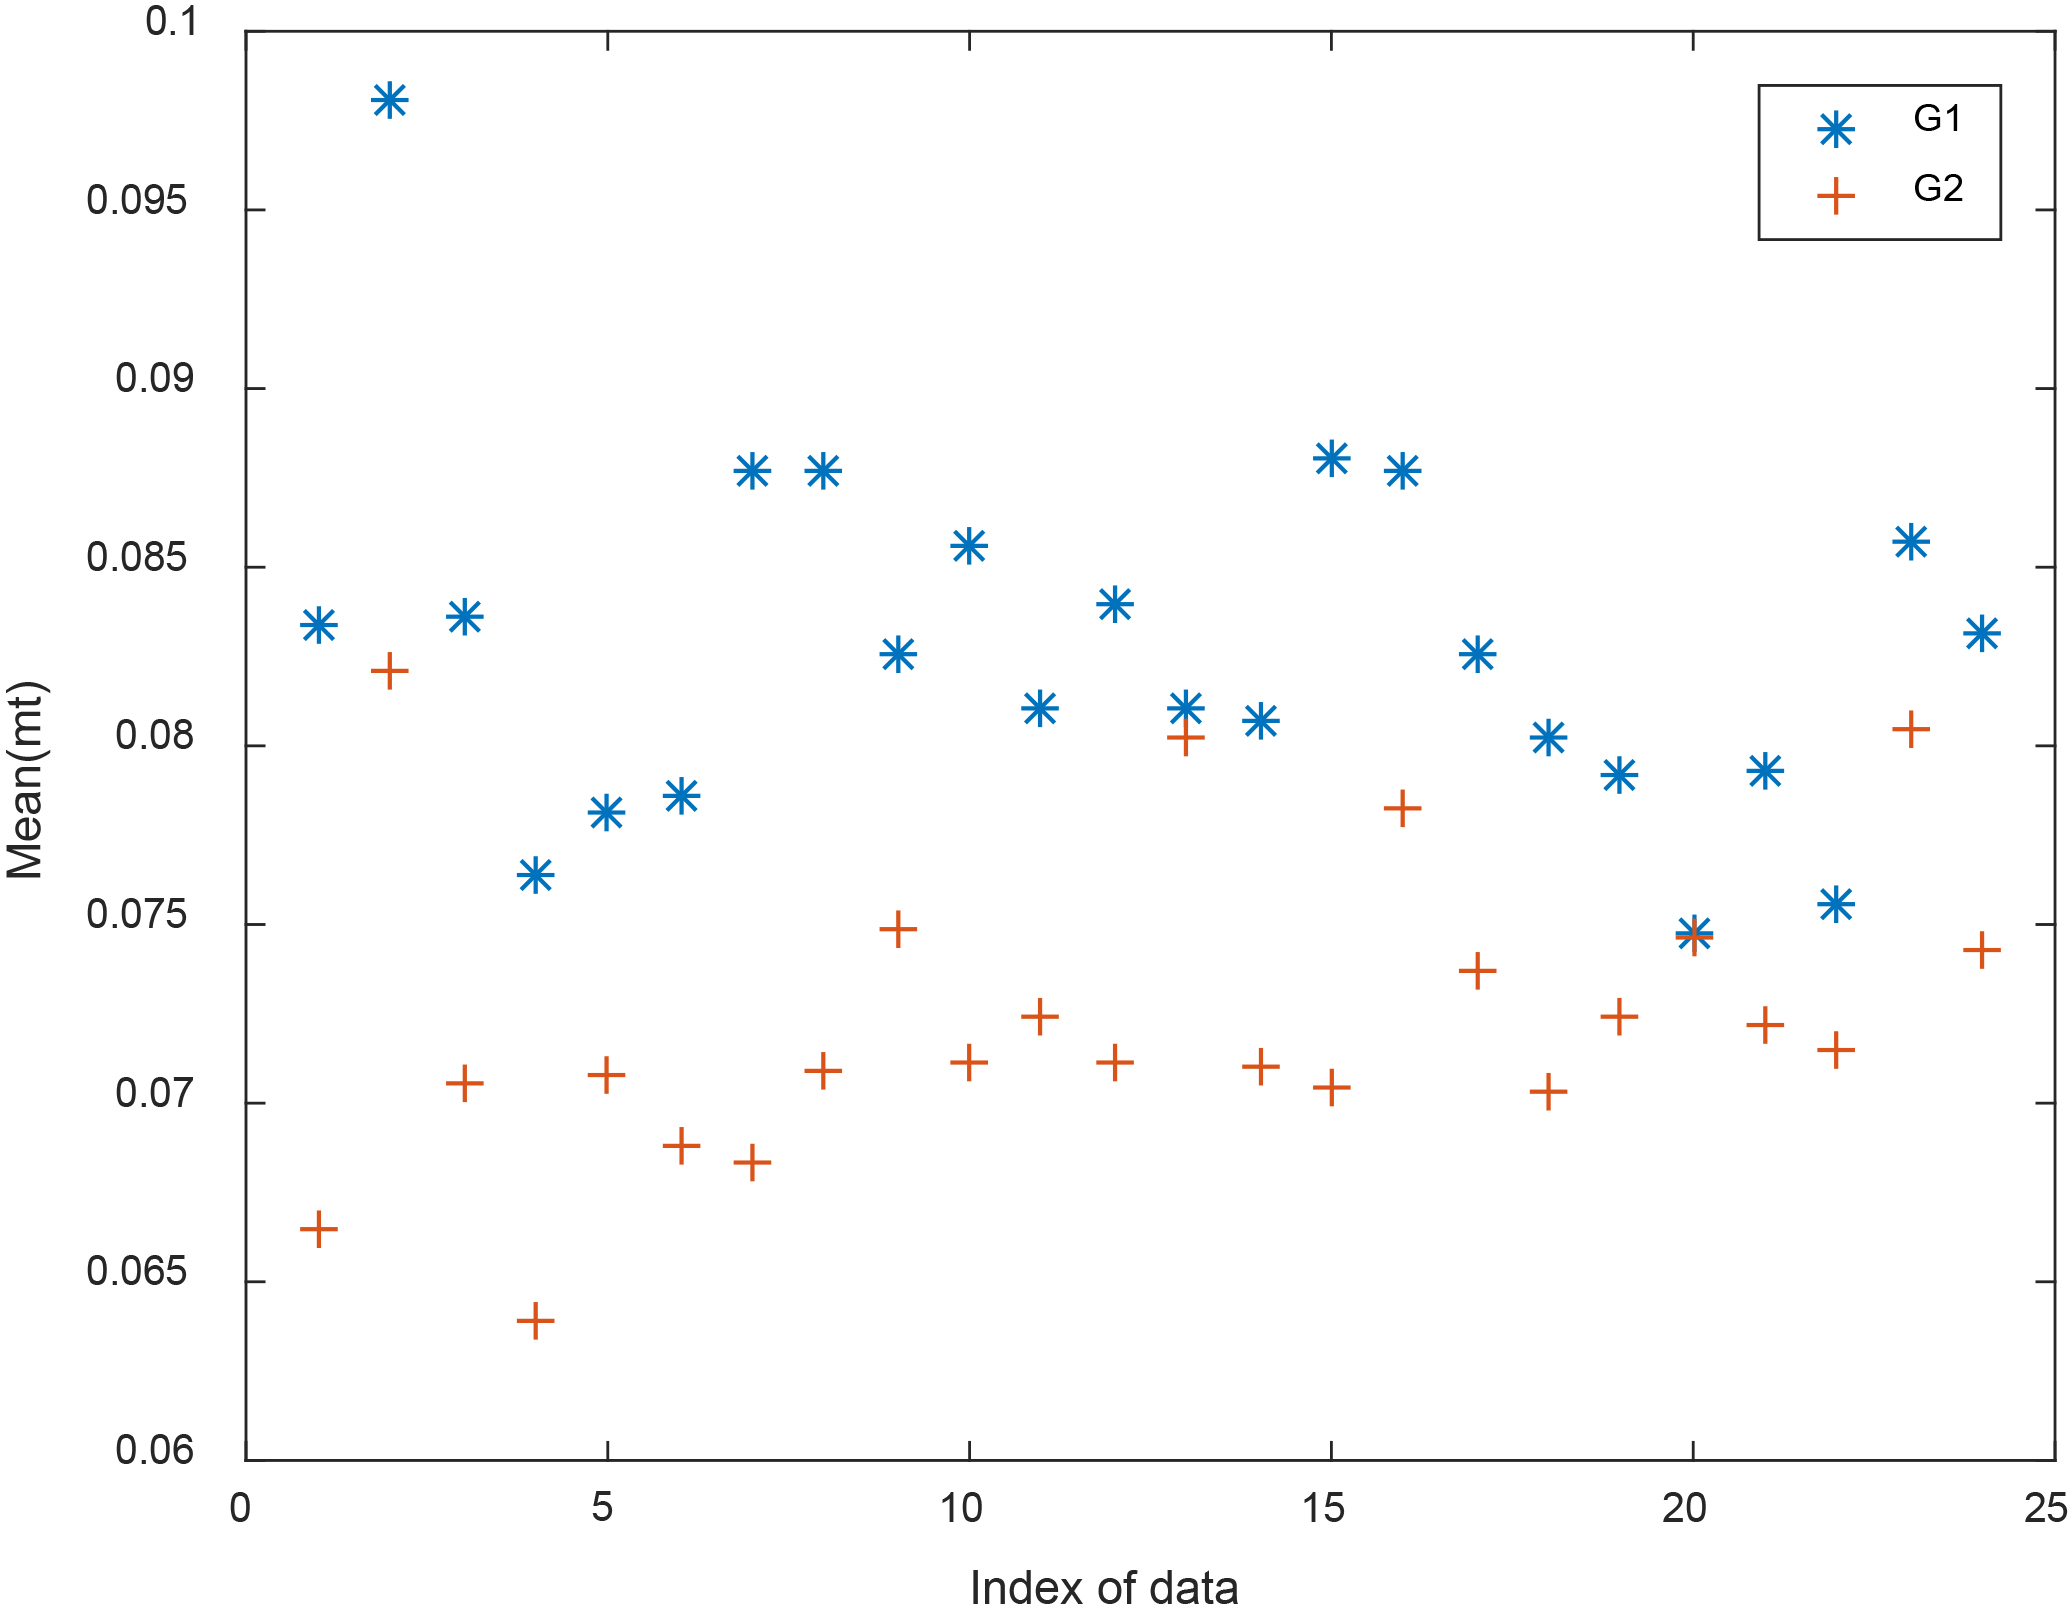
Four SSC parameters can then be computed from the amplitude and period vectors of the signal under consideration. These parameters are the amplitude mean (ma), the period mean (mt), the amplitudemean deviation (da), and the periodmean deviation (dt):
Mean(da) for G1 and G2.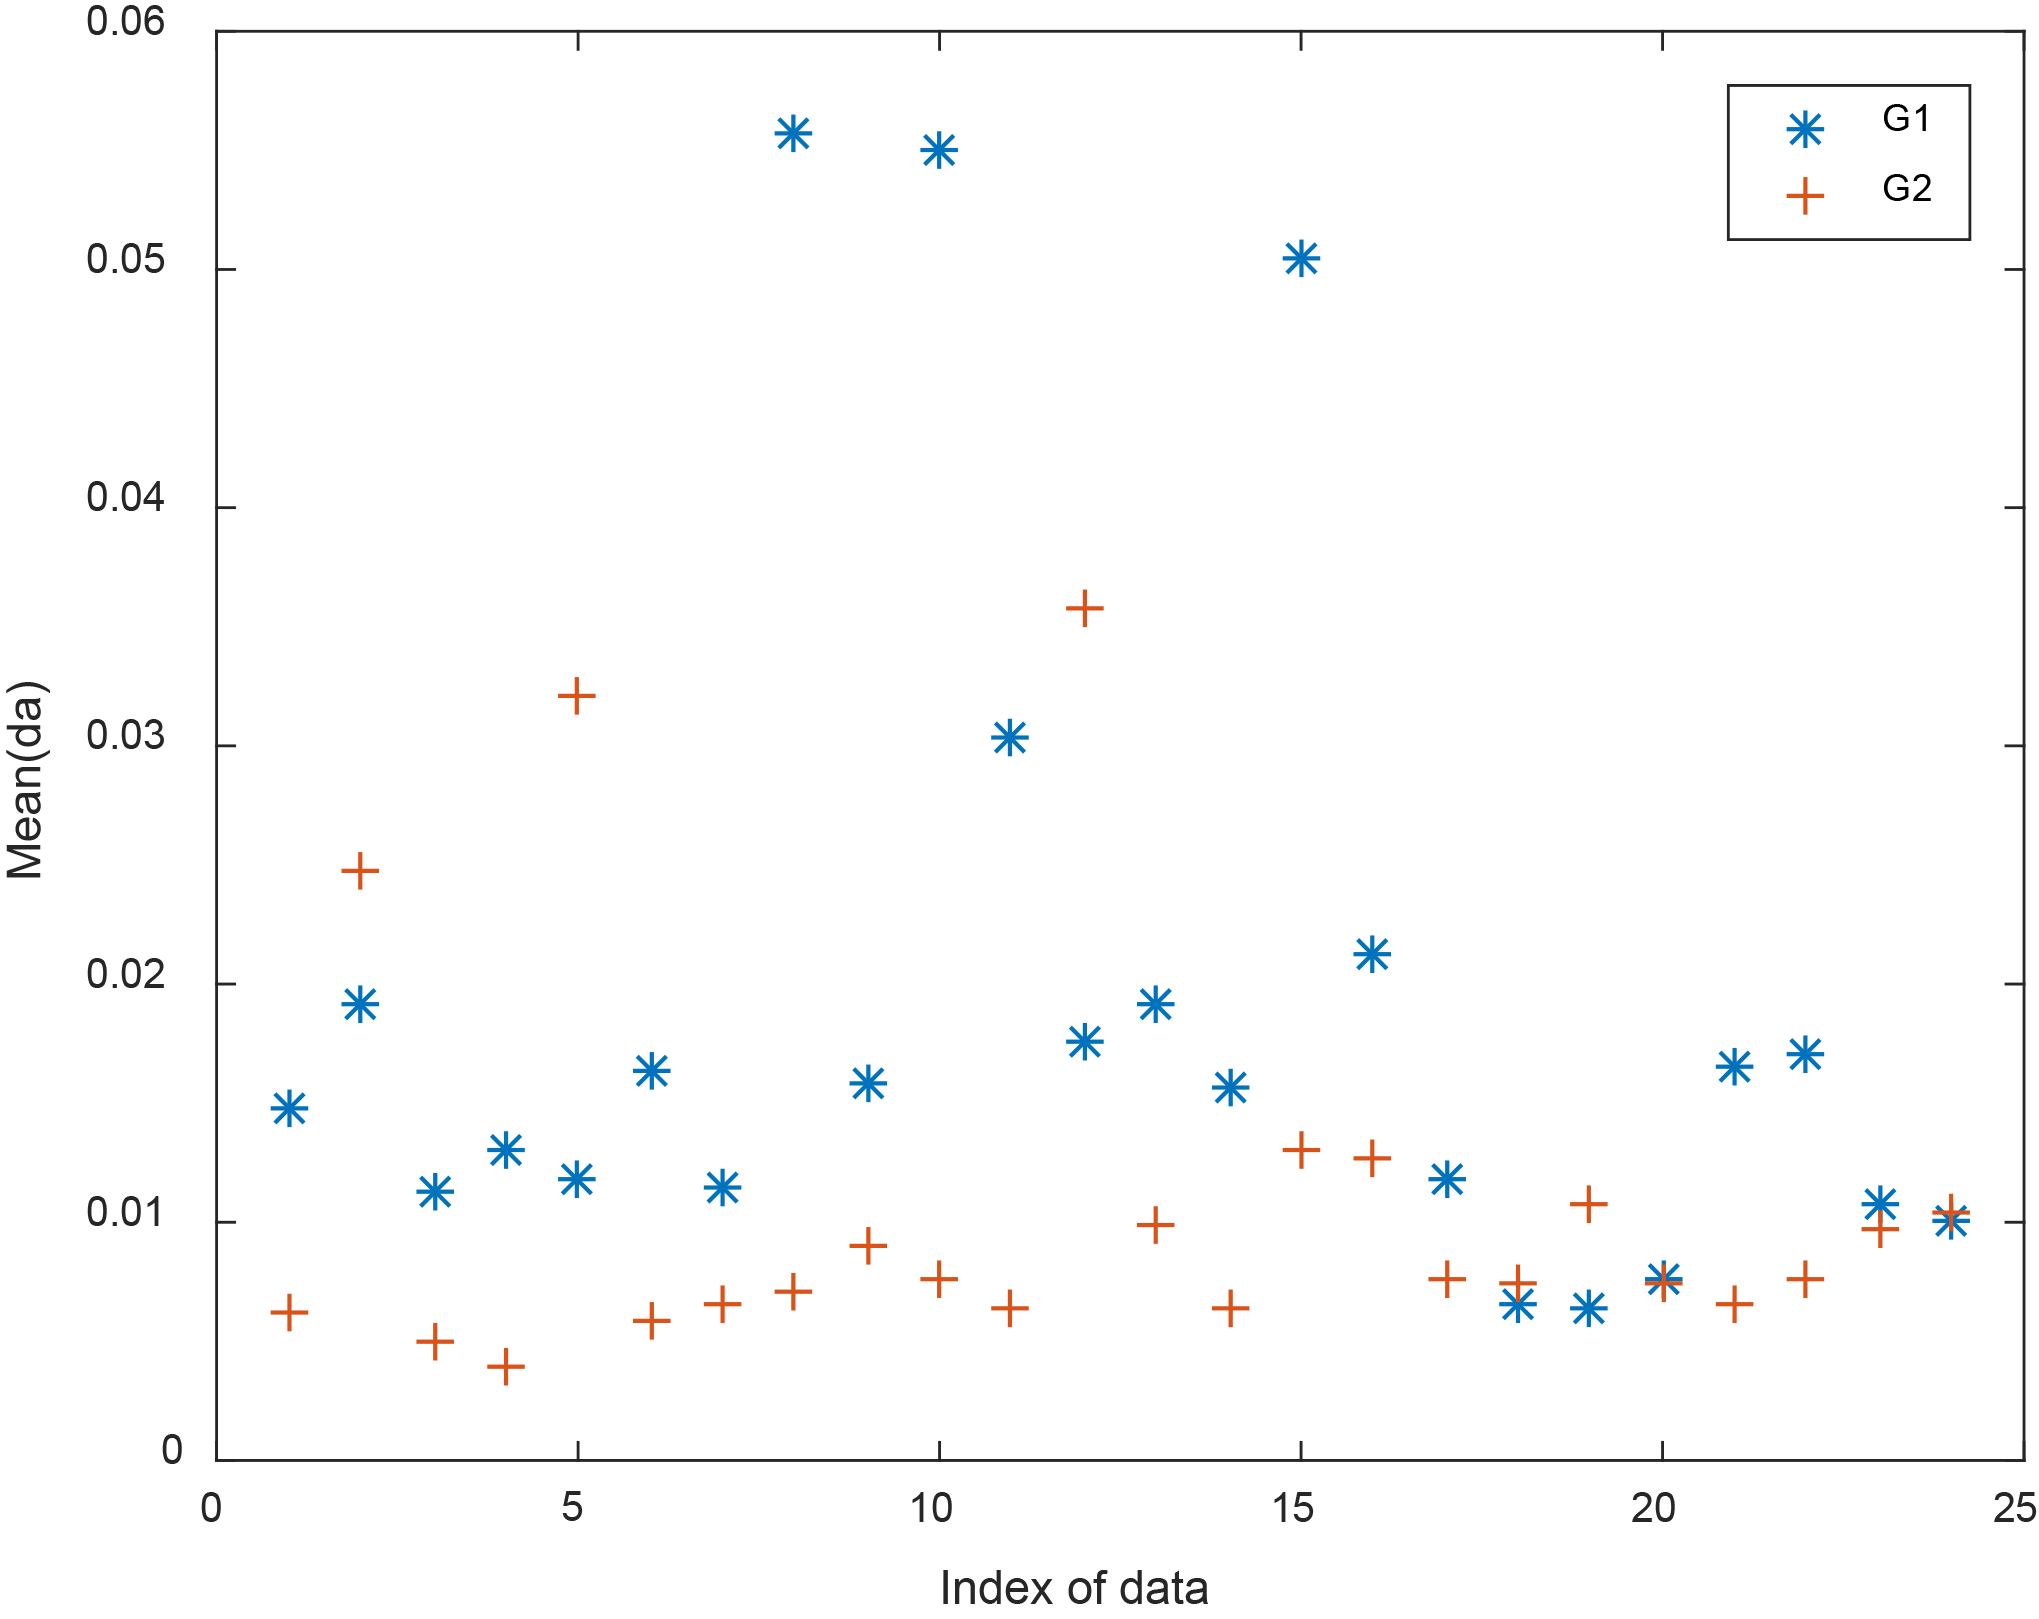
Mean(ma) for G1 and G2.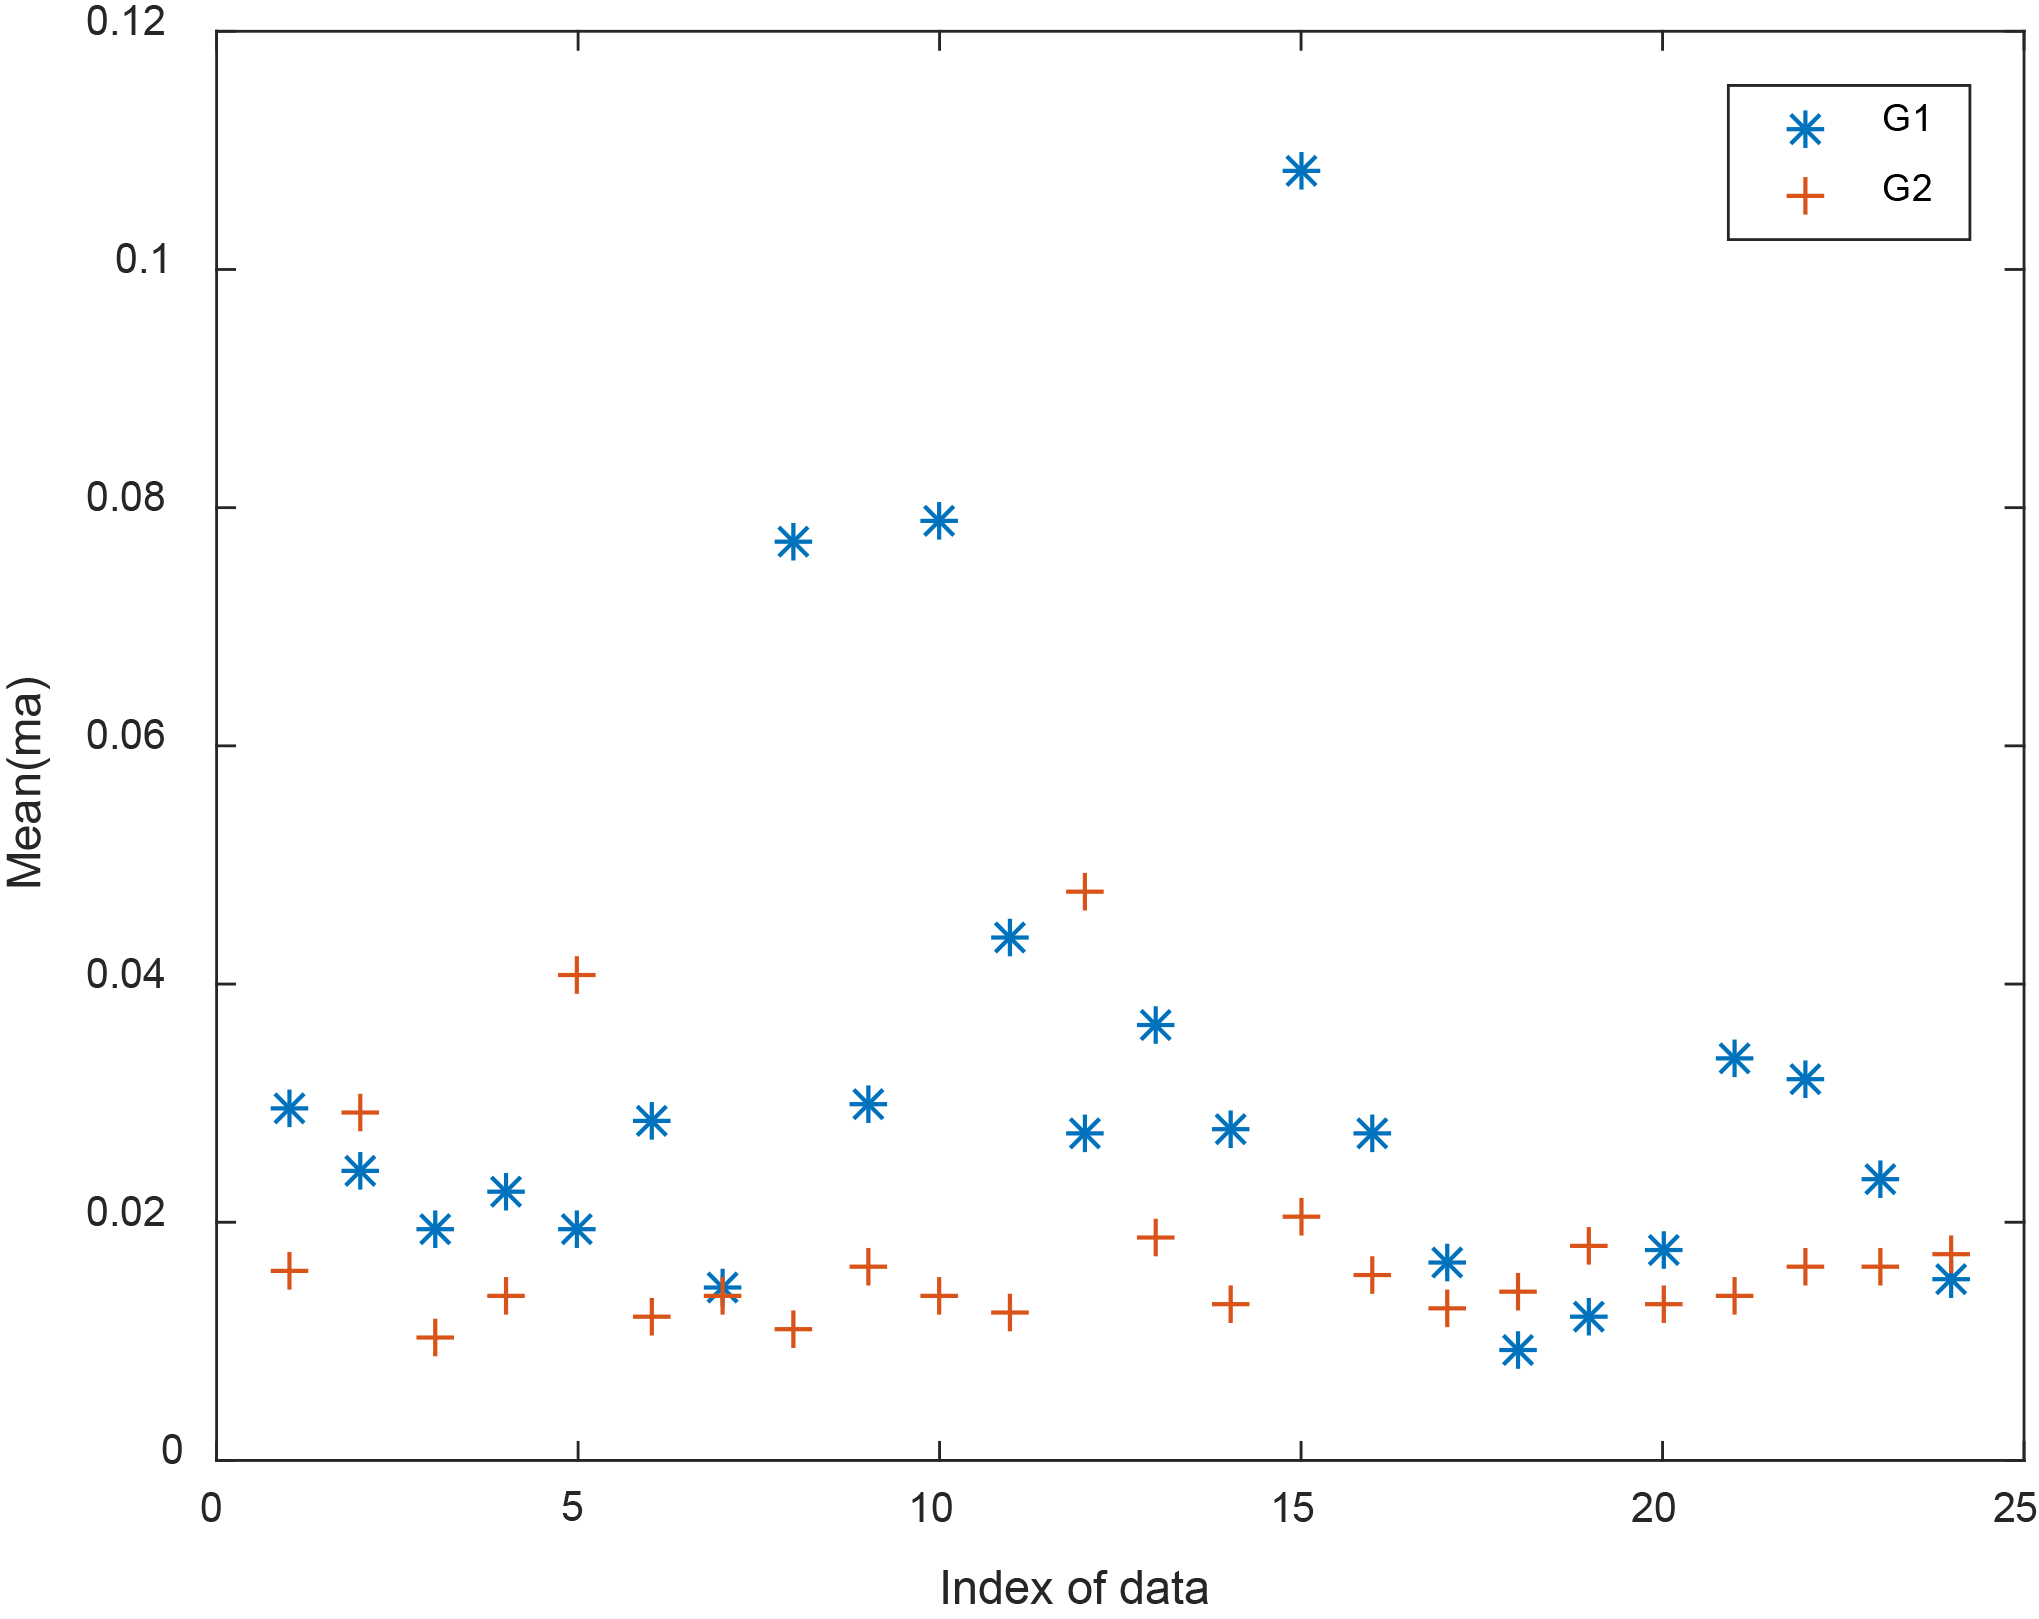
In our work, the time-domain signal is divided into 40 sections. The four SSC parameters are used to derive new 4 parameters computed as average of the main SSC parameters of the 40 sections:
Average of amplitude mean: Mean(ma) Average of amplitude-mean deviation: Mean(da) Average of period-mean: Mean(mt) Average of period-mean deviation: Mean(dt)
The four parameters Mean(dt), Mean(mt), Mean(da), Mean(ma) are obtained for G1 and G2 groups and compared in Figs 2–5, respectively. It can be seen that values of the parameters of G1 are greater than the values of the parameters of G2 in most of the patients, especially in Figs 2 and 3.
Figures 6–9 show the four parameters Mean(dt), Mean(mt), Mean(da), Mean(ma) for G1 and G3.
It can also be seen that values of the parameters of G1 are greater than the corresponding values of G3 in most of the patients, especially for Figs 6 and 7.
Mean(dt) for G1 and G3.
Mean(mt) for G1 and G3.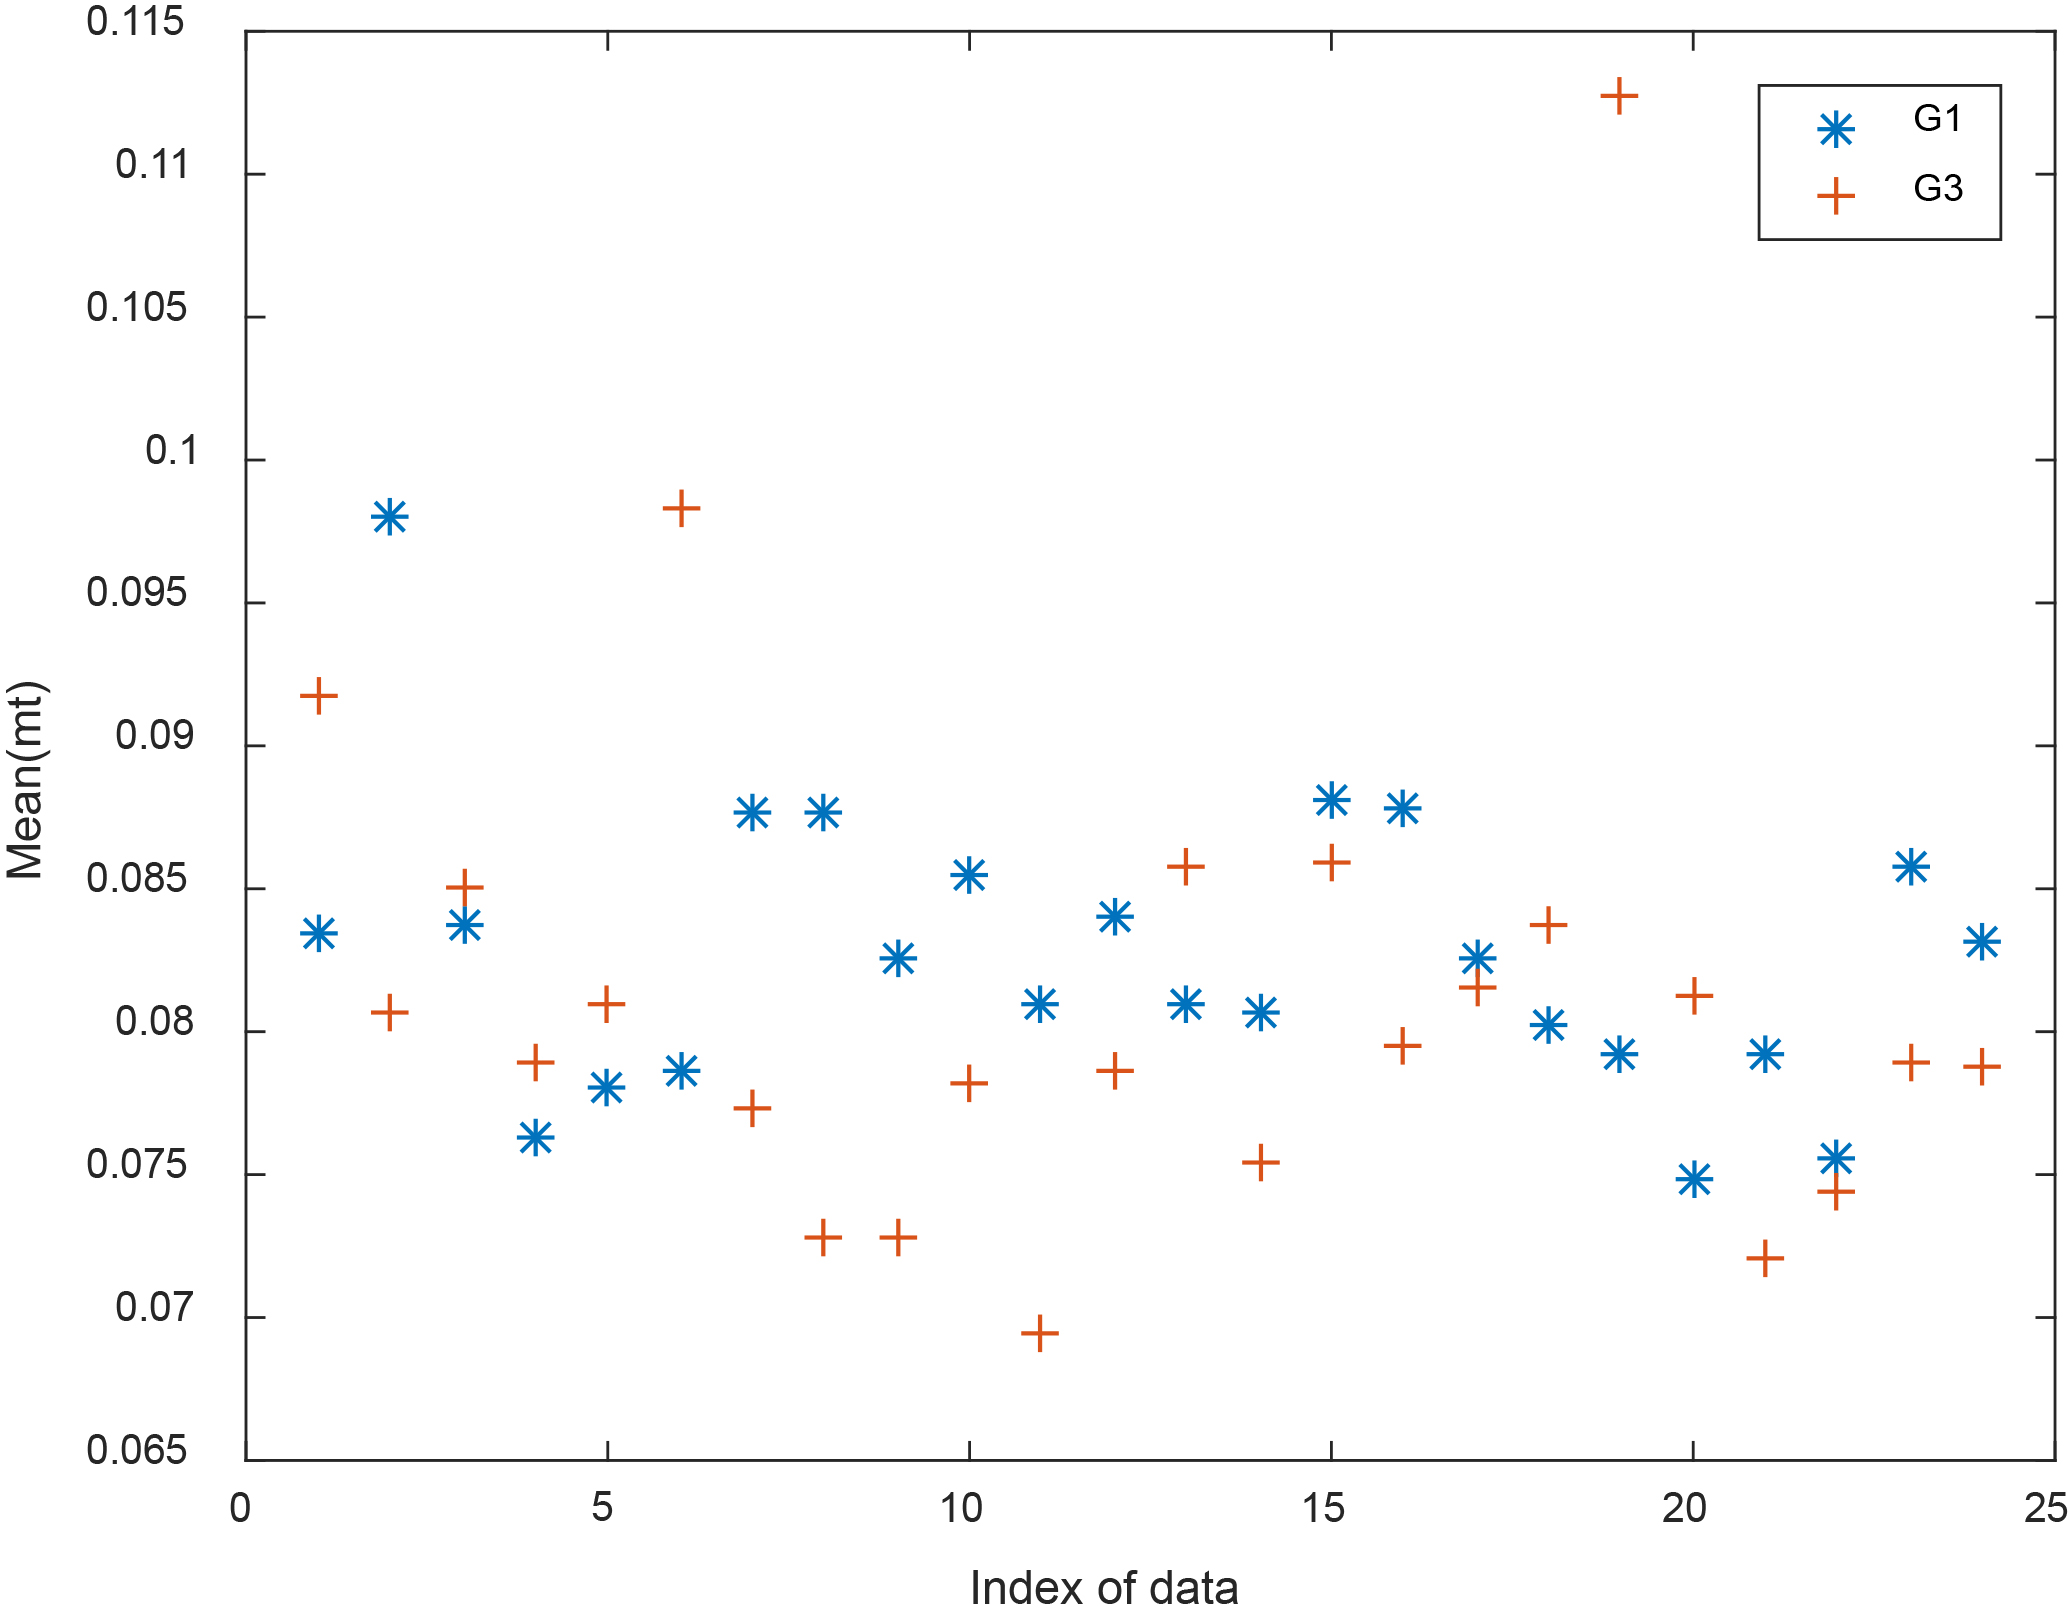
Mean(da) for G1 and G3.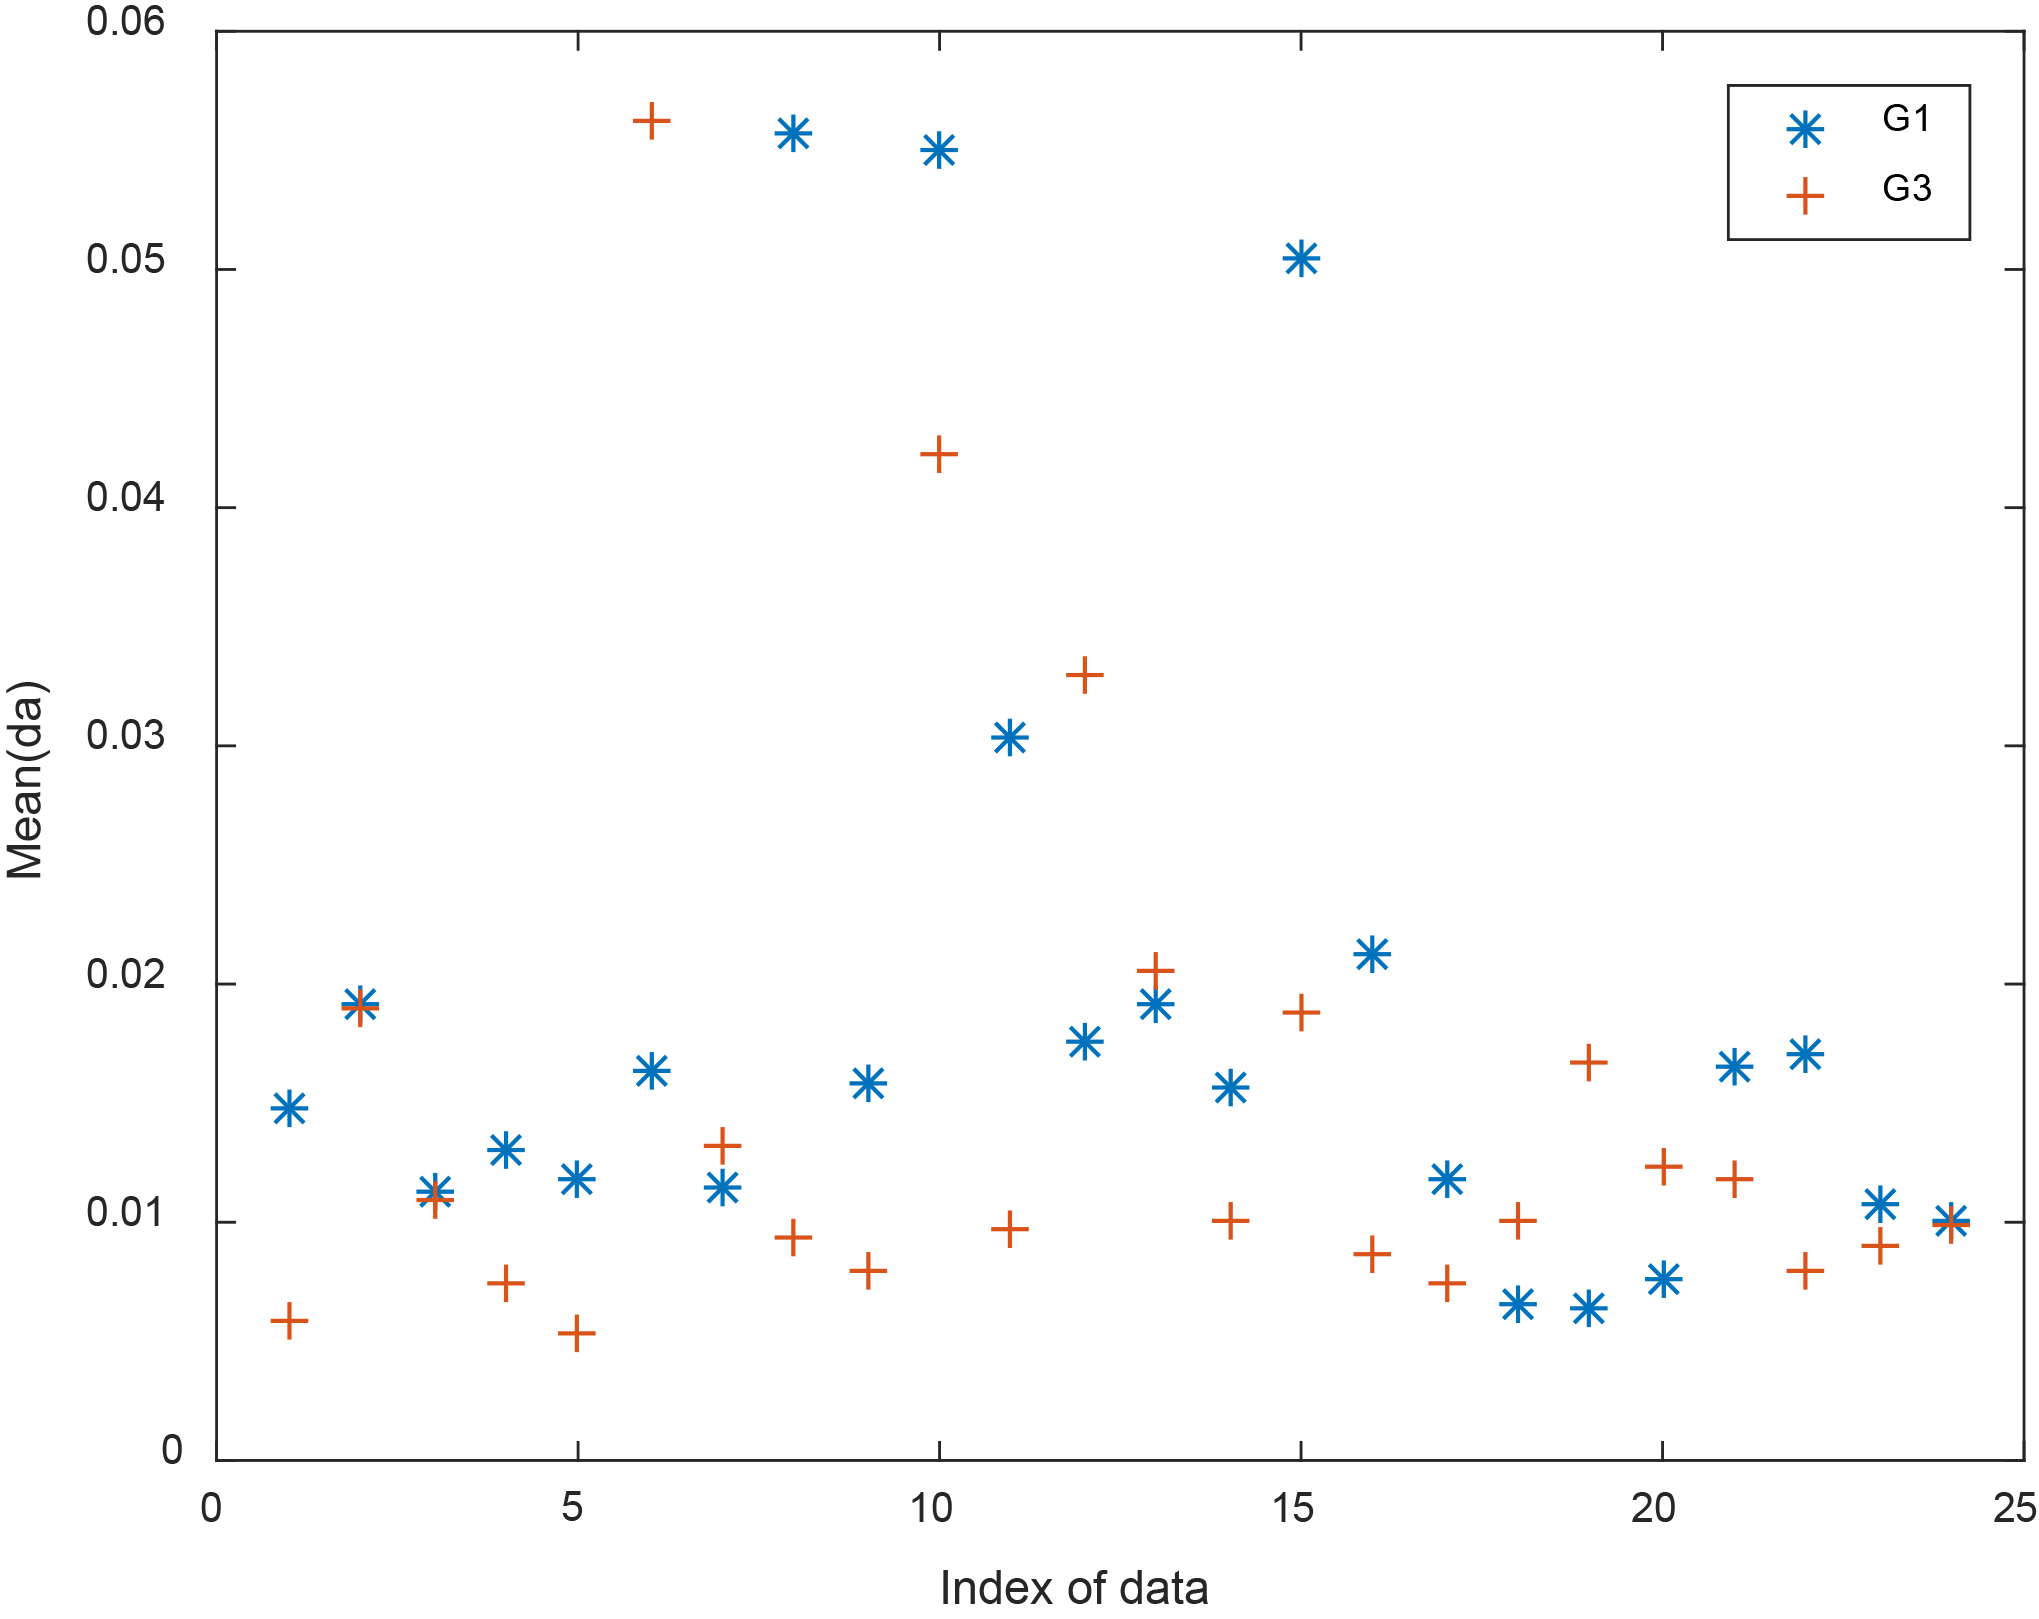
Tables 3 and 4 list all the individual values for Mean(dt) and Mean(mt), respectively, for G1, G2, and G3. The values of Mean(dt) in Table 3 show that the parameter Mean(dt) in G2 is reduced in 23 out of 24 patients compared to G1. Table 4 shows that the values of Mean(mt) are reduced in G2 in all 24 patients compared to G1.
Results of Mean(dt) in G1, G2, and G3
Mean(ma) for G1 and G3.
Results of Mean(mt) in G1, G2, and G3
In the study by Hossen [15], the physiological interpretation of the SSC parameters has been derived using a mathematical model system for the spectrum of the time-domain signal (HRV) of different levels of sleep apnea. It has been concluded that the SSC parameters of the HRV spectral follow the same variation of the HF power of the HRV spectral (directly proportional) and the opposite variation of the LF power of the HRV spectral (inversely proportional). So, the SSC parameters decrease with the apnea level (more in normal than in mild, and more in mild than in moderate, and more in moderate than in severe OSA patients).
The case of our paper here is a little different as we are looking at the interpretation of the SSC parameters derived from the HRV signal directly (not its spectrum) before and after CABG operation. It has been shown that the SSC parameters of the HRV signal directly have an opposite effect compared to the SSC parameters of the spectrum of the HRV signal.
Table 5 shows the mean and standard deviation of all four SSC parameters for all 24 patients in the three groups. It is clear that all mean values are reduced in G2 and G3 compared to G1. The reduction in G2 is more compared to G3. Table 6 shows the frequency-domain HRV parameters for the three groups. The behavior of the SSC parameters is similar to the behavior of the LF and VLF components of the HRV spectrum. The SSC parameters are showing opposite variation compared to the HF component. The LF and VLF components are expected to be reduced after a successful operation, while the HF component is expected to be increased.
Mean and standard deviation of the different SSC parameters for G1, G2 and G3
Mean and standard deviation of the different SSC parameters for G1, G2 and G3
Mean of the different HRV frequency domain parameters for G1, G2 and G3
Table 7 shows the time-domain parameters for the three groups. Since the SDNN parameter is equivalent to the total power and this value from Table 7 is not equal in all the three groups, we need to normalize SDNNI and RMSDD with respect to SDNN in all the three groups. Table 8 shows the normalized values of SDNNI and RMSDD in the 3 groups. By investigating the values in Table 8, we notice that the values of SDNNI (equivalent to LF component) is reduced in G2 and G3 compared to G1. The values of RMSDD (equivalent to the HF component) is increased in G2 and G3 compared to G1. Such a conclusion is identified also from Table 6.
It can be concluded here that the SSC parameters are directly proportional to the LF component of the HRV frequency-domain parameter and SDNNI of the HRV time-domain parameter and the SSC parameters are inversely proportional to the HF component of the HRV frequency-domain parameter and RMSDD of the HRV time-domain parameter.
An important remark that must be considered with HRV time domain parameters SDNNI and RMSDD, is that those values must be divided by SDNN (total power) before comparison in different groups.
Mean values of HRV time-domain parameters for G1, G2 and G3
Mean values of HRV time-domain normalized parameters for G1, G2 and G3
The statistical signal characterization technique describing the morphology of the signal is used in this paper to study the HRV of 24 patients who underwent a CABG operation. The four SSC parameters, Mean(dt), Mean(mt), Mean(da), and Mean(ma), are used to monitor 24 patients undergoing CABG operation, before CABG (G1), on day 6 (G2) and on day 30 (G3) after CABG, respectively. The study provides the results for individual patients and in terms of the mean and standard deviation of all 24 patients.
To understand the results of the SSC parameters, both frequency-domain and time-domain features of the HRV signal are obtained for the three groups. The results show a reduction in the SSC parameters (mean and individual) in G2 (6 day after operation) and G3 (30 day after operation) compared to G1 (before CABG). This reduction is considered as an improvement by reduction of the LF and increase in the HF frequency-domain parameters. These findings are in accord with the decrease of SDNNI and increase in RMSSD time-domain parameters.
Such results indicate the recovery after CABG operation in G2 and G3 compared to G1.
This study raises the importance of normalization of the time-domain HRV parameters in monitoring of patients or in diagnosis. This study adds new information obtained from the morphology of the HRV signal to the information obtained by both time-domain and frequency-domain parameters. Thus, such a new non-invasive biomedical signal processing technique becomes necessary in the analysis of HRV of patients posted to CABG surgery before and after the surgery in order to evaluate the risk factor after surgery and to predict the recovery status of patients before and after discharge from the hospital in Oman.
It should be noted that there is a need to have other readings of HRV after CABG, other than on day 6 and on day 30, may be on day 15 and on day 60, or even later to reflect the long term effect of CABG on HRV values. A study limitation is that the data is of small size for a final conclusion. A neural network can be used to combine all the three types of HRV parameters (SSC, time-domain, frequency-domain) to provide better prediction of the status of patients undergoing CABG.
Footnotes
Acknowledgments
The author would like to thank Sultan Qaboos University Hospital for providing the data.
Conflict of interest
None to report.