



Abstract
BACKGROUND:
Simplified and easy-to-use monitoring approaches are crucial for the early diagnosis and prevention of obstructive sleep apnea (OSA) and its complications.
OBJECTIVE:
In this study, the OSA detection and arrhythmia classification algorithms based on single-channel photoplethysmography (PPG) are proposed for the early screening of OSA.
METHODS:
Thirty clinically diagnosed OSA patients participated in this study. Fourteen features were extracted from the PPG signals. The relationship between the number of features as inputs of the support vector machine (SVM) and performance of apnea events detection was evaluated. Also, a multi-classification algorithm based on the modified Hausdorff distance was proposed to recognize sinus rhythm and four arrhythmias highly related with SA.
RESULTS:
The feature set composed of meanPP, SDPP, RMSSD, meanAm, and meank1 could provide a satisfactory balance between the performance and complexity of the algorithm for OSA detection. Also, the arrhythmia classification algorithm achieves the average sensitivity, specificity and accuracy of 83.79%, 95.91% and 93.47%, respectively in the classification of all four types of arrhythmia and regular rhythm.
CONCLUSION:
Single channel PPG-based OSA detection and arrhythmia classification in this study can provide a feasible and promising approach for the early screening and diagnosis of OSA and OSA-related arrhythmias.
Introduction
Obstructive sleep apnea (OSA) is a high-prevalence sleep disorder characterized by repetitive episodes of partial or complete closure of the upper airways during sleep and affects 6%–17% of the general adults and 49% of the elderly over 65 [1]. Considerable evidence has verified that recurrent apnea events in OSA patients could cause hemodynamic, autonomic and biochemical alterations [2, 3] which may initiate and maintain the various types of arrhythmia [4, 5] such as ventricular premature beat (VPB), supraventricular premature beat (SVPB), and atrial fibrillation (AF). As a result, the risk of stroke, acute myocardial infarction and even sudden cardiac death (SCD) increases significantly [6, 7, 8]. What is worse, both OSA and arrhythmias could be asymptomatic and are thus often not diagnosed until the occurrence of a severe complication. It has been reported that nearly 46% of the SCDs coincide with OSA [9]. Therefore, early screening of OSA and arrhythmia is critical to reduce cardiovascular morbidity and mortality.
However, there is an extreme shortage of practical approaches for the detection of OSA and arrhythmia. The standard diagnostic device for OSA [10] polysomonography (PSG) is expensive, complex and difficult to access. As a result, nearly 93% of women and 82% of men suffering from OSA remain undiagnosed [11]. Due to the insufficient awareness of the pathological link between OSA and arrhythmia, newly developed portable devices are usually designed for detecting either of the disorders. Due to the growing health and economic burdens [12], simplified and easy-to-use monitoring devices for the early screening of OSA and its related arrhythmias are urgently needed [13, 14].
With the recent emergence of numerous wearable monitoring technologies [15, 16] photoplethysmography (PPG) has received much attention due to its low-cost, acceptability, and richness of physiological information [17]. PPG optically measures the blood volume variations in the micro-vascular bed and indirectly reflects the respiratory activity. Since the frequency of disordered breathing events during sleep, defined as the apnea-hypopnea index, has been widely accepted as the criterion of clinical diagnosis of normal or OSA patients with different severity, detection of apnea events is the focus for sleep monitoring. For this reason, various combinations of PPG features have been applied to identify fragments during apnea from PPG signals so as to detect respiratory events. Various combinations of PPG features have been applied to detect apnea events. In the previous studies [18, 19], the sensitivity and accuracy increased from 75% and 85% to 98% and 97% as the adopted PPG signal features increased from 10 to 32 with a multilayer feedforward neural network for detecting respiratory arrests. Due to the relatively limited processing capability of simplified monitoring devices, more effective PPG-based detection methods are required to achieve a better compromise between performance and complexity.
The Poincaré plot is constructed with successive beat-to-beat intervals as X and Y axis, and is becoming an effective tool to reflect cardiac rhythm patterns. The successive beat-to-beat intervals could be generated by the pulse intervals of the PPG signals. The relationship between the major types of arrhythmia and the shapes of 24-hour Poincaré plots has been systematically studied [20]. The various descriptors depicting the geometric features of the Poincaré plot have been adopted to identify arrhythmias. Moreover, a recent study confirmed the corresponding relationship between short-term (150–300 beat) Poincaré plot patterns and specific arrhythmias [21] implying the possibility of early and effective detection of abnormal rhythms.
In this study, the OSA detection and arrhythmias classification methods are proposed, both of which could be implemented via a singlechannel PPG signal. The proposed OSA detection method uses the multiple features obtained from the PPG pulses as the inputs of the support vector machine (SVM) to identify OSA events. In particular, the effect of feature numbers on the performance is investigated to derive satisfactory detection accuracy with lower complexity. The proposed arrhythmia classification method uses the modified Hausdorff distance of Poincaré plots between the tested and templates to identify the four types of arrhythmias related to OSA. Due to the high consistency between the Poincaré plots of PPG and electrocardiogram (ECG) [22, 23], the performance of the proposed arrhythmia classification method is evaluated by an ECG-based annotated arrhythmia database in the absence of a sufficient source of PPG arrhythmia cases. This study aims to provide a feasible singlechannel PPG signal-based solution for the daily screening of OSA and arrhythmia in the early stage.
Materials and methods
The PPG acquisition system
The hardware structural diagram of the PPG acquisition system is presented in Fig. 1. In the front-end is, an IR LED with a wavelength of 940 nm. The transmitted or reflected light is picked up by a TSL 235 light-to-frequency converter with a photodiode and a current-to-frequency converter and a square wave with a frequency proportional to light intensity is transmitted as the output. Therefore, the system does not require any conventional amplifier or analog-to-digital converter circuit, and the hardware architecture is significantly simplified. The MSP 430 single chip MCU converts the frequency signal from TSL 235 into a PPG signal with a sampling rate of 500 samples per second. The MCU transmits the IR PPG signal to a mobile phone for further processing via the Bluetooth communication module. The system is also equipped with a memory chip to store the raw PPG signal and an alarm circuit to send out sound and light alarms following MCU’s command.
PPG-based OSA detection algorithm
PPG data acquisition
This study was approved by the Ethics Committee of Health Science Center at Xi’an Jiaotong University, and was conducted on 30 patients diagnosed with OSA at the sleep laboratory in the First Affiliated Hospital of Xi’an Jiaotong University. All patients provided informed consent.
PSG data with 15 channels including electroencephalogram (EEG), electrooculogram (EOG), ECG, oronasal airflow and arterial oxygen saturation were acquired using a computerized system (E-series, Compumedics Limited, Abbotsford, Australia). Among them, the II-lead ECG was recorded at 256 samples per second. PPG was recorded simultaneously by the self-made PPG acquisition system. The OSA/hypopnea events were analyzed on the professional clinicians applied Compumedics Profusion PSG 3 software (Compumedics Limited, Abbotsford, Australia) according to the American Academy of Sleep Medicine (AASM) publication [24]. The characteristics of the patients are listed in Table 1.
The characteristics of the patients
The characteristics of the patients
The hardware structural diagram of the PPG acquisition system.
The raw PPG signal were smoothed with a 5-points moving averaging method and detrended linearly to remove the baseline. According to the respiratory waveform and clinicians’ annotation, 20 PPG fragments with data length of 25 seconds during apnea and normal respiration were segmented from each patient. As a whole, 600 PPG fragments under normal respiration condition and 600 PPG fragment under OSA condition were acquired. An improved algorithm was adopted to detect the peak points at the rising edge of the PPG pulses instead of the local maximal values over the pulse periods so that the endpoints of the systolic period could be accurately located. The steps of the peak detection method have been described in the previous study [25]. The valley points were detected as the points with minimal values between consecutive peak points.
PPG features
Figure 2 presents the typical waveform of a PPG pulse (from V1 to V2), where P1 and P2 refer to the peak point V1 and V2 are the valley points and start points of the PPG pulses The PPG parameters are defined as follows:
Am: the amplitude of a PPG pulse, i.e., the light intensity difference between the peak and valley points in a pulse cycle.
The typical waveform of a PPG pulse.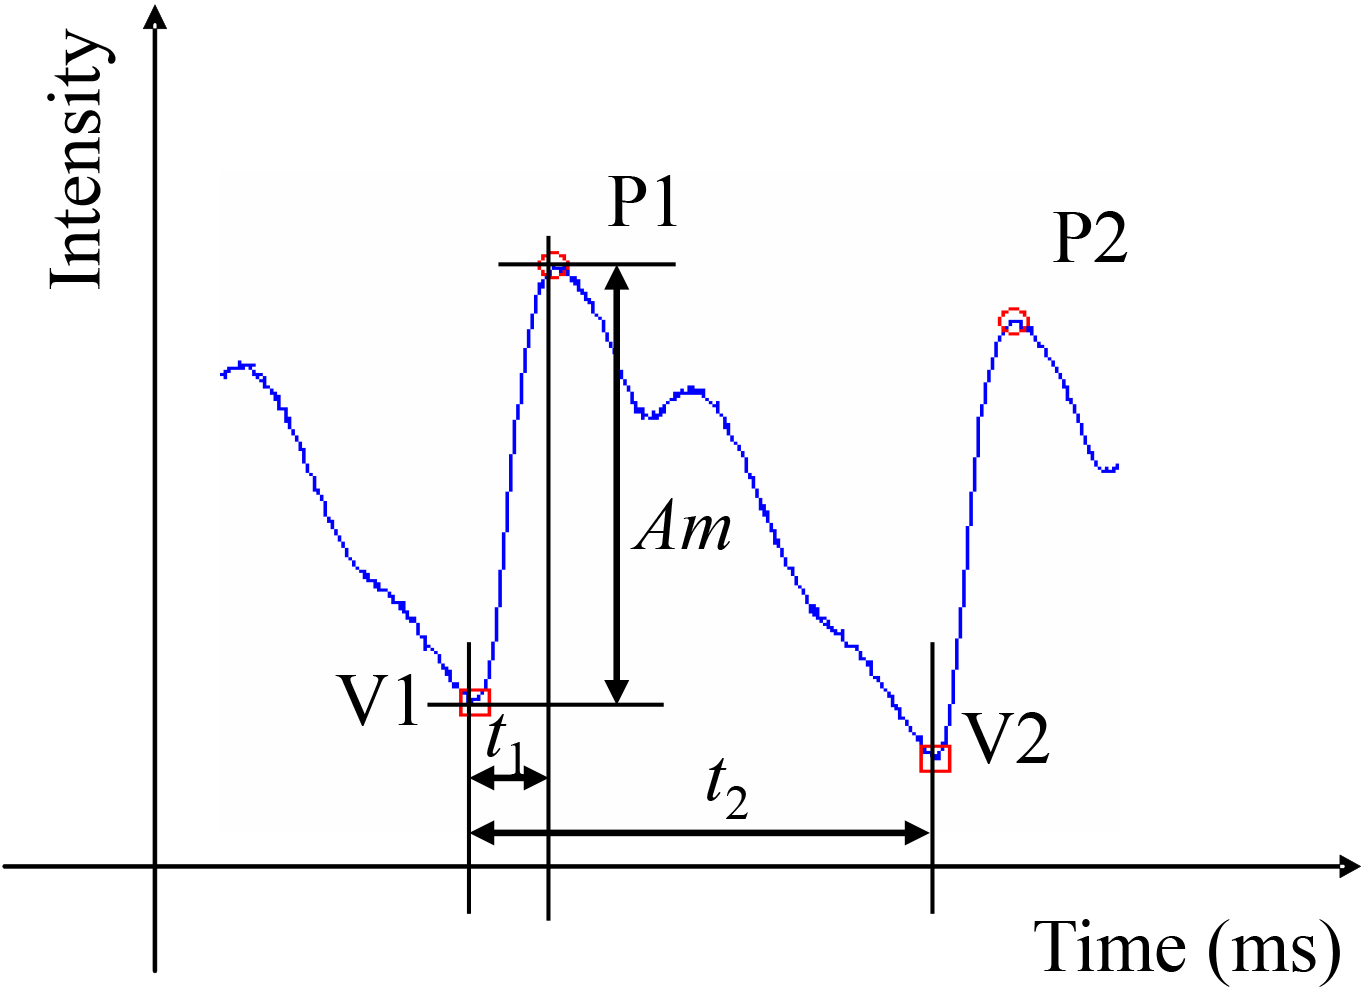
The mean and standard deviation of Am,
mean PP(ms): mean pulse interval between consecutive peak points. SDPP (ms): standard deviation of peak to peak intervals (PPIs). RMSSD (ms): standard deviation of the difference between consecutive PPIs. nLF: normalized low-frequency (LF, 0.04–0.15 Hz) power of PPI sequence, nLF
To sum up 14 features i.e., mean Am, SD Am, mean
In this study, an SVM classifier with the Gaussian radial basis (GRB) kernel function [29] is adopted to identify OSA events from normal respiratory conditions. SVM maps the input features into a high-dimensional feature space and then constructs a discriminant hyperplane nonlinearly. The following two methods are adopted to set up and evaluate the SVM models.
The first one is the leave-one-out cross-validation method. Thirty independent subsets each containing only one of the patient’s PPG features, are used as the SVM input sets. In each verification, one subset is selected as the test set, and the remaining 29 subsets the training set. The verification process is repeated 30 times until all the subsets are used as the test set once. The accuracy of the classifier is the average accuracy of 30 verifications. Although the leave-one-out method results are possibly more dependent on individuals, the method has a clear clinical significance since it classifies the unknown sample based on the model trained by the existing known samples.
The other one is the
Accuracy, sensitivity and specificity are used to evaluate the SVM classifier.
Accuracy
Sensitivity
Specificity
where TP signifies True Positive; TN signifies True Negative; FP signifies False Positive; FN signifies False Negative.
Feature sets established with various combinations of the above features were used as the input subsets of the SVM models to determine the available feature set for the simplified monitoring device. For the subsets composed of the same number of features, the one with the maximal accuracy of classification is selected. Through analyzing the results from the two methods, the optimal feature subset is determined.
Short-term Poincaré plot-based arrhythmia classification
Arrhythmia dataset
The arrhythmia classification is based on 5-min short-term Poincaré plots. Poincaré plot is a two-dimensional graphical representation of the correlation between consecutive heart beat intervals with each interval against the next one. Heart beat intervals for the Poincaré plot are most frequently obtained from RRI of ECG and PPI of PPG. The consistency between RRI and PPI has been verified by in many previous studies [22, 23]. Due to the insufficiency of PPG samples clearly labeled with arrhythmia, ECG-based arrhythmia databases are applied as a substitute in this study.
In addition to the three common arrhythmias among OSA patients, i.e., VPB, SVPB, AF, arrhythmia prior to SCD is also considered in this study. Although seldom discussed due to the lack of data, arrhythmia prior to SCD cannot be ignored since it could serve as a timely warning of most dangerous and malignant cardiovascular events.
ECG data were mainly obtained from the MIT-BIH Arrhythmia Database, Atrial Fibrillation Database and Supraventricular Arrhythmia Database, as well as Sudden Cardiac Death Holter Database. Samples with more than one type of arrhythmias were excluded. According to the annotation, 5-min ECG data of SVPB, VPB, AF, normal sinus rhythm was segmented. 5-min ECG data prior to SCD were also selected and segmented from ECG of two hours before SCD. Segments with RR less than 30 RRIs within 5 minutes were discarded. The detailed information on the ECG segments with various arrhythmias and the corresponding data sources are presented in Table 2.
The ECG segments and data sources
The ECG segments and data sources
Poincaré plots were generated for each 5-min RR segment. The scale ranges of both horizontal and vertical axes of all Poincaré plots are set to [0, 2] (s). The number of pixels in a Poincaré plot is unified to 512*512. The pixels are binarized and presented as either 1 (white) or 0 (black).
The modified Hausdorff (MHD) distance
The MHD [30] is used to measure the dissimilarity degree between a Poincaré plot and the templates. Given two points sets
Where
The Arrhythmia classification algorithm and the performance evaluation
Due to the limited processing capability and energy supply, the modified Hausdorff distance is adopted for the simplified monitoring equipment to classify arrhythmias directly. The MHDs between a tested Poincaré plot and all labeled templates are calculated, and a minimal MHD means that the tested Poincaré plot has the same arrhythmia type as the template. Also the leave-one-out and the k-fold cross-validation methods are adopted to evaluate the performance of the algorithm. The former uses the Poincaré plots of one subject as the test set and all remaining Poincaré plots as the template set. The process is repeated until all subjects are tested. The latter divides the Poincaré plots of all subjects randomly into
Results
Performance of the OSA detection algorithm
As we have mentioned above, the performance of the SVM classifier using different combination of PPG features was evaluated by two methods. For the leave-one-out method, whole 60 PPG fragments of a subject are used as a test set, while for the k-fold method, 150 PPG fragments randomly selected are used as a test set, the average performance parameters were calculated based on the cross-validations of all test sets.
With three or fewer support vectors, the compositions of feature sets with the maximal SVM classification accuracies were different between the leave-one-out method and the k-fold cross-validation method as shown in Table 3. The maximal accuracies with such small numbers of features were all lower than 90%.
The different feature sets with three or fewer features
The different feature sets with three or fewer features
With more than three features, the feature sets with maximal accuracies were the same for the two evaluation methods. The sets S4 to S14 are composed by 4 to 14 of the following features in sequence respectively: meank1, meanAm, SDPP, meanPP, RMSSD, SDk1, SDt1, SDAm, meant1, SDkt, meanktn, LF, nHF, LF/HF.
The OSA detection performance of vs. the number of features evaluated by the leave-one-out cross-validation method is presented in Fig. 3. The sensitivity showed a weak downward trend from S4 to S10, increased at S11, then decreased and remained stable. All sensitivities were lower than 90% with a maximal sensitivity 89.86%. With the increase of features, the Specificity increased significantly from S4 to S6 then decreased and kept stable The accuracy showed no apparent trends only exceeding 90% at S5, S6 and S11. Contrary to expectations, with supplemented HRV indexes in frequency domain, the sensitivity and accuracy at the feature sets S12, S13, S14 decreased. With five features, the accuracy exceeded 90% with a sensitivity of 89.4%, and a specificity of 90.94%, which was satisfactory.
The OSA detection performance by the leave-one-out cross-validation method.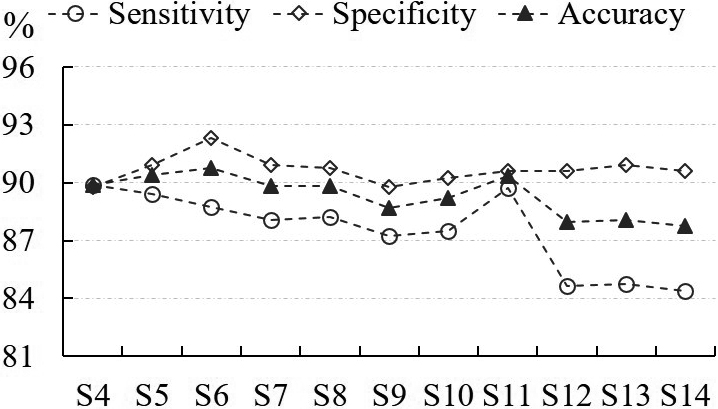
Figure 4 presents the SA detection performance vs. the number of features evaluated by the k-fold cross-validation method. Except for S4, sensitivity and accuracy were all above 90%. Specificity showed an upward trend from S4 to S11 and then decreased and remained stable. The maximal sensitivity, specificity and accuracy, i.e., 93.86%, 90.84%, 92.58% respectively, all occurred at S11. However, the algorithm also showed good performance with five features. The sensitivity accuracy, and specificity reached 91.11%, 90.86% and 87.1% at S5.
The performance of the SA detection by the k-fold cross-validation method.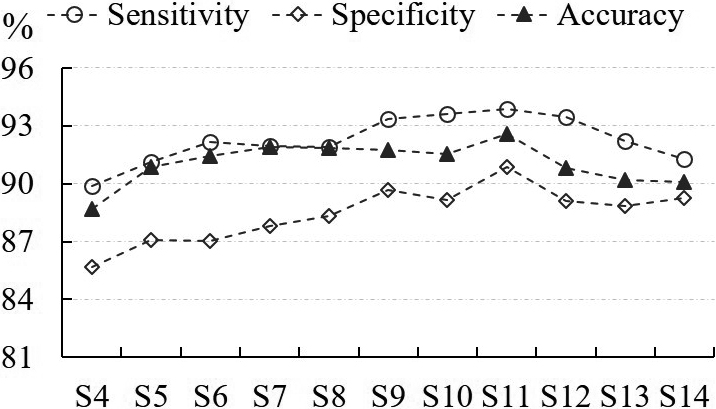
Both methods indicated that a feature set composed of meanPP, SDPP, RMSSD, meanAm and mean
Figure 5 shows the Poincaré plots examples of the four types of arrhythmias and sinus rhythm. The Poincaré plots presents visually identified geometric characteristics, such as comet-shaped sinus rhythm, arrow-shaped SVPB, double-side lobes-shaped VPB, fan-shaped atrial fibrillation and dot-shaped arrhythmia prior to SCD. Due to the different origin, some types of arrhythmia may have multiple subtypes corresponding to different geometric patterns.
The arrhythmias classification algorithm is evaluated with the two methods The confusion matrices are presented in Table 4 and the statistical results are listed in Table 5. The sensitivity, specificity and accuracy through the k-fold cross-validation method were better than those through the leave-one-out method. Both methods proved that the specificity and accuracy of the algorithms for classifing the four types of arrhythmia and regular rhythm were all above 90%. The sensitivity of VPB and normal sinus rhythm identification was above 90%.The sensitivity of AF identification was 81.13%, regardless of the evaluation methods. However, with the leave-one-out method, the sensitivity of SVPB identification was 77.27%, the sensitiity of arrhythmia prior to SCD identification was only 69.49%, both of which were relatively high with the k-fold cross validation method. It may imply that the performance of the algorithm was more sensitive to the composition of the known templates on identifying SVPB and arrhythmia prior to SCD than the other types of arrhythmias. The average sensitivity is at least 83.79% while the average specificity and accuracy were all above 90% with either of the evaluation methods.
The confusion matrices of the two cross-validation methods
The confusion matrices of the two cross-validation methods
The representive Poincaré plots examples of the four types of arrhytmias and sinus rhythm: (a) Sinus rhythm; (b) Supraventricular premature beats; (c) Ventricular premature beats; (d) Atrial fibrillation; (e) Arrhythmia prior to SCD.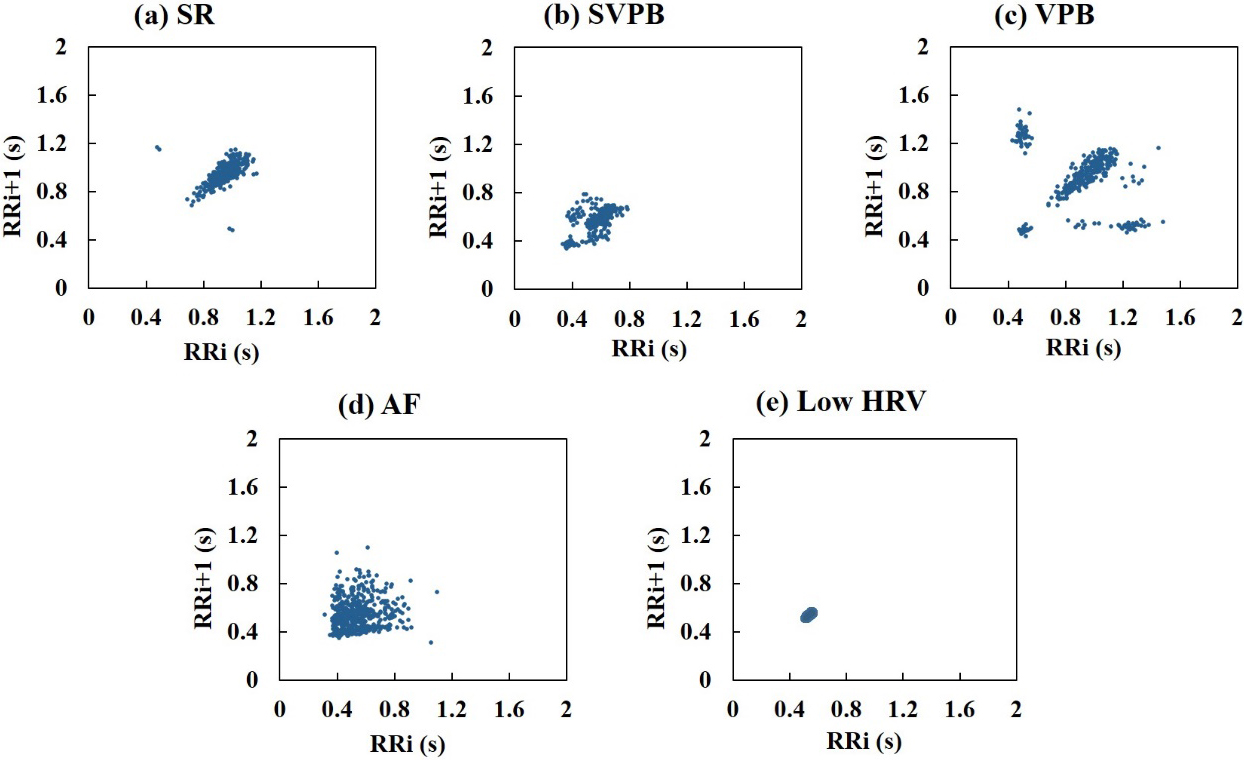
The performance of the MHD-based arrhythmia classification algorithm
This study aims to provide a feasible approach for the early monitoring of OSA and its related arrhythmias using a single-channel PPG acquisition device. Considering its limited processing ability, we focused on reducing the algorithm complexity as much as possible under the premise of ensuring a certain performance level. For the SVM-based OSA detection, we investigated the relationship between the number of PPG features (i.e., the number of support vectors), and the algorithm performance. Based on that, we determined the most effective feature set, which reached a satisfactory comprise between algorithm complexity and detection accuracy. We used the geometric patterns of Poincaré plots to classify the arrhythmia types by the minimal MHD between a tested plot and the template set. The preliminary results confirmed the feasibility of the proposed methods.
The changes of PPG signals during OSA result from the complicated regulatory mechanisms of the autonomic nervous system. It has been reported that the baroreflex induced by the changes in intrathoracic pressure and the chemoreflex induced by hypoxemia during apnea caused complex interactions between sympathetic and parasympathetic branches [31]. It is speculated that due to the multiple intrinsic control loops, both autonomic branches strengthen simultaneously during apnea instead of the reciprocal relationship under normal conditions. As evidence, bradycardia could be observed during apnea, which is considered an important defense mechanism against hypoxia damage and reflects the increased parasympathetic activity. The increases in muscle sympathetic nervous activity (MSNA) and arterial blood pressure [32] during apnea indicate the strengthened sympathetic function on vascular contraction and heart rhythm, which would lead to changes in blood perfusion volume and heart rate variability. Among the five features meanPP, SDPP, RMSSD, meanAm, mean
Generally, the algorithm performance would improve with more than five features. However, the results indicated that adding the frequency HRV indexes to the feature set would cause the accuracy to decrease. It is possibly due to the inaccuracy of frequency spectrum calculation since the sample points over 25 seconds are obviously insufficient for accurate spectrum analysis, which normally requires at least 5 min of data length [33].
Although the MHD-based arrhythmia classification showed a stable and acceptable performance of SPB, AF and normal rhythm identification, the leave-one-out method revealed that the algorithm was quite sensitive to the known templates of SVPB and arrhythmia prior to SCD identification. Based on notion of electrophysiology, an SVPB was defined as a QRS of less than 0.12 seconds with a minimum shortening of 20% in the R-R interval [34]. Thus when the occurrence of SVPB is too low, it is hard to reflect significant distribution characteristics of Poincaré plots for individual patients. Such Poincaré plots of SVPB with vague features may have minimal MHD with other types of arrhythmias and lead to a wrong judgement. Future efforts are required to explore the image features of the short-term Poincaré plot which can well characterize SVPB with different occurrence frequency within 5 minutes and improve the performance.
It is the first time that the arrhythmia prior to sudden cardiac death is considered a type of arrhythmia to be classified. There are no general descriptions of the characteristics of heart rhythm before SCD. Quite a few such Poincaré plots reflect very low HRV with small SD1 and SD2, but in some Poincaré plots of individual SCD patients some scattered points are observed “resembling noise” around convergent image pattern composed of most points. The noise points interfere significantly with the similarity between the tested Poincaré plot and the template causing misclassification In future studies, measures should be taken to remove such noise points and reduce their impact on the main image patterns. It is worth emphasizing that compare with other types of arrhythmia, arrhythmia before SCD is undoubtedly the most dangerous one, the identification of which is extremely important in sleep monitoring.
Compared to ECG measurement with at least two electrodes sticking on the skin, the wearable and miniaturized PPG sensors have lower physiological load and are more available for daily monitoring. More importantly, PPG contains more abundant information of autonomic regulation on cardiovascular system. Not only has PPI from PPG been increasingly used as a substitute of RRI from ECG, which reflects autonomic regulation on heart rhythm, but PPG pulse amplitude and baseline can also reflect autonomic regulation on myocardial contractility and vasomotion. That is to say, PPG can more comprehensively reflect apnea induced complex autonomic activities than ECG and PPG has more advantages for apnea screening. But it should be noticed that PPG is susceptible to motion artifacts, and interferences reduction should be a challenge when applying PPG for either apnea or arrhythmia classification.
This study is not without limitations. Firstly, the samples in this study, either for SA detection or arrhythmia classification are minimal. The algorithm performance needs further verification among larger-scale populations. Secondly, the PPG signals under apnea and normal respiratory conditions were manually segmented in this study. The PPG data would be segmented in sequence according to the fixed time interval in the practical applications. Thus some PPG segments may involve data under both apnea and normal respiratory conditions. The performance of the OSA detection algorithm on such PPG segments needs to be evaluated, based on which the apnea/hypopnea index (AHI) should be measured in future research on the final OSA screening. Thirdly, although HRV indexes from ECG are highly similar to those from PPG, the difference of Poincaré plots from the two methods needs further discussion. More importantly, the algorithm should be executed and evaluated on the PPG signals instead of using ECG as a substitute. Finally, in addition to MHD considering more image features of Poincaré plots could improve the identification performance, particularly, the sensitivity on the identification of SVPB and arrhythmia prior SCD.
Conclusion
In this study, OSA detection and arrhythmia classification algorithms based on single channel PPG signals are proposed and evaluated. The results indicate that the SVM method using only five PPG features could provide satisfactory OSA detections. Also, the minimal MHD of the Poincaré plots-based algorithm could identify the four types of arrhythmia related to OSA. More importantly, the PPG signals for both algorithms could be obtained from the easy-to-use PPG acquisition device. With the extreme shortage of suitable monitoring devices, the proposed methods could facilitate a feasible and promising approach for the early screening and diagnosis of OSA and its complications.
Footnotes
Acknowledgments
The research described in this paper was supported by the National Natural Science Foundation of China (Grant nos 82072013, 91648208) and the Natural Science Foundation of Shaanxi Province (Grant no. 2018JM7098).
Conflict of interest
None to report.