



Abstract
BACKGROUND:
Cervical histopathology image classification is a crucial indicator in cervical biopsy results.
OBJECTIVE:
The objective of this study is to identify histopathology images of cervical cancer at an early stage by extracting texture and morphological features for the Support Vector Machine (SVM) classifier.
METHODS:
We extract three different texture features and one morphological feature of cervical histopathology images: first-order histogram, K-means clustering, Gray Level Co-occurrence Matrix (GLCM) and nucleus feature. The original dataset used in our experiment is obtained from 20 patients diagnosed with cervical cancer, including 135 whole slide images (WSIs). Given an entire WSI, the patches on its tissue region are extracted randomly.
RESULTS:
We finally obtain 3,000 patches, including 1,000 normal, 1,000 hysteromyoma and 1,000 cancer images. Among them, 80% of the entire data set is randomly selected as training set and the remaining 20% as test set. The accuracy of SVM classification using first-order histogram, K-means clustering, GLAM and nucleus feature for extracting features are respectively 87.4%, 90.6%, 91.6% and 93.5%.
CONCLUSIONS:
The classification accuracy of the SVM combining the four features is 96.8%, and the proposed nucleus feature plays a key role in the SVM classification of cervical histopathology images.
Introduction
Cervical cancer is the second most frequent cancer among women worldwide and causes approximately 288,000 deaths per year [1]. The incidence of cervical cancer is extremely high in less developed regions, especially in East Africa, Tanzania. The incidence and mortality rate are 54.0 and 32.4 cases per 100,000 females respectively [2]. Cervical cancer is one of the top 10 cancer types in terms of new cancer cases in 2020. The number of cervical cancer deaths in China is reported to be 60,000 in 2020. Fortunately, if a cancer is detected and treated early, the death rate from the cancer will be greatly reduced [3, 4, 5]. For example, cytology screening tests of cervical cancer such as Pap smear [3, 4, 5] and liquid-based cytology [4] have helped to decrease mortality by 70–80% [5, 6]. The main advantages of these detection methods are simple, convenient, and minimal invasion. Despite the encouraging success of these tests, their sensitivity for detecting preinvasive cervical lesions is far from desirable, and the average sensitivity is only 55%. At the same time, the sensitivity of detecting invasive carcinoma is not perfect, ranging from 55% to 80% in different studies [7, 8]. Classification of cervical histopathology images is an important issue affecting cervical cancer diagnostic management, treatment and surveillance programs [9]. Therefore, it is essential for successful treatment to carry out a rapid, accurate, and early diagnosis of cervical cancer [10].
Support Vector Machine (SVM) [11] is a linear classifier according to the supervised learning method based on statistical learning theory [12] and has a wide range of applications and has been used for the classification of histopathology images [13, 14, 15, 16]. Feature selection and parameter optimization are two important aspects for improving the performance of SVM classifier [17]. Histopathology image features mainly include texture features and morphological features [18, 19, 20]. There are a variety of texture features that can be selected, including Gray Level Co-occurrence Matrix (GLCM) [20, 21], Histograms of Oriented Gradients (HOG) [22], first-order histogram [23], K-means clustering [24], homogeneity, contrast, correlation, variance, inverse difference moment, sum average, sum variance, sum entropy, entropy, difference variance, difference entropy, information measure I, information measure II and maximal correlation coefficient [25]. Morphological features include area, centroid, eccentricity, equivalent diameter, major axis length, minor axis length, perimeter, nucleus [26], roundness, position and brightness [25]. In recent years, many researchers have explored how to classify histopathology images. Rahmadwati et al. proposed that both K-means clustering [27, 28, 29] and nucleus feature are significantly important in differentiating normal, benign and malignant cervical histopathology images [30]. Ashok et al. used SVM classifier combining GLCM, correlation, variance and nucleus to classify cervical histopathology images, and finally achieved 94.5% accuracy [25]. Mithlesh et al. used SVM classifier combining first-order histogram, GLCM, Local Binary Pattern (LBP) and Discrete Wavelet Transform (DWT) to classify cervical cancer images, and obtained 97% accuracy [31]. Lisheng et al. used SVM classifier combining GLCM and K-means clustering to classify cervical histopathology images, and gained 90% accuracy [32]. Athinarayanan et al. used SVM classifier combining GLCM, Texton Co-occurrence Matrix (TCM), Enriched Texton Co-occurrence Matrix (ETCM), respectively, to classify cervical histopathology images, and they finally got 72%, 78%, and 86% accuracy. Another approach combining GLCM, TCM and ETCM with SVM to classify cervical histopathology images and got 94% accuracy [33]. Dongyao et al. used SVM classifier combining GLCM and Gabor to classify cervical histopathology images and got 89.1% accuracy [34].
In this report, we proposed three different texture features and one morphological feature for extracting features prior to SVM classifier for classifying cervical histopathology image patches. First-order histogram, K-means clustering and GLCM obtained from the R channel images of cervical histopathology images were used to calculate texture parameters, including mean [35], variance, third-order center distance, smoothness and uniformity. Morphology-based feature was extracted using nucleus feature obtained from the R channel images. The morphological parameters we used include quantity, area, perimeter, roundness, and density. The original dataset used in our experiment was obtained from 20 patients who were diagnosed with cervical cancer, including 135 whole slide images (WSIs). Given an entire WSI, the patches on its tissue region were extracted randomly. We finally obtained 3,000 patches, including 1,000 normal, 1,000 hysteromyoma and 1,000 cancer image patches. We randomly selected 20% of the entire data set as test set and the rest 80% as the training set. The classification accuracy of SVM combined with first-order histograms, K-means clustering, GLCM and nucleus feature were respectively 87.4%, 90.6%, 91.6% and 93.5%. Combination of all the four features obtained 96.8% classification accuracy.
Dataset collection and analysis
The dataset used in this article consists of 135 whole slide images derived from 20 patients with cervical cancer. 20 samples of the surgically resected human cervical tissues were obtained from GuangZhou Woman and Children’s Medical Center. Informed consent was obtained from all individuals included in this study. Each removed tissue section was stored in 0.9% sodium chloride solution as soon as possible after the resection and then transported to the laboratory on ice. Then use formalin fixative to infuse in a 4
Proposed method
The proposed method is shown in Fig. 1, which describes the basic steps including image segmentation, image preprocessing, feature extraction, SVM classifier classification and results evaluation. The purpose of image segmentation is to split the cervical histopathology images into patches using the ImageViewerG in SQS1000. Image preprocessing is to separate the R channel images from the original RGB images. R channel grayscale images of normal (d) hysteromyoma (e) and cancer (f) are shown in Fig. 2. Three different texture features and one morphological feature are extracted from the R channel image: first-order histogram, K-means clustering, GLCM and nucleus feature. Among them, first-order histogram, K-means clustering and GLCM were used to calculate texture parameters, including mean, variance, third-order center distance, smoothness and uniformity. Nucleus features were used to calculate morphological parameters, including quantity, area, perimeter, roundness and density. SVM combining texture and morphological characteristic parameters was used to classify the R channel images. Finally, the classification results were evaluated by accuracy, specificity and sensitivity.
Flowchart of the proposed method.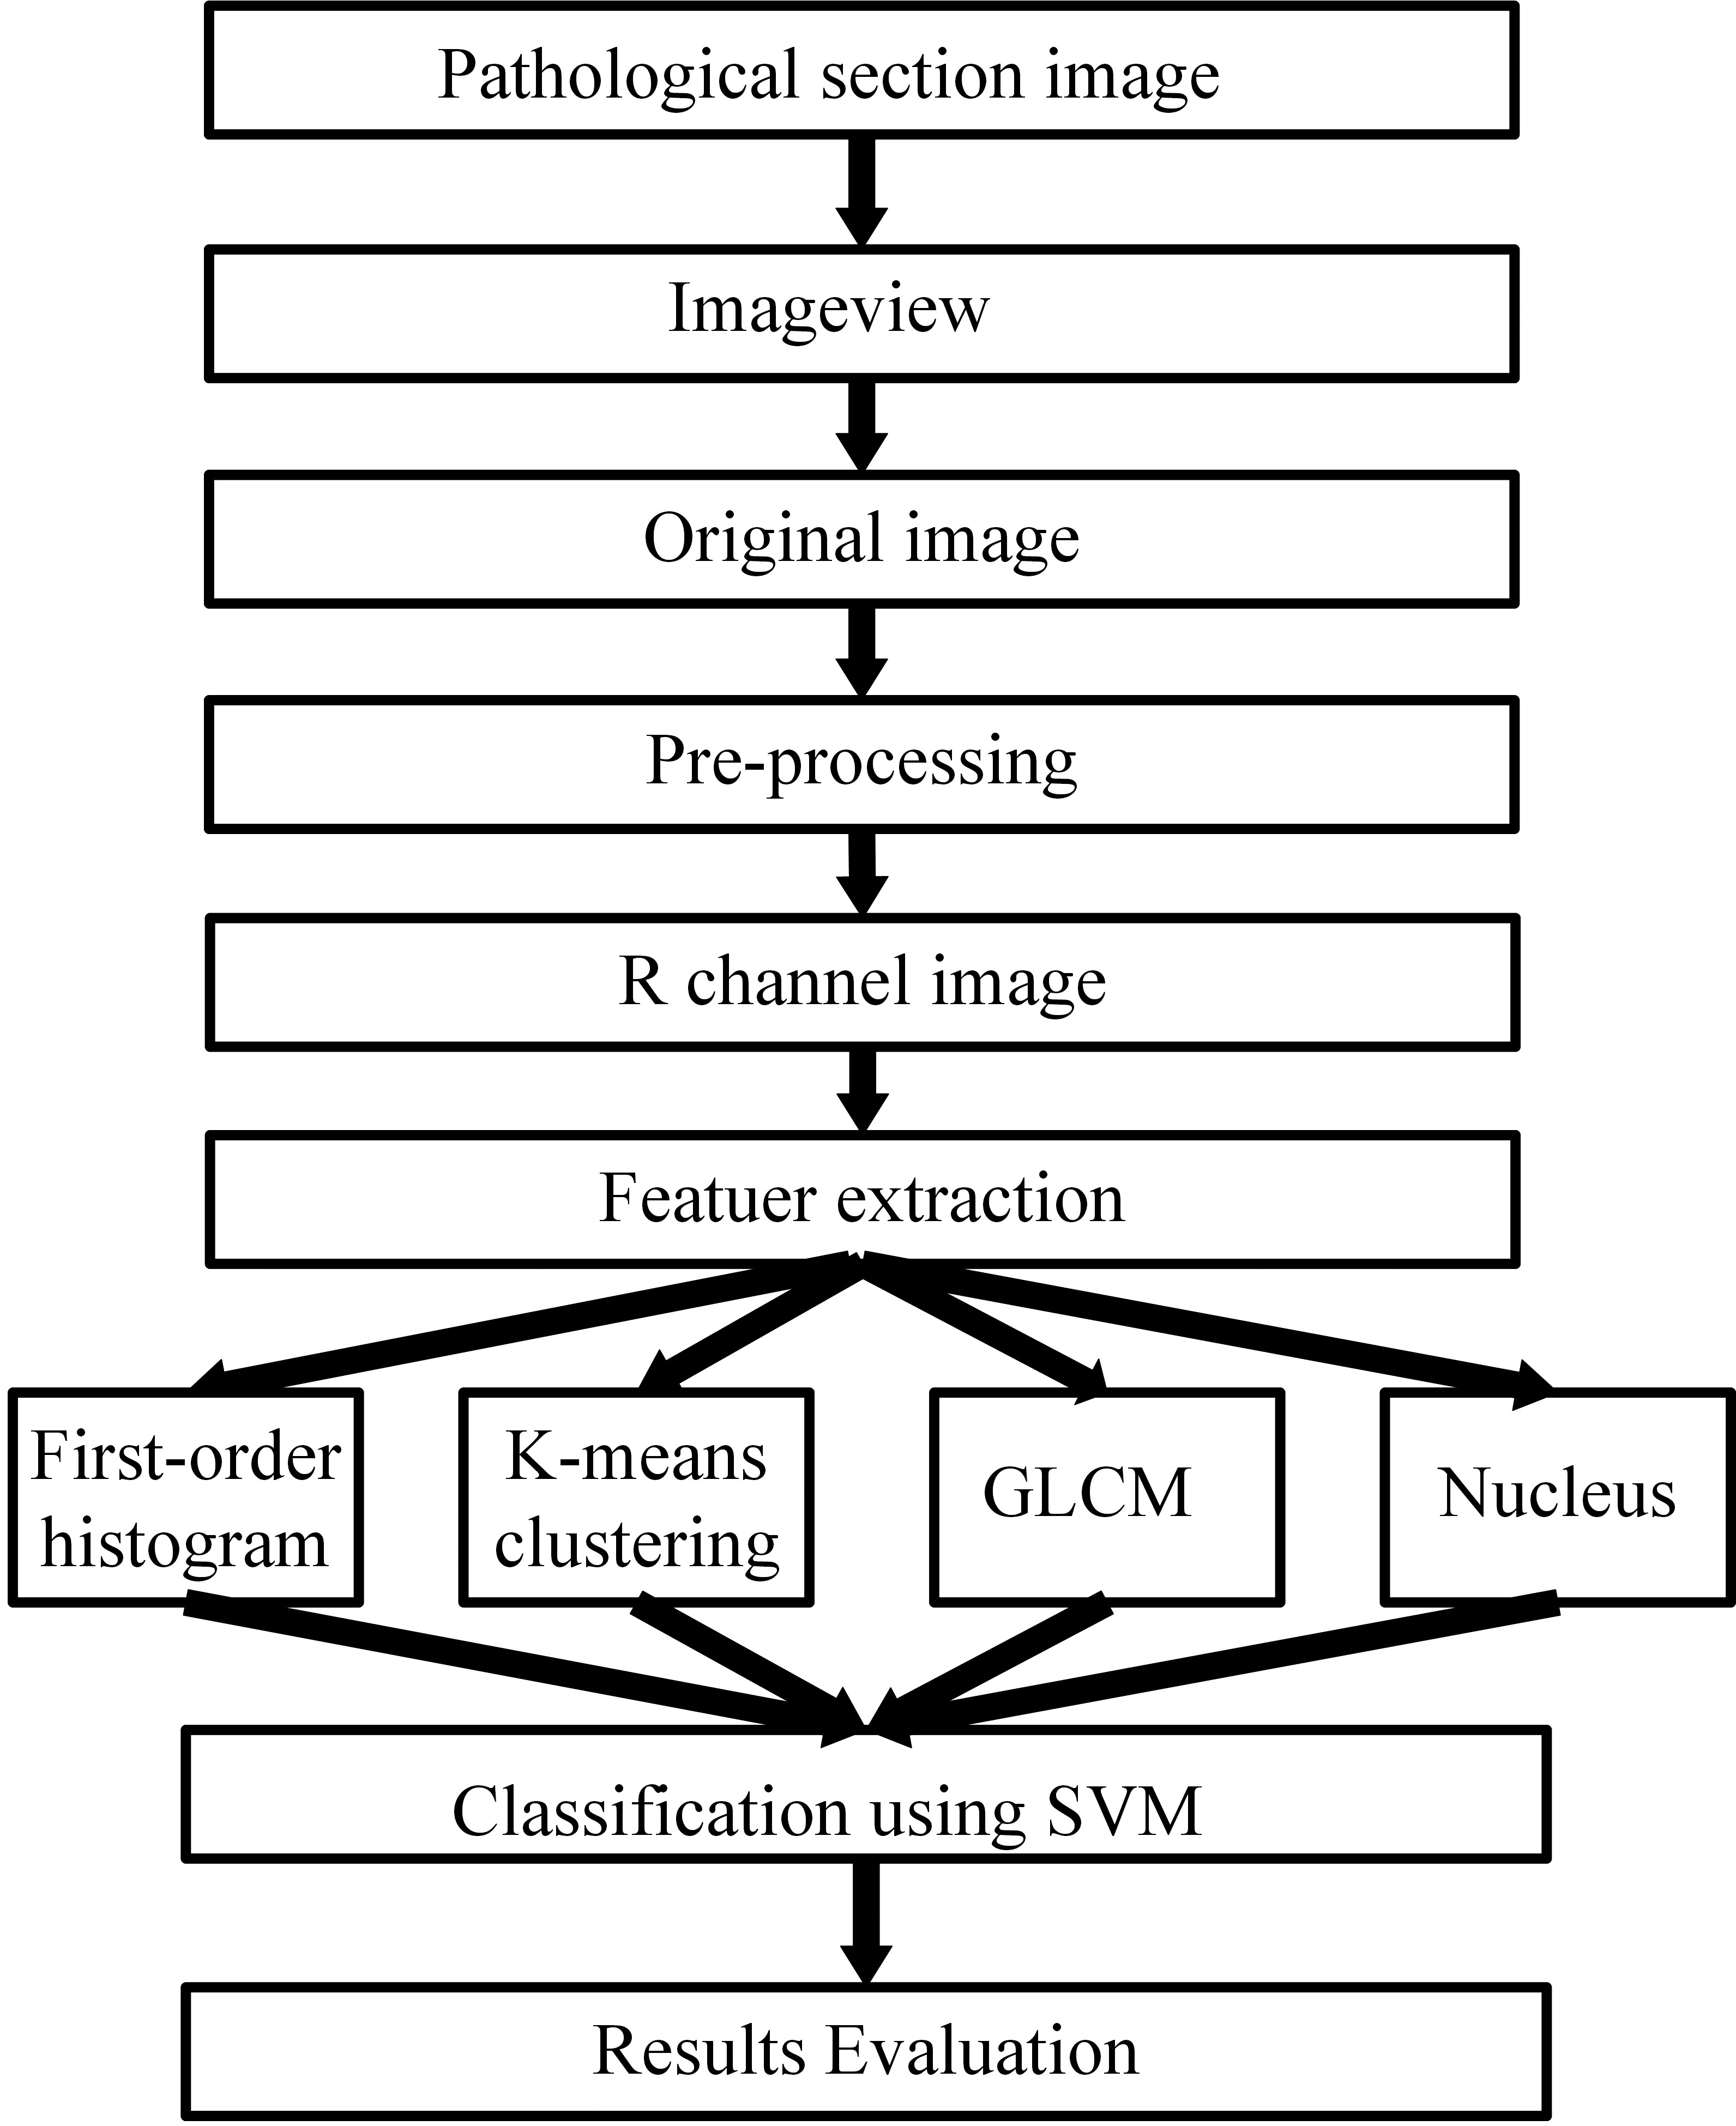
Separating R channel images from the original images.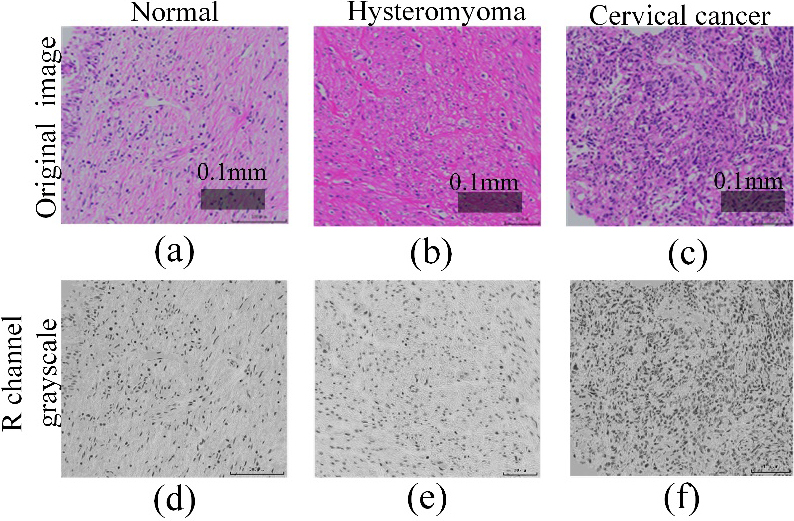
Research on vital features including color, texture and morphological features for disease classification has often been inspired by visual characteristics definedby clinicians as particularly important for disease grading and diagnosis. Based on the facts that blue wavelengths are absorbed less than green and red channels by the hematoxylin dye, we extracted the color feature parameters of three channels for quantitative analysis. Other features of discriminatory importance include the appearance of edges and borders of ductal, stromal, tubular and glandular structures, corresponding to texture and morphological features in image analysis processing. Texture and morphological based methods were widely used to extract the features of an image after segmentation and preprocessing [31]. In this paper, texture features including first-order histogram, GLCM and K-means clustering were extracted from the R channel images. We calculated five characteristic parameters: mean, variance, third-order center distance, smoothness and uniformity. Table 1 gives the calculation formula of these characteristic parameters.
Five parameters of texture features
Five parameters of texture features
The color histogram is used to describe the numerical distribution of pixel colors in an image, which can reflect the statistical distribution of image colors and the basic tone of the image. There are amounts of color features which are provided in literature including color histogram, color correlogram, color moments, and color coherence vector. Among them, color histogram is the most intuitive and commonly used feature. We attempt to create relevant color features for each image involved computing global cumulative histograms over the entire image for each pixel’s RGB values. Figure 3 shows global cumulative histograms of typical cervical histopathology images, including normal, hysteromyoma, and cervical cancer images. After obtaining the global cumulative histograms, we compare the histograms of all the images by calculating the histogram similarity using the Correlation, Chi-Square, Intersection, and Bhattacharyya distance in the OpenCV compareHist function library. Our results reveal that the RGB color histogram is not an optimal solution for classifying histopathological images of cervical cancer, so we focused on texture and morphological features and separated the R-channel grayscale images from RGB images for further feature extraction.
Global cumulative histograms of cervical histopathology images: (a) normal, (b) hysteromyoma, (c) cervical cancer.
First-order histogram is a way to extract the first-order statistical texture features [31], which reflects the relationship between gray intensity and the corresponding number of pixels [23]. The grayscale intensity of normal (d), hysteromyoma (e) and cancer (f) in Fig. 2 is counted pixel by pixel to obtain the first-order histogram shown in Fig. 4. Normal images have the most concentrated grayscale distribution, and the pixels in the grayscale range of 0–150 in cancer images are more than those in normal and hysteromyoma images. The mean values of normal, hysteromyoma and cancer images were 176.42, 188.76 and 159.72, respectively. The variance values of normal, hysteromyoma and cancer images were 18,314, 21,462 and 15,326, respectively. The third-order center distance values of normal, hysteromyoma and cancer images were 2,584,325, 3,121,167 and 2,061,620, respectively. The smoothness values of normal, hysteromyoma and cancer images were 1.00, 1.00 and 1.00, respectively. The uniformity values of normal, hysteromyoma and cancer images were 0.023, 0.020 and 0.013, respectively. The mean, variance and third-order center distance of the cancer images were the smallest, and the feature parameters calculated from the hysteromyoma images were the largest.
First-order histogram of (a) normal, (b) hysteromyoma and (c) cancer corresponding to R channel images in Fig. 2.
According to their characteristics, the R channel grayscale images of cervical images were divided into three parts: nucleus, tissue and blank. We set 80 as the initial gray value of the nucleus, 160 as the initial gray value of the tissue and 220 as the initial gray value of the blank. The difference between the gray value of each pixel and the three initial gray values are calculated pixel by pixel. Each pixel is classified into nucleus, tissue or blank category according to the minimum difference. K-means clustering processing the R channel images in Fig. 2 to obtain their K-means clustering histogram of normal (a), hysteromyoma (b) and cancer (c) which are shown in Fig. 5. The proportion of nucleus and tissue in cancer images is significantly higher than those of normal and hysteromyoma images. The mean values of normal, hysteromyoma and cancer images were 176.34, 189.93 and 159.21, respectively. The variance values of normal, hysteromyoma and cancer images were 32,313, 36,302 and 26,512, respectively. The third-order center distance values of normal, hysteromyoma and cancer images were 5,874,112, 6,988,829 and 4,487,618, respectively. The smoothness values of normal, hysteromyoma and cancer images were 1.00, 1.00 and 1.00, respectively. The uniformity values of normal, hysteromyoma and cancer images were 0.80, 0.80 and 0.49, respectively. The mean, variance, and third-order center distance of hysteromyoma images are the largest, while the three parameters of cancer images are the smallest.
K-mean clustering results of (a) normal, (b) hysteromyoma and (c) cancer obtained from R channel images in Fig. 2.
GLCM method is a way to extract second-order statistical texture features, which uses the relationship between adjacent pixels. In other words, it is a joint probability distribution or pairs of pixels [36]. Mithlesh et al. detailed the extraction process of GLCM feature [31]. GLCM matrix is defined by
GLCM of the R channel images in Fig. 2.
To extract the nucleus features of R channel images in Fig. 2, we used binarization and watershed algorithm to segment the nucleus region. Then we obtained their binarization figures (Fig. 7, first line) and watershed figures (Fig. 6, second line). In the binarization process, the threshold value is set to 100. Grayscale values greater than 100 are designated as 0, and grayscale values less than 100 are designated as 1. The morphological features of the nucleus are used to calculate five morphological characteristics parameters such as quantity, area, perimeter, roundness and density of the nucleus. The quantity values of normal, hysteromyoma and cancer images were 421, 572 and 1224, respectively. The area values of these parameter values were 17,132, 29,262 and 70,454, respectively. The perimeter values of normal, hysteromyoma and cancer images were 493, 675 and 1105, respectively. The roundness values of normal, hysteromyoma and cancer images were 0.88, 0.81 and 0.73, respectively. The density values of these parameter values were 0.00088, 0.0011 and 0.0026, respectively. Normal images have the smallest values of quantity, area, perimeter and density, while cancer images have the largest values of these parameters.
Results and discussion
The experimental dataset included 135 cervical histopathology images from 20 patients. We randomly selected 150 images, including 50 normal images, 50 hysteromyoma images and 50 cancer images. The average values of the characteristic parameters were calculated for the first-order histogram, K-means clustering, GLCM and nucleus feature, respectively.
Table 2 shows the average parameter values of the first-order histogram. The mean value of cancer images is lower than those of normal and hysteromyoma images due to more nucleus of cancer. Hysteromyoma images have the highest variance and third-order center distance values, and cancer images have the lowest values for these two parameters. Third-order center distance defines the skewness of the color component, that is, the asymmetry of the color. It is calculated that the smaller the value of the third-order center distance is, the better the symmetry is. Therefore, the color symmetry of cancer images is the best. There is little difference in the smoothness value for these three kinds of images. Normal and hysteromyoma images have similar uniformity value, which is much higher than that of cancer.
First-order histogram characteristic parameters of normal, hysteromyoma and cancer images (average of 50 images)
First-order histogram characteristic parameters of normal, hysteromyoma and cancer images (average of 50 images)
Binarization and watershed segmentation images from the R channel images in Fig. 2.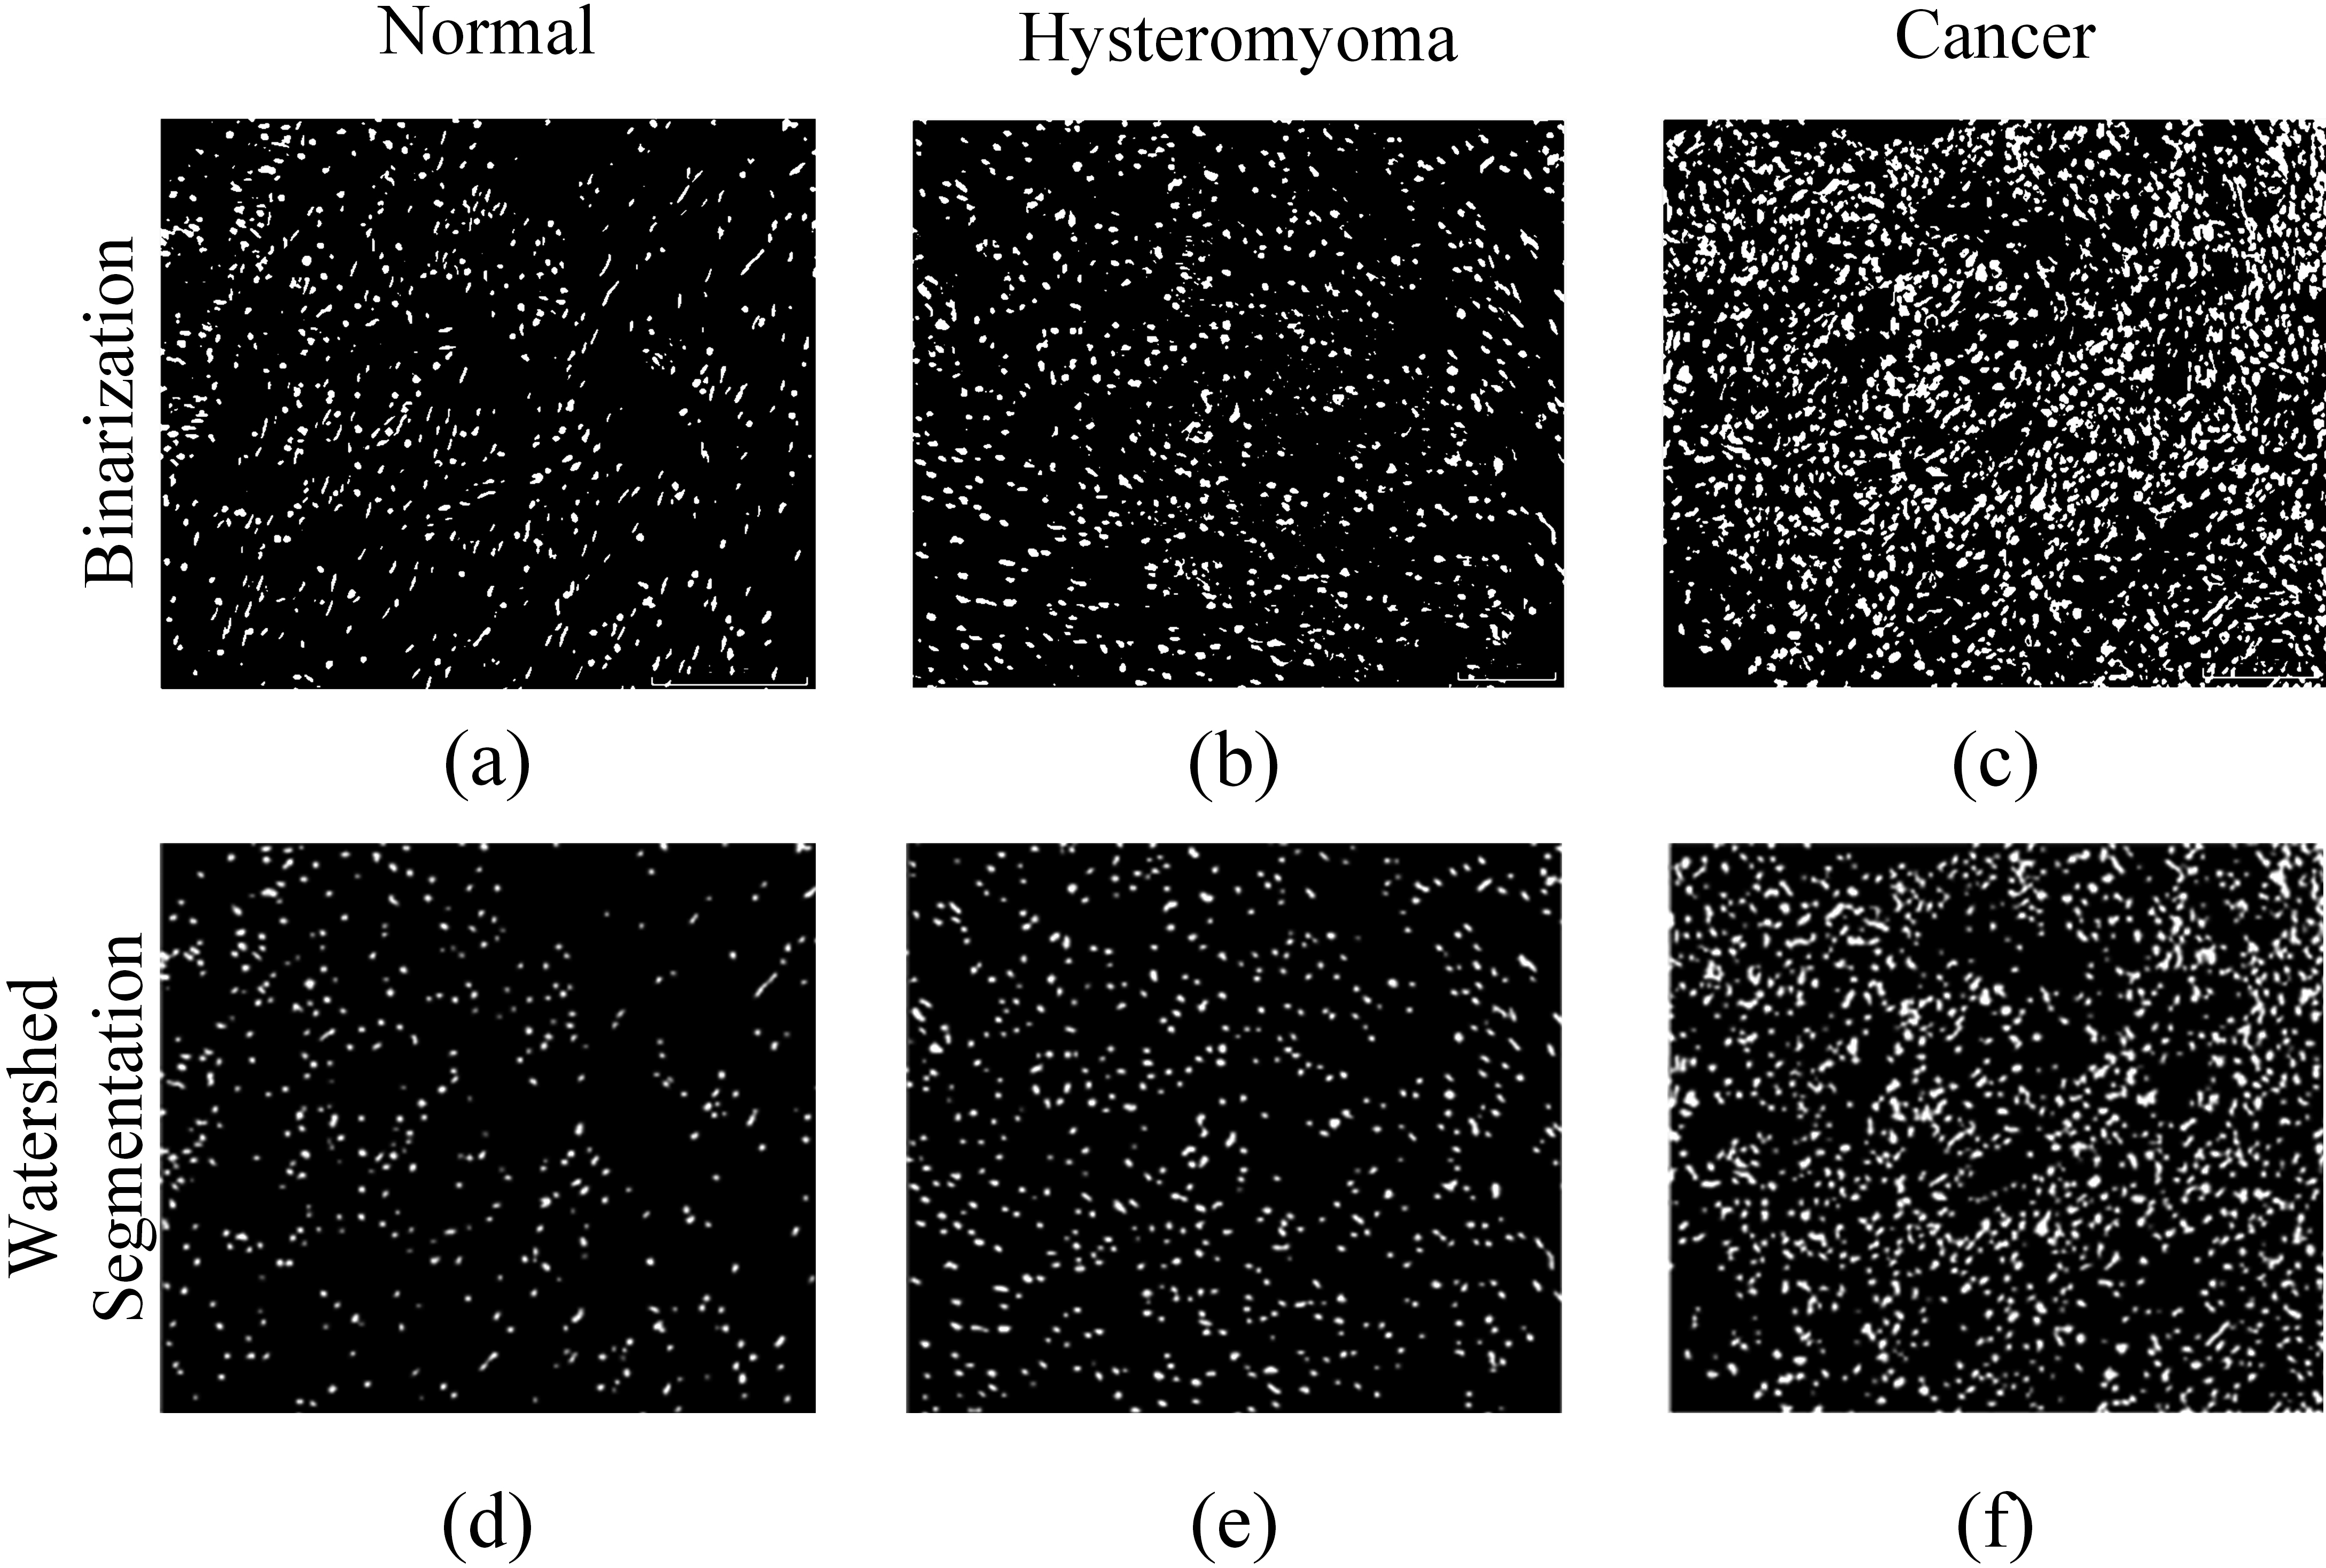
Table 3 shows the average parameter values of the K-means clustering. The mean value of cancer images is lower than those of normal and hysteromyoma, which may be due to the large proportion of the nucleus and tissue regions of the K-means clustering images of cancer. The highest values of variance and third-order center distance are found in hysteromyoma images, while the lowest values are both found in cancer images, meaning that the area ratio difference between nucleus, tissue and blank in cancer images is minimal, and the symmetry of color is the best. There is little difference in the smoothness value of these three types of images. Normal and hysteromyoma images have similar uniformity value, which is much higher than that of cancer.
K-means clustering characteristic parameters of normal, hysteromyoma and cancer images (average of 50 images)
Table 4 shows the average parameter values of the GLCM. The mean value of cancer images is lower than those of both normal and hysteromyoma. The variance value of cancer images is much lower than those of both normal and hysteromyoma images. Normal and cancer images have similar third-order center distance value which is much higher than that of hysteromyoma, indicating the best symmetry of hysteromyoma images. Cancer images have much lower smoothness value than others because the color gradient in the GLCM matrix of the cancer image is more obvious. Normal and cancer images have similar uniformity value which is much lower than that of hysteromyoma.
GLCM characteristic parameters of normal, hysteromyoma and cancer images (average of 50 images)
Table 5 shows the average parameter values of the nucleus feature. Due to the malignant proliferation of cells in cancer tissue, the quantity and area value of cancer images are twice that of normal and hysteromyoma. The perimeter value of cancer images is much higher than those of normal and hysteromyoma. Cancer images have the lowest roundness values because cancer images have the flattest nuclei. The density value of cancer images is twice that of normal and hysteromyoma.
Nucleus characteristic parameters of normal, hysteromyoma and cancer images (average of 50 images)
Table 6 shows the results of cervical histopathology images classification using SVM combined with different feature methods. The dataset consists of 3,000 patches, including 1,000 normal, 1,000 hysteromyoma and 1,000 cancer images. The dataset was divided into training set and test set for experiments. Data splitting is performed in a ratio of 8 to 2, which means that 80% of the dataset is used for training and 20% for testing. As can be seen from the table, the values of the characteristic parameters of the normal, hysteromyoma and cancer pictures differ significantly. Parameters such as accuracy, sensitivity and specificity are applied to all individual features as well as to all combinations of features. The accuracy, sensitivity and specificity of SVM classifier combined with all features were 96.8%, 96.4% and 97.2%, respectively. When SVM was classified with first-order histogram, K-means clustering, GLCM and nucleus feature, the combination of nucleus feature was the best, while the combination of first-order histogram was the worst. Ashok et al. used SVM classifier combining GLCM, correlation, variance, and nucleus to classify cervical histopathology images and got 94.5% accuracy [25]. Athinarayanan et al. used SVM classifier combining GLCM, TCM and ETCM, respectively, to classify cervical histopathology images and finally obtained 72%, 78%, and 86% accuracy. Combining GLCM, TCM and ETCM to SVM to classify cervical histopathology images can obtain 94% accuracy [33].
Classification using SVM (3000 images as data set, 80% for training, 20% for testing)
In this paper, the combination of three texture features and one morphological feature with an SVM classifier for classifying cervical histopathology images is explored. We mainly focus on feature extraction and parameter calculation: quantify cervical histopathology images for statistical analysis. The accuracy of SVM classifier is improved by combining first-order histogram, K-means clustering, GLCM and nucleus feature. As we can see from the Table 6, SVM classifier has better performance when combining with all these four features. Finally, the classification accuracy of this method is 96.8%, sensitivity is 96.4% and specificity is 97.2%. SVM classifier combined with nucleus feature has better performance on accuracy, sensitivity and specificity, indicating that the proposed nucleus feature plays a key role in the classification of cervical histopathology images by SVM classifier. Compared with the results of other references classifying cervical histopathology images, the classification accuracy obtained in this paper is also very competitive.
In future work, we will pay more attention to feature extraction and feature selection. The technology developed to automatically analyze and evaluate images of cervical histopathology images is helpful for pathologists with precancerous lesion diagnosis and treatment planning. Additionally, we can explore some other applications in cellular image analysis involving identification of cell phenotype using deep learning.
Funding
This work was supported by grants from the National Natural Science Foundation of China (NSFC) (Grant numbers 61875056 and 62135003) and the Science and Technology Program of Guangzhou (Grant number 2019050001).
Footnotes
Conflict of interest
None to report.