



Abstract
BACKGROUND:
Fatty liver disease is a common condition caused by excess fat in the liver. It consists of two types: Alcoholic Fatty Liver Disease, also called alcoholic steatohepatitis, and Non-Alcoholic Fatty Liver Disease (NAFLD). As per epidemiological studies, fatty liver encompasses 9% to 32% of the general population in India and affects overweight people.
OBJECTIVE:
An Optimized Support Vector Machine with Support Vector Regression model is proposed to evaluate the volume of liver fat by image analysis (LFA-OSVM-SVR).
METHOD:
The input computed tomography (CT) liver images are collected from the Chennai liver foundation and Liver Segmentation (LiTS) datasets. Here, input datasets are pre-processed using Gaussian smoothing filter and bypass filter to reduce noise and improve image intensity. The proposed U-Net method is used to perform the liver segmentation. The Optimized Support Vector Machine is used to classify the liver images as fatty liver image and normal images. The support vector regression (SVR) is utilized for analyzing the fat in percentage.
RESULTS:
The LFA-OSVM-SVR model effectively analyzed the liver fat from CT scan images. The proposed approach is activated in python and its efficiency is analyzed under certain performance metrics.
CONCLUSION:
The proposed LFA-OSVM-SVR method attains 33.4%, 28.3%, 25.7% improved accuracy with 55%, 47.7%, 32.6% lower error rate for fatty image classification and 30%, 21%, 19.5% improved accuracy with 57.9%, 46.5%, 31.76% lower error rate for normal image classificationthan compared to existing methods such as Convolutional Neural Network (CNN) with Fractional Differential Enhancement (FDE) (CNN-FDE), Fully Convolutional Networks (FCN) and Non-negative Matrix Factorization (NMF) (FCN-NMF), and Deep Learning with Fully Convolutional Networks (FCN) (DL-FCN).
Keywords
Introduction
Steatohepatitis is known as Non-Alcoholic Fatty Liver Disease, a fast-rising public health issue that affects approximately 1 billion individuals throughout the world [1]. As per epidemiological studies, fatty liver encompasses 9% to 32% of the general population in India, which affects people who are overweight [2]. Computed tomography is a non-invasive method with high resolution and the images provide more information and relationship to neighboring organs [3]. In the past few years, machine learning technology has been used to effectively analyze the problems in the medical field and it has great potential in research applications [4]. The medical and patient records are considered as the input for a computer program to run a learning algorithm [5]. The diagnostic process using a classifier provides the details to the physician for analyzing a new patient’s reports [6, 7, 8, 9, 10]. Typically, non-specialist physicians are also able to diagnose the patient’s special problems.
The most accurate and reliable non-invasive method for measuring hepatic steatosis is currently quantitative chemical shift-encoded magnetic resonance imaging (CSE-MRI) [11]. In general, MRI has provided better diagnostic performance than ultra-sonography, but it has significant drawbacks [12]. When placing region of interest (ROI’s), parallel image artifacts and areas of motion have a negative impact on measurement accuracy, so these areas should be identified and avoided [13]. Subsequently, magnitude data based MRI is struggling to identify fat fractions more than 50% from fat fractions less than 50%–59% [14]. The fat percentage of the human liver occasionally surpasses 50%, however, that is rare [15]. Another concern is the existing MRI techniques’ limited scope to fix R2* [16]. Whenever there is a lot of iron, the signal loss can be so quick that it’s impossible to find the oscillation [17]. The relative cost of abdominal CT is very low while compared with MRI [18]. Also, CT has several advantages for assessing steatosis, including quick acquisition, simple analysis, convenience of use, and quantitative data [19].
Normally, deep learning is gaining popularity as an approach for computational image analysis that the potential enlarges the ability of liver images away from the possibility of traditional visual image processing by performing diagnostic/predictive tasks employing high dimensional image derived structures [20]. The volume of fat in the liver should be assessed to ascertain the stages of fatty liver. The existing methods [27, 28, 29, 30, 31] did not attain better classification results for fatty liver classification. These shortcomings have provoked to do this work.
The remaining manuscript is organized as follows: the literature survey is deliberated in Section 2, the proposed optimized support vector classifier with support vector regression methodology is illustrated in Section 3, Section 4 demonstrates the Horse Herd Optimization algorithm, Section 5 proves the results with discussion, and Section 6 concludes the work.
Literature survey
In the literature, recent papers published between 2020 and 2022 on liver fat classification are taken for review. Here, recent seven standard papers are taken from search engines such as Google Scholar and the methods, performance and limitations of these papers are analyzed.
Catania et al. [27] presented MRI-derived liver surface nodularity (LSN) score model for identifying the hepatic fibrosis in humans with NAFLD. MRI-LSN model analyses 47 patients with clinic pathological detection of NAFLD. The database was attained from a small clinic. For analyzing liver images of patient’s axial non-contrast T1-weighted 3D GRE was utilized. LSN score values between various stages were compared with Spearman’s correlation coefficient and Mann-Whitney U test for evaluating the correlation. The presented model was implemented in MATLAB. Thus, MRI-LSN method classified the patients with advanced fibrosis that provides high performance in terms of specificity, and sensitivity. However, the classification accuracy of MRI-LSN was very low.
Gong et al. [28] presented convolutional neural network for automated liver segmentation. Normally, liver segmentation process was necessary for radiation therapy planning of hepatocellular carcinoma and absorbed dose calculation. In the presented method, pre-processing was done by Fractional Differential Enhancement (FDE) model and the liver segmentation was processed using convolutional neural network method. The accurate liver segmentation was obtained using the evolution of active contour manner. The presented model was evaluated using two databases: LiTs, and 3DIRCAD band, which was simulated in Python tool. CNN-FDE model achieved better performance in volume difference, positive predictive value, and true positive rate but raised the error rate.
Goldman et al. [29] presented a Machine Learning (ML) to predict risks related with Non-Alcoholic Fatty Liver Disease, advanced fibrosis. The input images were obtained from Tel Aviv Medical Center Inflammation Survey (TAMCIS) database, which were given to ML model to prognosis the individual risk. The forecasted risk factor of individual involves the calculation of input independent variables through various time points. The findings were attained from predictive analytic tools. The model obtained improved performance after the incorporation of key variables and covariates. However, large database creates more error while predicting the risks.
Mojtahed et al. [30] presented a Deep Learning (DL) with Liver Volume Delineation method for volumetric and health assessment of liver with NAFLD. MRI input images from 48 patients were considered and evaluated using Hepatica
Zheng et al. [31] presented fully convolutional networks along non-negative matrix factorization (FCN-NMF) method for liver tumor segmentation. FCN-NMF model segment the liver tumors or fatty liver using abdomen images from CT scans, which was attained from the LiTs database. The input data was pre-processed and the tumor regions were identified by FCN-NMF that identifies the surface of tumors. Various clinical datasets were utilized for validating FCN-NMF approach. It attained accurate, smooth, and natural liver tumor surface, but the classification errors were higher.
Alirr [32] presented the deep learning method with fully convolutional neural network for liver organ and tumors segmentation of CT scans. The structure begins to segment liver organ from CT scan. The fully convolutional neural was trained for predicting coarse liver or tumor segmentation. Hence, the localized region-base level goal improves predicted segmentation for finding accurate final segmentation. Also, efficacy of the presented technique was authorized against two openly accessible datasets, such as LiTS, IRCAD datasets. The presented method was activated by Keras1 with Tensor Flow backend. Thus, the presented approach successfully segments the liver and tumor in heterogeneous CT scan from various scanners but the classification accuracy was low.
Scorletti et al. [33] investigated intestinal microbiota with NAFLD as well as the symbiotic mixture of probiotic and prebiotic agents that affect the content of liver fat, biomarkers of liver fibrosis, and composition of fecal micro biome in patients along NAFLD. The presented model used the database as Ribosomal Database Project that was carried out in USEARCH v10.0.240. The liver fat content was calculated by magnetic resonance spectroscopy (MRS) at the start and end of the study, liver fibrosis was executed through evaluated biomarker scoring, and vibration-control transient elastography. It attained mean baseline and end-of-study MRS liver fat percentage values in the synbiotic and placebo group. However, the classification accuracy was very low.
Proposed LFA-OSVM-SVR methodology
In this work, the Optimized Support Vector Machine with Support Vector Regression model (LFA-OSVM-SVR) is proposed for estimating the volume of liver fat by image analysis. Here, the input images are attained from two datasets named as liver images from the Chennai liver foundation and Liver Tumor Segmentation (LiTS) dataset.
Block diagram of the proposed methodology.
The input CT images are pre-processed using Gaussian smoothing filter and bypass filter. After that, the liver segmentation process is done on pre-processed CT images using U-Net methodology. Also, the Optimized Support Vector Machine (OSVM) method effectively classifies the fatty and normal liver images. Finally, the fat percentage of each fatty liver images are analysed by Support Vector Regression. Figure 1 portrays the process of the proposed method. On observing this Figure, the CT images are acquired in Digital Imaging and Communications in Medicine (DICOM) format, which is transformed to an image and steps like interpolation and normalization are performed. Liver segmentation is done to isolate the liver area to perform Hounsfield units (HU) transformation. The resultant units of training data are taken as the dependent variable in training the SVM model to classify the images. After that, the SVR model is tested by providing pixels as parameters. Thus, the output of the SVR is ported to a fat percentage value.
In this research, two types of datasets are used for fat analysis. The first dataset was collected from the Chennai liver foundation (real time dataset) and the second one is the standard LiTs dataset [34] used for additional samples. The LiTs dataset is used for training and the images from the Chennai liver foundation is used for testing purpose. The two categories of datasets are imbalanced dataset that involves 180 normal CT images and 365 fatty CT images, which are used for training as well as testing purpose. From the total 445 CT images, the images are classified into two that are normal (180 CT images) and fatty (365 CT images). For normal classification, total 180 CT images are separated into training images (45 CT images) and testing images (135 CT images). Similarly, for fatty classification, total 365 CT images are separated into training images (165 CT images) and testing images (200 CT images). In this work, the imbalanced dataset is balanced by improved fuzzy c-means (IFCM) model.
IFCM offers better results for overlapped dataset. IFCM is used for balancing the input dataset in terms of clustering process. Here, two datasets are considered: Chennai liver foundation and LiTs, which are defined as unbalanced datasets. To upgrade the accuracy, the unbalanced dataset converts as balanced dataset. IFCM is suggested to deal the unbalanced dataset. Every cluster size is considered at the process of cluster that is measured by membership values only without defuzzification. After that, the cluster size is presented to the formula of determining membership values, which decrease the influence from majority cluster samples to minority cluster. The results prove that this method deals unbalanced dataset efficiently and has better performance than typical FCM. The unbalanced dataset represents
where
Consider
Thereby, the distance from the sample to the cluster centres and the size of the clusters jointly determine membership values. As a result, the centre of the minority cluster is not significantly affected by samples from the majority cluster. The objective function is labelled in Eq. (3):
Equation (3) refers balanced dataset. Here, unbalanced dataset converts balanced dataset. The balanced input dataset is given to the preprocessing stage for removing unwanted effects.
The proposed work utilizes the filter models for reducing noise and improving intensity of images. Here, Gaussian smoothing filter is proposed for reducing the redundant information in the images and the Bypass filter is proposed for enhancing the image intensity. These pre-processing methods are applied to the input CT images.
The Gaussian smoothing filter is proposed for reducing the noise in the input images, which is similar to a mean filter, but it uses different kernel which is in a bell shape hump. Subsequently, the normalization process is performed on the images to correct the contrast of the images. Thus, the Gaussian smoothing filter is applied to the input images. Initially, the Gaussian smoothing mask is computed for every element in the images with 5
where
here
The normalized
The absolute accumulated error is calculated using Eq. (9):
here
In this work, U-Net model is proposed for performing segmentation process. Here, the U-Net can perform localization by looking deep as pixel by pixel. The segmentation results can be even more precise by adding augmented data to the master dataset. Segmented image is ported as pixels to the next stage. The size and shape of the image maintained as same for original image. Figure 2 depicts the steps of U-Net methodology for liver segmentation.
U-Net methodology for liver image segmentation.
It contains contracting path (left side) and expansive path (right side). Contracting path emulates general framework of convolutional network. It repeats application of 2 3x3 convolutions (unpadded convolutions), every one follows the rectified linear unit (ReLU), 2x2 max pooling function along stride two for down sampling. At every down sampling step, count of feature channels change to twice. Every step on expansive path contains sampling of feature map follows 2x2 convolution (“up-convolution”) that splits the count of feature channels, a concatenation with correspond cropped feature map from contracting path, and 2 3x3 convolutions, every one emulated by rectified linear unit. The cropping is needed because border pixels loss on each convolution. In last layer, 1x1 convolution is utilized to map every 64-component feature vector to choose count of classes. Totally, the network contains 23 convolutional layers. The input imagery along its associated segmentation maps are utilized to train the network including stochastic gradient descent processing of Caffe [6]. The output image is lesser than the input by stable border width because of unpadded convolutions. For minimizing the overhead and increasing use of graphics processing unit memory, increases the input tiles over increasing batch size, therefore less the batch to single image. When a high momentum (0.99) is applied, an increasing count of priory notice training samples determine the update in the present optimization stage.
The energy process is calculated using softmax function based on pixels through final fetaure map that is the combination of cross entropy loss function. The softmax function is calculated using Eq. (10):
where the activation function in the feature channel (
where the true label of every pixel value is mentioned as
The weight map is computed using image segmentation for compensating the changed frequency of image pixels, which are obtained from particular class in the training CT images. This measurement is forcing the network for identifying the segmentation borders that is initialized among the touching cells. Subsequently, the segmentation of borders is calculated based on the morphological functions and the weight map is measured using Eq. (12):
here
In this work, the optimized SVM method is proposed for characterizing the liver imagery as fatty liver and normal. The detailed process of SVM with SVR is outlined below.
Support Vector Machine for classification
SVM classifier is employed for fatty image classification with the help of hyper-plane to separate the feature space as normal, fatty with maximum margin. The SVM categorization is depending on kernels that makes hyper-plane amid the normal and fatty images for the intention of categorization. Assume the liver images (
where
After the classification, SVR process is proposed for analyzing fat percentage of each fatty liver image. SVR is a supervised learning algorithm, this is used to predict discrete values. In SVR, the best fitline is hyper plane. SVR try to fit the best line within the threshold and minimize the error between real and predicted value unlike other regression model. The pixel values are considered from the classified image as independent values and the calculated Hounsfield Unit (HU) is considered as dependent value. The pixels (
Consider
But the ideal constraints of Support Vector classifier required to be optimized for effective classification. The optimization algorithm depending on artificial intelligence is applied in Support Vector Machine classifier on account of its convenience, pertinence and inclusive belvedere. Herein, Horse Herd Optimization can be exploited to augment the SVM classifier for discovering the optimum parameters. Horse Herd Optimization is employed to tune hyper parameters of Support Vector classifier.
Typically, a few methods are applied for constraint formation, such as grid, random, manual explorations. These explorations share its abnormal weakness about reiteration time and lack of subterfuge-assembled familiar investigation. Hence, Horse Herd Optimization is proposed in this work to solve these issues.
In this work, the Horse Herd Optimization is proposed to enhance the parameter of classifier and performance. The optimization method decreased the computation time and enhanced the efficacy. Horse Herd Optimization is a new meta-heuristic method, which is incited by horse herding behavior for higher dimension optimization problems. It imitates the social performances of horses at various ages by 6 main structures: grazing, sociability, hierarchy, imitation, roam, defense mechanism. The sensitivity analysis is achieved to attain feasible values of coefficients utilized in algorithm. Horse Herd Optimization is chose, because it has its own improvement; better performance for dealing issues in high dimensions, also determine the better hyper parameters value depending on horse behavior in dissimilar ages.
The initial population of Horse Herd Optimization, i.e. constraints, decision variables and classification parameters are initialized. After the initialization procedure, randomly generate the parameters and compute the fitness function. Based on each horse position, it optimizes the parameters for classification. The mentioned procedure repeats till get the optimum solution. A detailed step-wise procedure is given below.
Step 1: Initialization process
At first, input parameters are initialized depending upon constraints along decision variables. The iterations including decision variables are scaled to minimize the complexity at the process of classification. Initialized the input parameters
where in, the input image denoted as
Step 2: Random generation
The constraints generated via the initialization procedure randomly in Horse Herd Optimization. The constraints are generated via the domain procedure on search space.
Step 3: Calculation of fitness function for optimizing OSVM parameters
After the completion of random generation, generates the value of fitness function, which is applied for maximizing the accuracy through decreasing the calculation time. The value of fitness function is scaled by the process of cost function that develops in HHO specified in Eq. (16):
here
Step 4: Update the position
By utilizing Euclidean distance, the distance amid the position of horse herd and stallion is assessed, as is expressed in Eq. (17):
where the search space dimension implies
The value of newly iteration is determined through
Step 5: Termination
To enhance the parameter of SVM classifier, the horse updated position through Eq. (18) is used. The acquired objective function is employed to raise the accuracy through lessening the computational time with error. At last, the best values are selected from the SVM classifier through HHO mechanism, which are effectively categorized the normal and fatty liver images with high accuracy. Finally, the performance metrics of the proposed LFA-OSVM-SVR approach is calculated.
The performance of the proposed LFA-OSVM-SVR approach is evaluated in terms of performance metrics. The simulation of this methodology is carried out in Python. It is implemented on PC along Windows 10 operating system, 2GB random access memory, Intel i3 core processor. The simulation parameters of the proposed LFA-OSVM-SVR approach are shown in Table 1.
Simulation parameter
Simulation parameter
The proposed LFA-OSVM-SVR approach has attained improved performance in terms of accuracy, precision, recall, f1-score, error rate, then analyzed with existing methods, like CNN-FDE [28], FCN-NMF [31], and DL-FCN [32] methods respectively.
In this research, CT scan images from the Chennai liver foundation (real time dataset) and LiTs [34] datasets are used for processing. In this, total number of images is 251 that CT images are acquired in a specialized format called DICOM. Generally, DICOM is used as a standard medium for storing CT scans for its ability to store both the images and data. Time-series images are stored as slices alongside the information of the patients in the header. DICOM images are converted to images using pydicom [35] a python package for processing DICOM files to an image by preserving the data as a header and slices of images as metadata. Slices of images with “.png” format are sent to the preprocessing pipeline.
CT Scans are collected using Optima CT660 by GE Medical Systems. The dataset samples consist of 30 males and 20 females. The research is conducted at RPS Chennai Liver Foundation, Chennai, under the supervision of a Liver Transplant Surgeon. The clinical retrospective research is approved by the ethical clearance committee Chennai, Tamil Nadu, India. CT data is collected by prior written consent from the patients.
The LiTS data is taken from various hospitals and intra-slice resolutions of CT scan varies among 0.45 mm and 6 mm. Hence, LiTS dataset consists of 395 sample images [34]. Also, the inter-slice resolutions are varied among 0.6 mm and 1.0 mm for inter-slices.
From the total 445 CT images, the images are classified as normal (180 CT images) and fatty (365 CT images). For normal classification, total 180 CT images are separated into training images (45 CT images) and testing images (135 CT images). Similarly, for fatty classification, total 365 CT images are separated into training images (165 CT images) and testing images (200 CT images).
The confusion matrix can be used to measure the classifier accuracy and to display the connection between outcomes and predicted classes, which is utilized for calculating the performance metrics. The confusion matrix is represented in Table 2.
Confusion matrix of the proposed model
Confusion matrix of the proposed model
Input CT images.
CT liver images (a) before pre-processing (b) after pre-processing.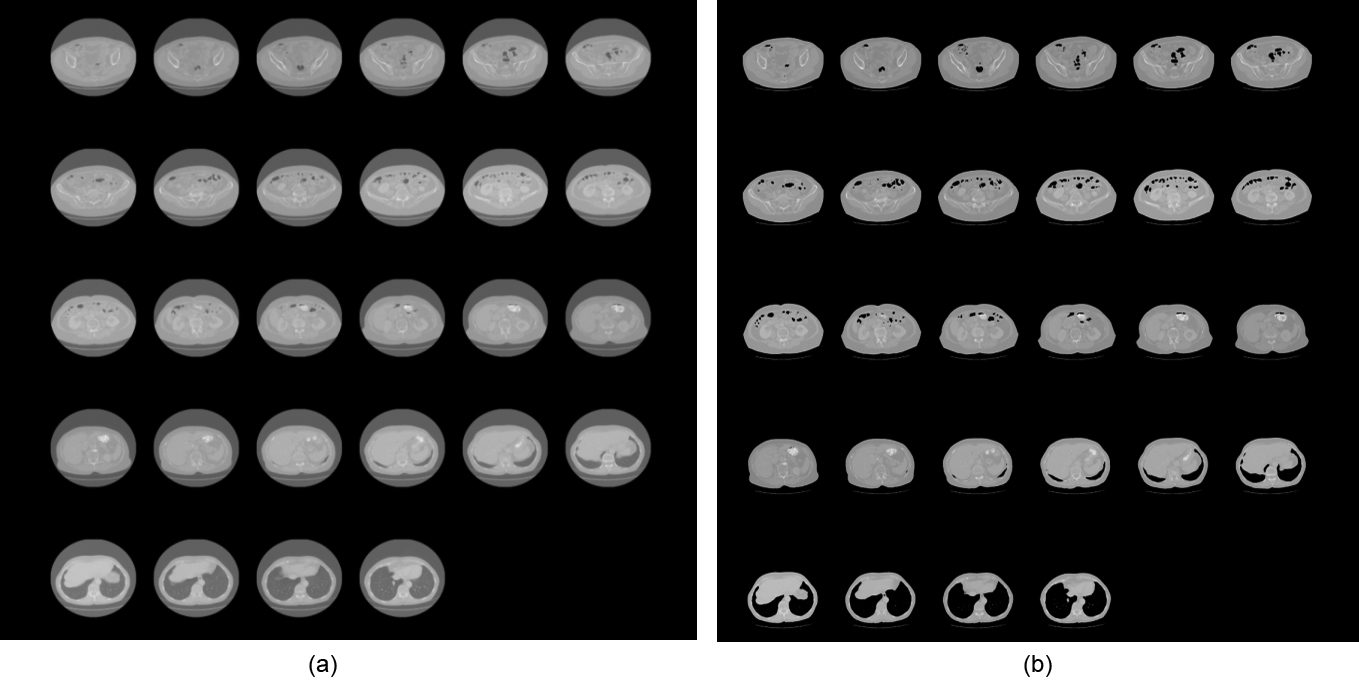
The input images are attained from dataset that is used for training and testing of proposed approach. The sample input CT liver images are portrayed in Fig. 3. The input CT images are given to Gaussian smoothing filter for reducing the unwanted noise and errors. The bypass filter is used for improving the image intensity. The CT liver images before pre-processing and after pre-processing are shown in Fig. 4. The pixel intensity of the input CT images is shown in Fig. 5 and the pixel intensity value of images after the completion of pre-processing process is shown in Fig. 6.
Pixel intensity before pre-processing.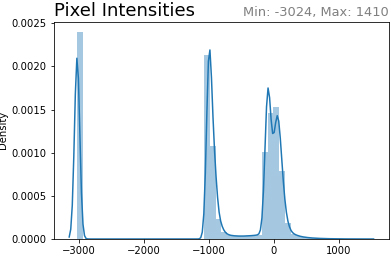
Pixel intensity after pre-processing.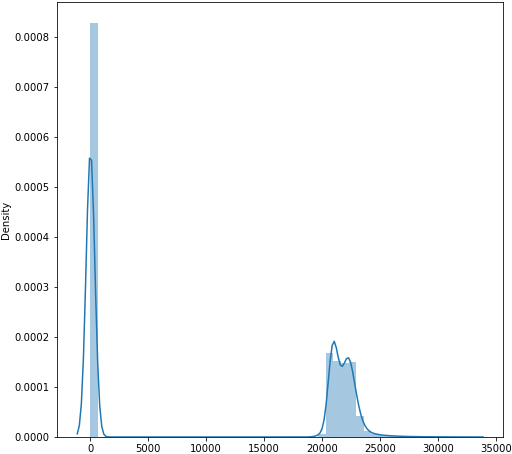
Liver segmentation utilizing U-Net model.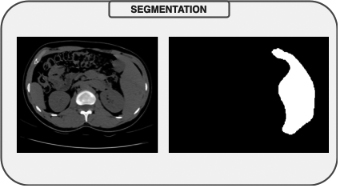
The pre-processed images are segmented using U-Net method that is given in Fig. 7. After that, the fatty liver images and normal liver images classified using the optimized support vector machine approach. Subsequently, SVR model is used to analyze the fat percentage. Figure 8 displays the fat percentage evaluated values by the SVR model. In this, the input fatty image with actual fat percentage 62.147% is validated with various quantities of trained data. Finally, the predicted fat percentage is attained. As a result, the prediction results are improved by increasing the training data percentage. Finally, the performance metrics is analyzed to validate the proposed method performance.
Evaluation of Fat percentage using SVR.
The performance of LFA-OSVM-SVR method is examined under accuracy, specificity, precision, recall, f-score, and error rate. To scale the performance, the following confusion matrix is essential.
Normal liver images are properly recognized into normal is denoted as true positive ( Fatty liver images are properly recognized into fatty is represented as false positive ( Fatty liver images are imperfectly recognized into normal is denoted as true negative value ( Normal images are imperfectly recognized into fatty liver images are represented as false negative (
The efficacy of proposed LFA-OSVM-SVR method is identified when classifying fatty liver imagery from data samples:
This is measuring the efficacy of the proposed LFA-OSVM-SVR during classification:
This is employed to identify the normal liver imagery from the data samples:
This is the ability of proposed classifier to categorize the total imagery:
It includes the balance amid the precision and recall value:
Error rate calculation is defined as the inaccurate prediction and classification of fatty liver by the proposed approach, which is measured using Eq. (24):
The efficiency of LFA-OSVM-SVR is analyzed with existing Convolutional Neural Network with Fractional Differential Enhancement (CNN-FDE) [28], FCN with Non-negative Matrix Factorization (FCN-NMF) [31], and Deep Learning with Fully Convolutional Networks (DL-FCN) [32] methods.
Performance metrics comparison
Performance metrics comparison
Table 3 shows comparison of performance metrics measurement for proposed LFA-OSVM-SVR and existing methods. Here, the efficiency of the proposed LFA-OSVM-SVR model is higher than the existing approaches like CNN-FDE, FCN-NMF, and DL-FCN approaches. The accuracy calculation of the proposed LFA-OSVM-SVR approach for fatty image classification is 33.4%, 28.3%, and 25.7% higher than the existing methods like CNN-FDE, FCN-NMF, and DL-FCN techniques respectively. Moreover, the accuracy validation of the LFA-OSVM-SVR approach for normal image classification is 30%, 21% and 19.5% better than the existing CNN-FDE, FCN-NMF, and DL-FCN respectively. The precision calculation of the proposed LFA-OSVM-SVR approach for fatty image classification is 28%, 35.8%, and 20.5%, higher than the existing methods like CNN-FDE, FCN-NMF, and DL-FCN approaches respectively. Additionally, the precision validation of the LFA-OSVM-SVR approach for normal classification is 21.3%, 33% and 15% better than the existing CNN-FDE, FCN-NMF, and DL-FCN approaches respectively. The recall calculation of the proposed LFA-OSVM-SVR approach for fatty image classification is 26%, 31.5%, and 17.6% higher than the existing methods like CNN-FDE, FCN-NMF, and DL-FCN approaches respectively. Additionally, the recall validation of the LFA-OSVM-SVR approach for normal classification is 18.72%, 33.6% and 35% better than the existing CNN-FDE, FCN-NMF, and DL-FCN approaches respectively. The specificity calculation of the proposed LFA-OSVM-SVR approach for fatty image classification is 41.3%, 21%, and 34%, higher than the existing methods like CNN-FDE, FCN-NMF, and DL-FCN approaches respectively. Additionally, the specificity validation of the LFA-OSVM-SVR approach for normal classification is 42%, 12.6% and 39.5% better than the existing CNN-FDE, FCN-NMF, and DL-FCN approaches respectively.
F-measure calculation of the proposed LFA-OSVM-SVR approach for fatty image classification is 49%, 45%, and 56.5% higher than the existing methods, like CNN-FDE, FCN-NMF, and DL-FCN approaches respectively. Additionally, the F-measure validation of the LFA-OSVM-SVR approach for normal classification is 48%, 24.6% and 34.7% better than the existing CNN-FDE, FCN-NMF, and DL-FCN approaches respectively. The error rate calculation of the proposed LFA-OSVM-SVR approach for fatty image classification is 55%, 47.7%, 32.6% lesser than the existing CNN-FDE, FCN-NMF, and DL-FCN approaches respectively. Additionally, error rate validation of the LFA-OSVM-SVR approach for normal classification is 57.9%, 46.5%, and 31.76% lesser than the existing CNN-FDE, FCN-NMF, and DL-FCN approaches respectively.
Figure 9 displays the comparison of ROC curve. Here, the ROC of proposed LFA-OSVM-SVR method provides 12.25%, 21.38% and 33.17% greater AUC than the existing methods, like CNN-FDE, FCN-NMF, and DL-FCN approaches. Figure 10 shows the comparison of fat percentage prediction. In this, the proposed LFA-OSVM-SVR approach has attained 16.7%, 17.6%, and 21.84% higher prediction in fat percentage than the existing approaches, like CNN-FDE, FCN-NMF and DL-FCN methods respectively.
The proposed LFA-OSVM-SVR method is compared with support vector machine classifier, decision tree, random forest, Gradient Boosting, Artificial Neural Network (ANN) algorithms.
Accuracy comparison with different classifiers
Accuracy comparison with different classifiers
Comparison of RoC curve.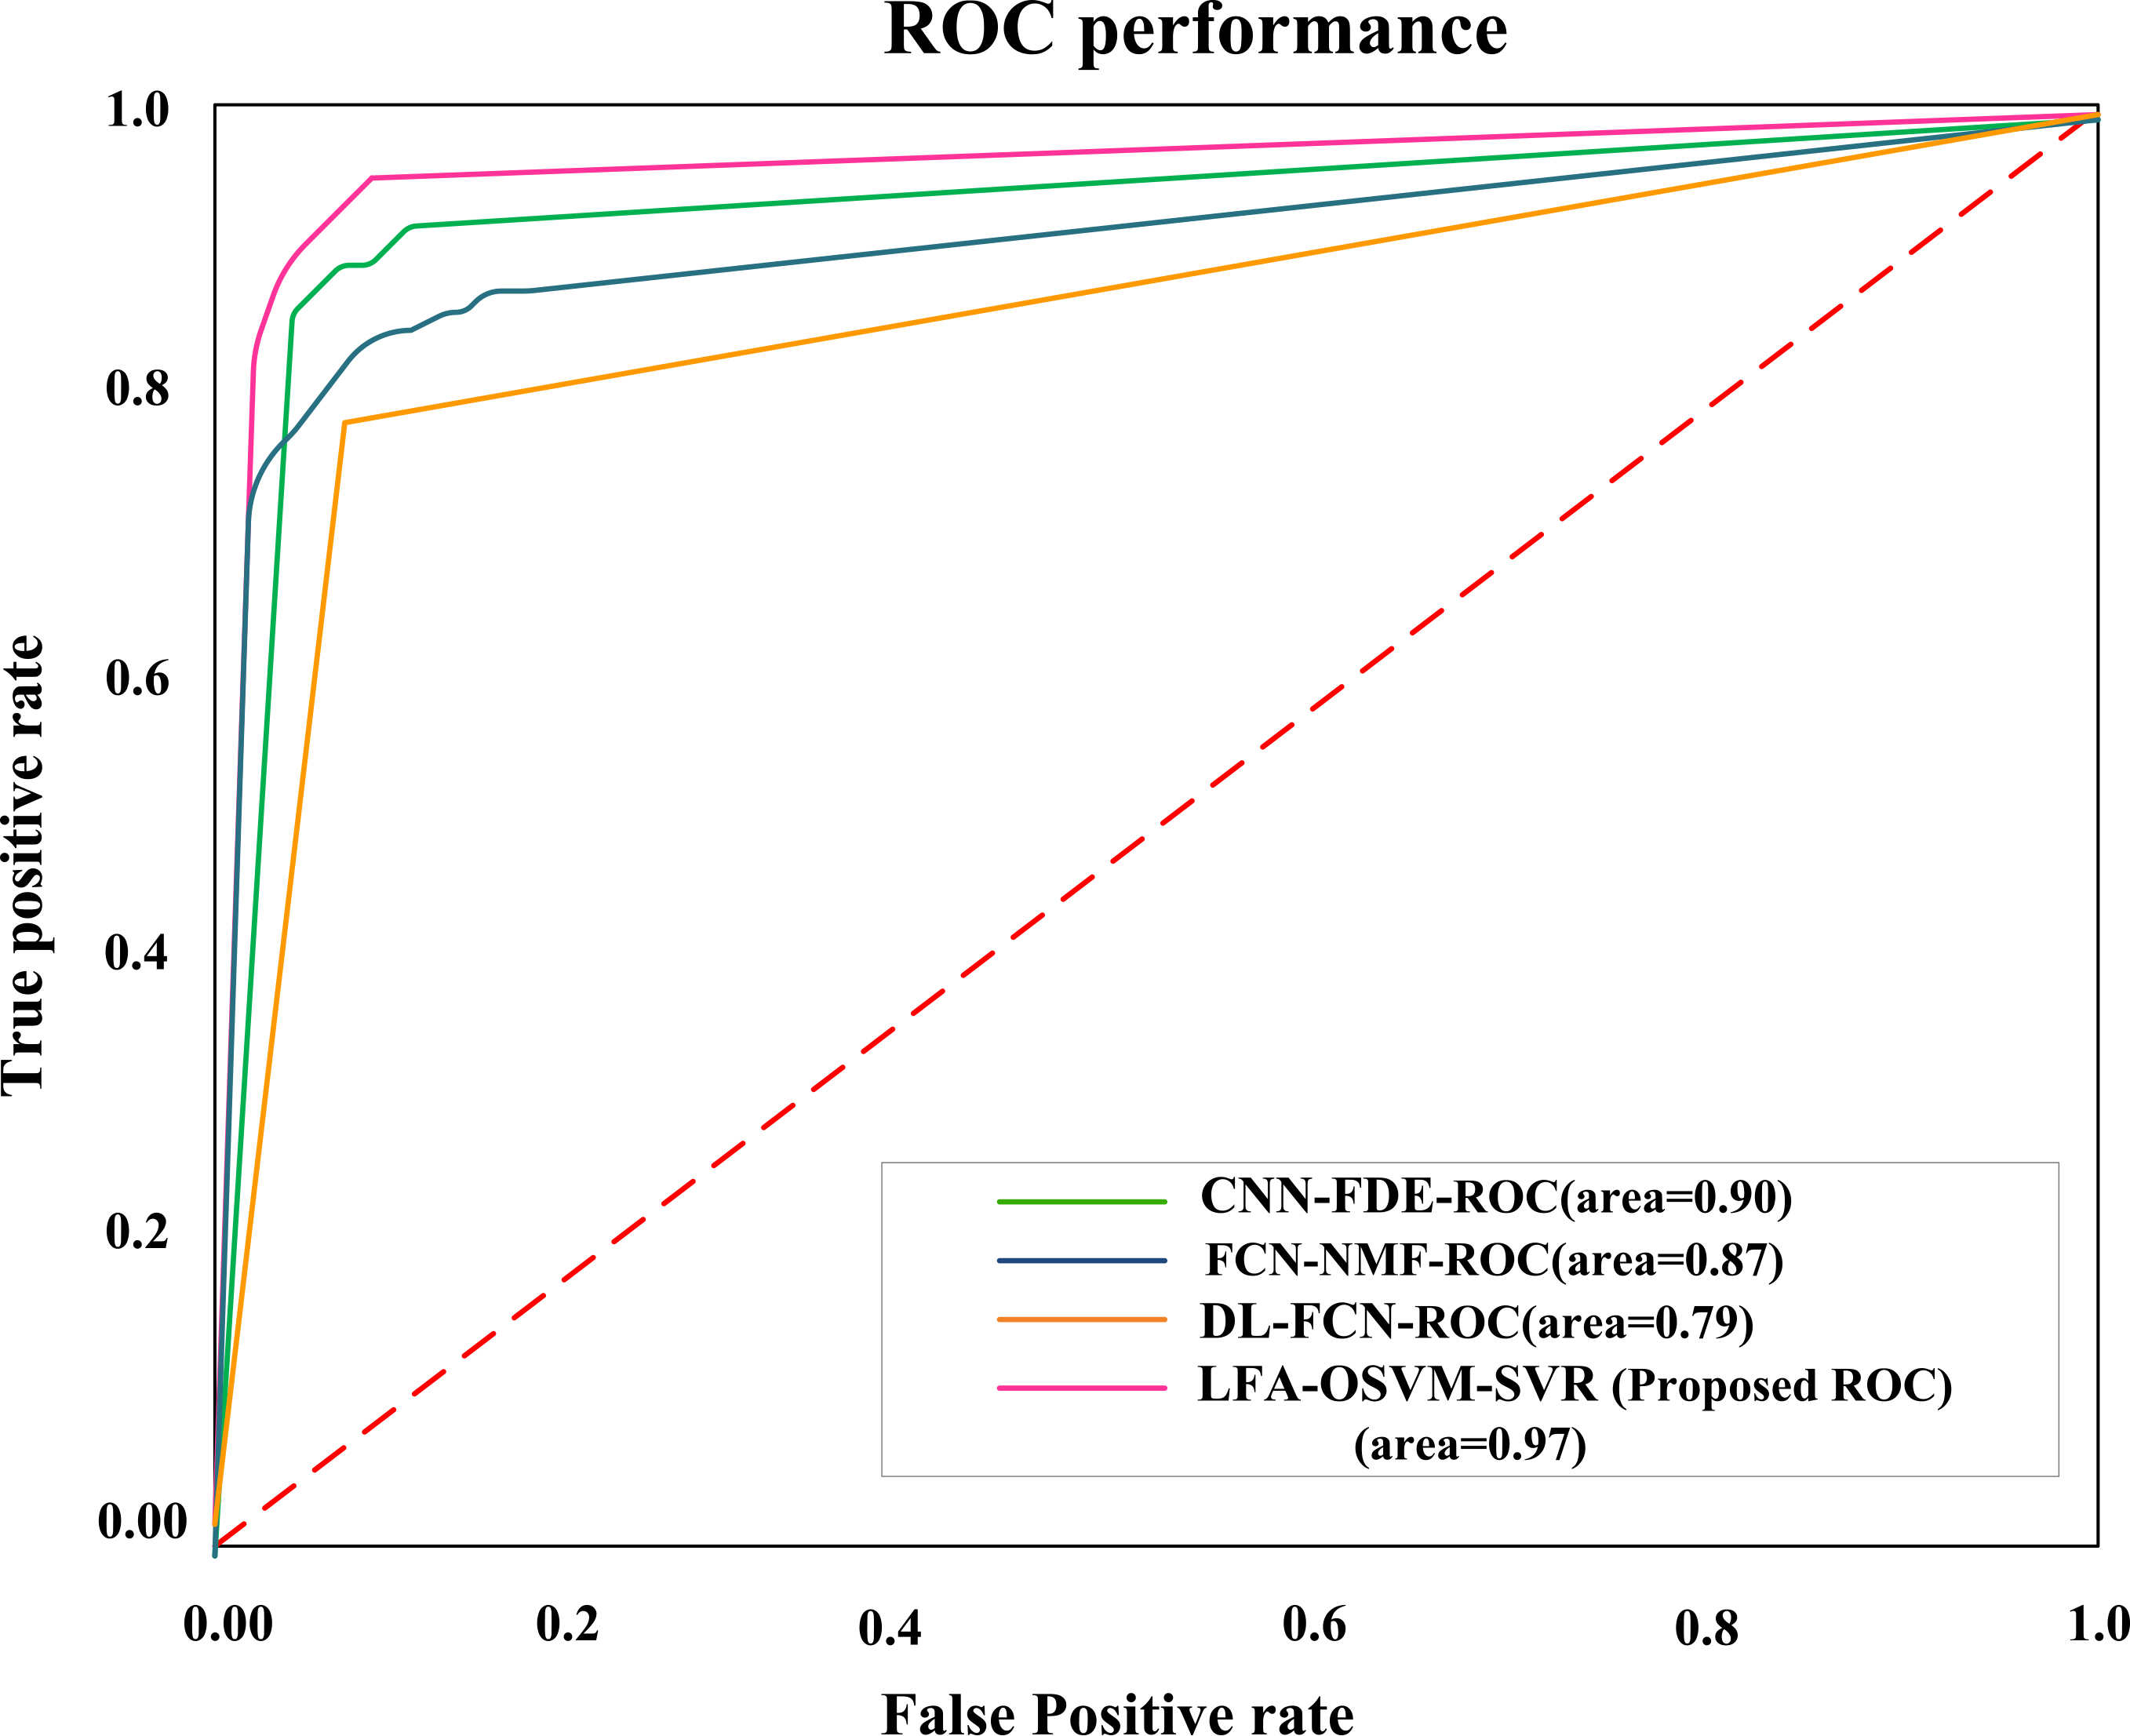
Comparison of fat percentage prediction.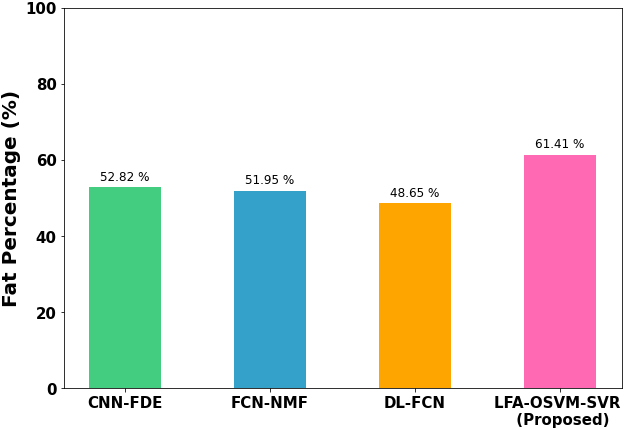
Table 4 shows the accuracy comparison with different classifiers. The classification efficiency of various classifiers for various disease classification is analyzed. From the results, the proposed Optimized SVM with SVR classifier has achieved high classification accuracy than other classifiers.
In this manuscript, Optimized Support Vector Machine with Support Vector Regression model (LFA-OSVM-SVR) is successfully implemented in Python for evaluating the volume of liver fat. The input CT images are attained from the Chennai liver foundation (real time dataset) and LiTS dataset that are pre-processed and segmented. After that, Optimized Support Vector Machine has effectively classifies the fatty liver images. Subsequently, the support vector regression (SVR) is utilized for analyzing the fat in percentage. The proposed LFA-OSVM-SVR approach has attained better performance in terms of 28%, 35.8%, 20.5% higher precision, 26%, 31.5%, 17.6% higher recall, 21.9%, 35.9%, 23.7% higher sensitivity, 41.3%, 21%, 34% higher specificity, and 49%, 45%, 56.5% higher F-measure for fatty image classification than the existing CNN-FDE, FCN-NMF, and DL-FCN approaches respectively. Also, the proposed LFA-OSVM-SVR approach has attained 21.3%, 33%, 15% higher precision, 18.72%, 33.6%, 35% higher recall, 20.2%, 34.26%, 23.8% higher sensitivity, 42%, 12.6%, 39.5% higher specificity, 48%, 24.6%, 34.7% higher F-measure for normal classification than the existing CNN-FDE, FCN-NMF, and DL-FCN approaches respectively.
Footnotes
Conflict of interest
None to report.