Preeclampsia (PE) has adverse effects on pregnant women, fetuses, and newborns [1], and accounts for 3%–10% of pregnancy-related diseases globally.
OBJECTIVE:
This study aimed to screen a series of prenatal markers (pregnancy-associated plasma protein [PAPP-A], -human chorionic gonadotropin [-hCG], alpha fetoprotein [AFP], and estriol [uE3]) to establish a risk model and evaluate the diagnostic values of the markers for predicting PE.
METHODS:
Sixty-five pregnant women were enrolled in this study. They were divided into two groups containing healthy pregnant women ( 51, the non-PE group) and pregnant women with PE ( 14, the PE group). According to the stage of pregnancy, the pregnant women in each group were divided into early, middle, and late pregnancy groups for statistical analysis. The levels of PAPPA-A -hCG, AFP, and uE3 were compared among these groups. Then, a risk model was established, and PE was diagnosed using receiver operating characteristic (ROC) curve results.
RESULTS:
In the early pregnancy group, the differences in the levels of PAPP-A, AFP, and uE3 between the PE and non-PE groups were statistically significant ( 0.001, 0.029, and 0.033, respectively), while the difference in the single remaining marker was not statistically significant. A ROC curve analysis revealed that in early pregnancy, the sensitivity and specificity of PAPP-A were 76.5% and 71.4%, respectively, and the sensitivity and specificity of -hCG were 82.4% and 57.1%, respectively. The sensitivity and specificity of the combination of the two markers for diagnosing PE were 86.3% and 57.1%, respectively.
CONCLUSION:
This study demonstrated that the combination of PAPP-A and -hCG has diagnostic value for PE in pregnant women. Accordingly, we should formulate innovative PE screening strategies to target the prevention of PE and create important conditions for predictive and preventive personalized medical treatments.
Preeclampsia (PE) is a pregnancy-related disease originating from the placenta that has adverse effects on pregnant women, fetuses, and newborns [1]. Globally, PE accounts for 3%–10% of pregnancy-related diseases, especially in developing countries [2]. The diagnosis of PE depends on the presence of critical symptoms, including new-onset hypertension with proteinuria and/or thrombocytopenia, renal insufficiency, cardiopulmonary damage, and liver function impairment [1]. Typically, PE occurs after week 20 of pregnancy [1], and once confirmed, immediate prenatal care should be provided until delivery [3]. Therefore, it is very important to diagnose PE as early as possible and implement corresponding treatment measures. At present, researchers have studied pregnancy screening parameters for predicting PE and have obtained meaningful results [4, 5, 6, 7]. However, no consensus has yet been reached on the selection of the predictors of PE risk [7, 8, 9].
Some studies have reported that biomarkers derived from the placenta are more valuable in predicting placental diseases and are more inclined to be used in combined models for predicting PE risk [10, 11]. In early pregnancy, the combinations of pregnancy-associated plasma protein (PAPP-A) with -human chorionic gonadotropin (-hCG), and alpha fetoprotein (AFP) with estriol (uE3) are routinely used in the screening of fetal aneuploidy [12, 13, 14]. Pregnancy-associated plasma protein is a placenta-related matrix metalloproteinase that can be bind to zinc [3]. Some researchers have revealed that a reduced concentration of PAPP-A in early pregnancy is related to placental defects and have value for predicting PE [4, 6, 7, 15]. -human chorionic gonadotropin is produced by placental trophoblast cells and promotes angiogenesis. Therefore, it may be involved in the development of PE [16]. In their research, Chen et al. found that the levels of serum PAPP-A and -hCG were predictive markers for PE [17]. Bernardes and other researchers found that clinical risk factors, such as gestational age, had a potential impact on the incidence of PE [18]. Therefore, combining biomarkers (PAPP-A, -hCG, etc.) with clinical risk factors may improve the success rate of PE prediction [19, 20].
Screening in the middle and late stages of pregnancy may help to reduce the risk in early pregnancy, evaluate the effectiveness of preventive treatment, and optimize the management of high-risk pregnancies [21]. Therefore, this study performed the following: (1) A comparison of PAPP-A, -hCG, AFP, and uE3 levels between women with normal pregnancies and those with PE pregnancies in the early, middle, and late stages of pregnancy. (2) An evaluation of the combined use of pregnancy biomarkers (PAPP-A, -hCG, AFP, and uE3) and clinical risk factors (gestational age, body mass index [BMI], gestational week of delivery, etc.) to establish a prediction model for PE risk. (3) An evaluation of the prediction model.
Materials and methods
Subjects
A total of 756 pregnant women who underwent prenatal examinations in the obstetric clinic of Shanxi Provincial People’s Hospital between April 2021 and April 2022 were selected for this study. The inclusion criteria were pregnant women (1) who were residents of Taiyuan city, (2) who were between 18 and 45 years of age, (3) who received regular antenatal examinations until delivery in our hospital, and (4) who had a singleton pregnancy. The exclusion criteria were pregnant women (1) who had a spontaneous abortion, (2) who had multiple pregnancies, (3) who received infertility treatment, (4) who received prenatal examinations in our hospital in early pregnancy and left our hospital in mid- or late pregnancy, and (5) who suffered from chronic diseases before pregnancy and received relevant medical treatment. Based on the above criteria, 691 women were excluded, and 65 pregnant women participated in the study.
A diagnosis of PE was made based on the criteria of the American College of Obstetricians and Gynecologists [1], as follows: systolic blood pressure 160 mmHg or diastolic blood pressure 110 mmHg, with an interval of at least 4 hours; normal blood pressure before the onset of hypertension after 20 weeks of pregnancy, and the presence of proteinuria, ( 0.3-g protein in 24-hour urine samples or 2 [] proteinuria on urine test paper). Women with such indicators were diagnosed with PE. A normal pregnancy was defined as a full-term delivery ( 37 weeks) without pregnancy complications. The study objects were divided into two groups: the PE group ( 14) and the non-PE group ( 51).
In the study, all procedures involving human participants complied with the ethical standards of institutions, national research councils, and the Declaration of Helsinki. The study plan was approved by the Ethics Committee of the Fifth Clinical Medical College of Shanxi Medical University. Informed consent was obtained from all subjects.
Data acquisitions
Detailed information on the enrolled pregnant women was recorded, including age, gestational weeks, height, weight, gestational weeks at delivery, time of delivery, previous prenatal examinations, medical history, and medication history. After fasting for 8 hours, the venous blood of the subjects was collected the following morning (07:00–09:00 am). The venous blood samples were placed in anticoagulation tubes containing heparin sodium, centrifuged at 3,800 rpm for 8 minutes, and placed in a 80C freezer prior to subsequent use. The test items included the biomarkers PAPP-A, -hCG, AFP, and uE3.
Determination of biomarkers
The detection of PAPP-A was conducted using an original imported kit from Roche Diagnostic Products (Shanghai, China) Co., Ltd. and a Roche Cobas E602 electrochemiluminescence automatic detector. According to the manufacturer’s information, the coefficient of variation of the intra-batch precision of PAPP-A (mIU/L) was 2%, and the coefficient of variation of inter-batch precision was 2.8%.
The detection of -hCG, AFP, and uE3 was performed using a UniCel DxI 800 instrument (Beckman Coulter, USA). The samples were pretreated and analyzed according to the manufacturer’s instructions, and quality control was performed on each analysis batch. The coefficients of variation of the intra-batch precision of -hCG (mIU/L), AFP (ng/mL), and uE3 (ng/mL) were 3.6%, 3.22%, and 7.7%, respectively; the coefficients of variation of inter-batch precision were 6.0%, 3.22%, and 4.7%, respectively.
Statistical analysis
The statistical analyses in this study were performed using SPSS Statistics for Windows v. 25.0 (IBM Corp., Armonk, NY, USA) software. Based on the pregnancy stage, the PE group and the non-PE group were divided into early pregnancy, middle pregnancy, and late pregnancy groups for statistical analysis. First, it was determined whether the data corresponded to a normal distribution. Normally distributed data were compared using a one-way analysis of variance, and abnormally distributed indicators were compared using a nonparametric Kruskal-Wallis test. A binary logistic regression analysis was used to establish a prediction model for PE risk in pregnancy using singles or multiples of PAPP-A, -hCG, AFP, and uE3 in combination with related clinical risk factors. The receiver operating characteristic (ROC) curve of the variables was plotted, and the cut-off values and the sensitivity and specificity of each cut-off value were determined. A value of 0.05 was considered statistically significant.
Results
Basic characteristics of the subjects
Table 1 presents the basic characteristics of the pregnant women in the PE and non-PE groups. The average age of the pregnant women was 31.33 years in the PE group and 29.19 years in the non-PE group, and the difference in the average age between the two groups was statistically significant ( 0.039). The average BMI of the pregnant women in the PE group was lower than that in the non-PE group during pregnancy, and the difference in BMI between the two groups in late pregnancy was statistically significant ( 0.046). The average parity in the PE group was higher than in the non-PE group, and the difference was not statistically significant ( 0.306).
Basic characteristics of study population
Characteristics
PE ( 14)
non-PE ( 51)
-value
Maternal age
31.33 1.21
29.19 0.46
0.039
Gestational weeks
1st
10.75 0.67
11.48 0.23
0.186
2st
22.08 0.93
23.29 0.43
0.271
3st
30.08 0.40
30.86 0.43
0.973
BMI
1st
22.31 1.03
22.74 0.43
0.328
2st
24.00 0.96
25.44 0.47
0.973
3st
27.32 0.96
28.55 0.43
0.046
Parity
1.42 0.15
1.24 0.08
0.306
Anemia
Yes
2 (14.29%)
3 (5.88%)
0.300
No
12 (85.71%)
48 (94.12%)
Gestational diabetes mellitus
Yes
2 (14.29%)
14 (27.45%)
0.315
No
12 (85.71%)
37 (72.55%)
Gestational weeks at delivery
34.42 1.06
38.76 0.17
0.001
Note: Data are presented as (%) for categorical variables and mean standard deviation (SD) for continuous variables. Abbreviation: PE, pre-eclampsia; BMI, body mass index.
All recruited pregnant women had a non-smoking history. During pregnancy, 14.29% ( 2) of the pregnant women in the PE group and 5.88% ( 3) of the pregnant women in the non-PE group suffered from anemia, and 14.29% ( 2) of the pregnant women in the PE group and 27.45% ( 14) of the pregnant women in the non-PE group suffered from gestational diabetes mellitus.
The average gestational age of delivery in the PE group was 4.34 weeks earlier than in the non-PE group, and the difference between the two groups was statistically significant ( 0.001).
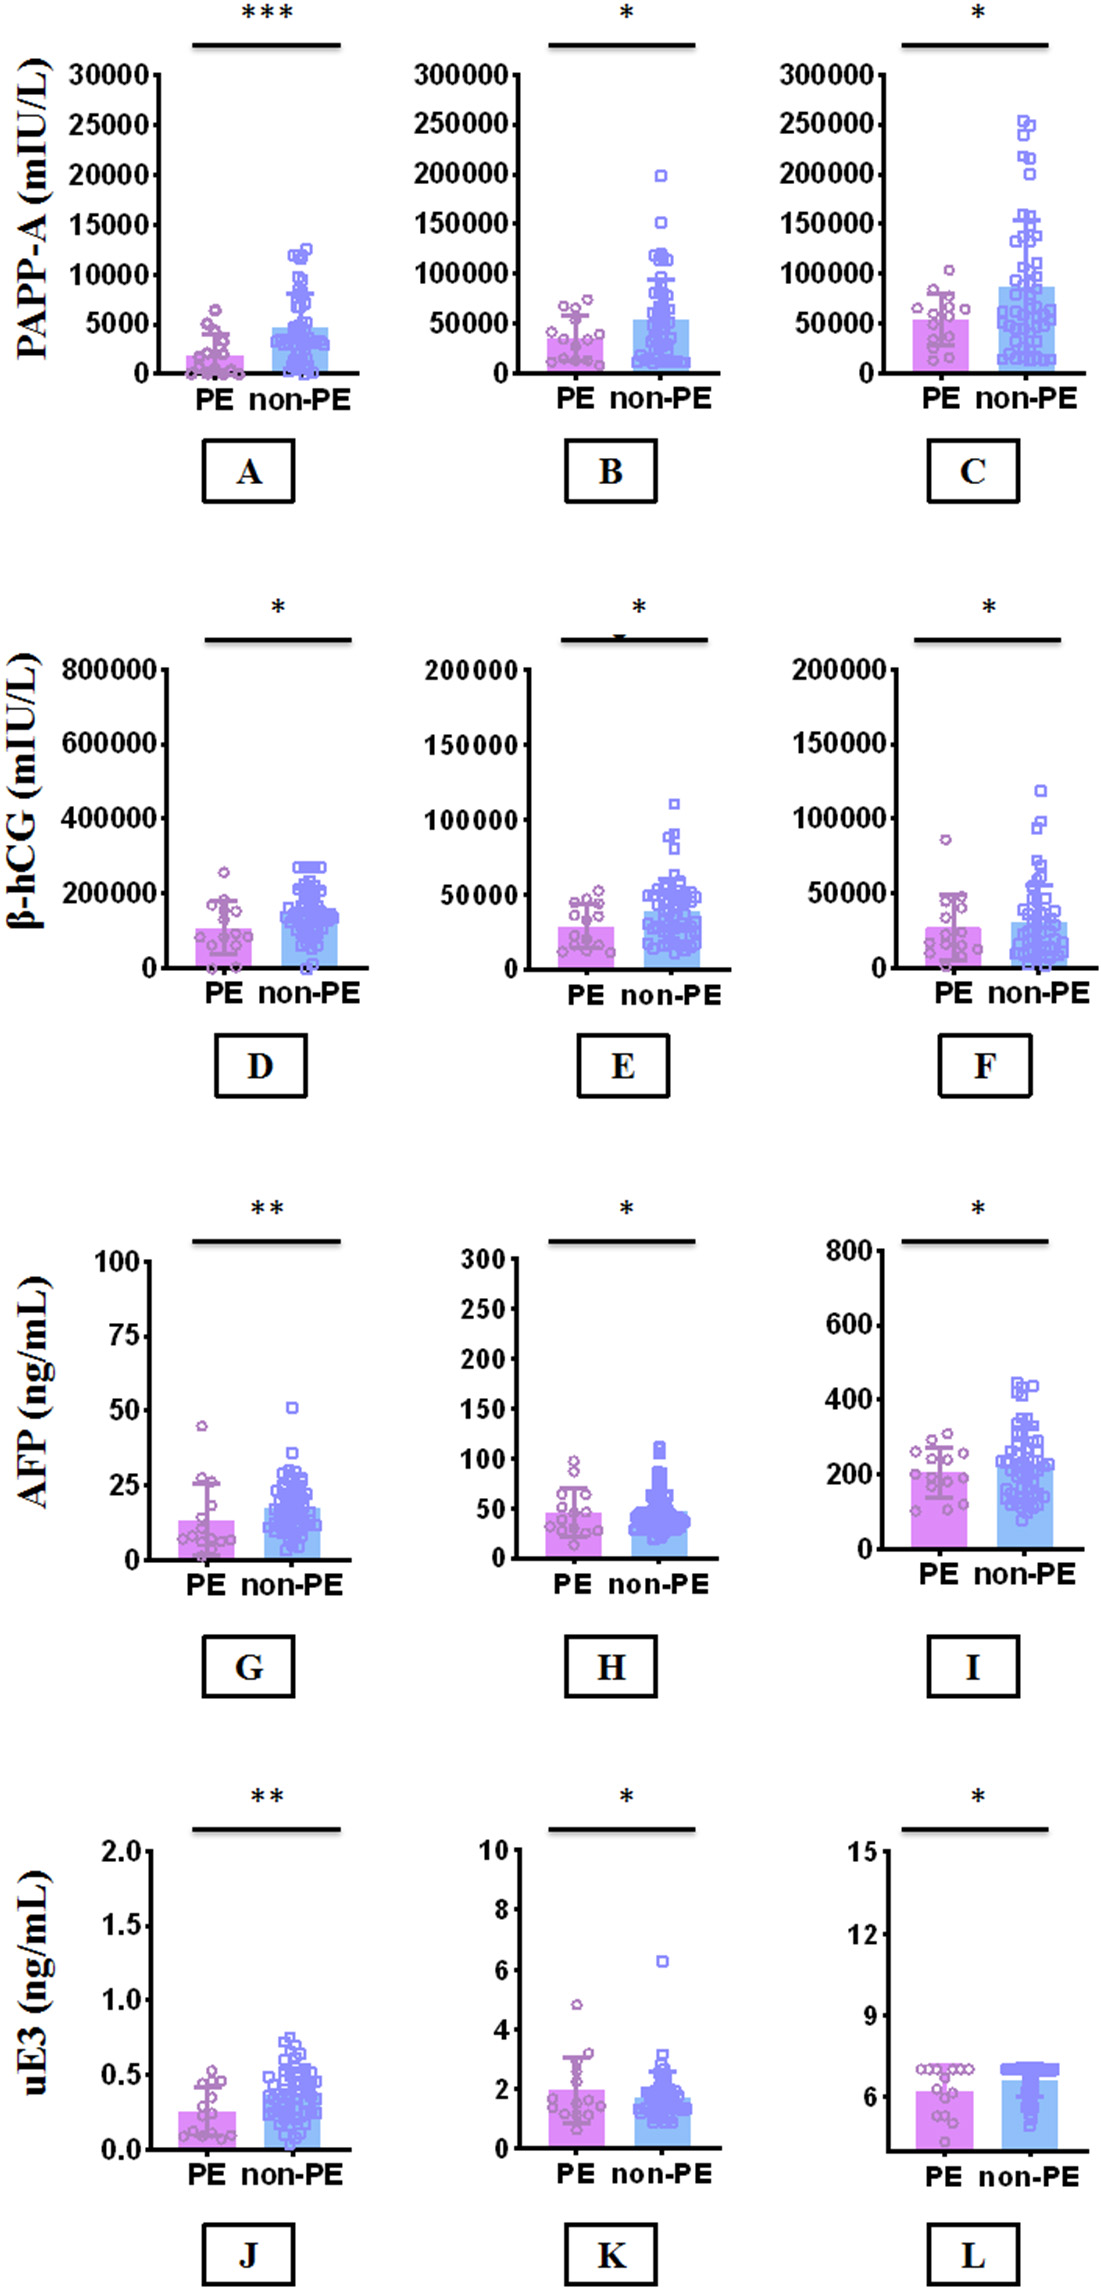
Comparison of PAPP-A, -hCG, AFP, and uE3 between PE group and non-PE group in the 1st, 2nd and 3rd. The levels of PAPP-A are compared in 1st (A), 2nd (B), and 3rd (C); the levels of -hCG are compared in 1st (D), 2nd (E), and 3rd (F); the levels of AFP are compared in 1st (G), 2nd (H), and 3rd (I); the levels of uE3 are compared in 1st (J), 2nd (K), and 3rd (L). values for between group comparison of nonparametric quantitative data using Kruskal-Wallis tests. values for differences between PE group and non-PE group were more than 0.05; values for differences between PE group and non-PE group were less than 0.05; values for differences between PE group and non-PE group were less than 0.001. Note: PAPP-A, pregnancy-associated plasma protein A; -hCG, -human chorionic gonadotropin; AFP, alpha-fetoprotein; uE3, unconjugated estrio; PE, pre-eclampsia.
Comparison of biomarkers between the PE and non-PE groups
A comparison of the biomarkers in early, mid-, and late pregnancy (PAPP-A, -hCG, AFP, and uE3) between the PE and non-PE groups is shown in Fig. 1. During pregnancy, PAPP-A, AFP, and uE3 showed an upward trend, while -hCG first increased and then decreased. In the comparison of early pregnancy, the differences in the levels of PAPP-A, AFP, and uE3 between the PE and non-PE groups were statistically significant ( 0.001, 0.029, and 0.033, respectively). In the comparisons of middle and late pregnancies, the biomarker (PAPP-A, AFP, and uE3) levels between the PE group and the non-PE group were not statistically significant ( 0.05).
The difference in the levels of -hCG in the PE group and the non-PE group during pregnancy was not statistically significant ( 0.05). During pregnancy, the PAPP-A level in the PE group was always lower than in the non-PE group. The mean values of AFP and uE3 in the PE group were higher than those in the non-PE group in mid-pregnancy, while the mean values of AFP and uE3 in the PE groups were lower than those in the non-PE group in early and late pregnancy. However, the levels of -hCG presented a reverse trend; in the PE group, the -hCG levels were higher than those in the non-PE group in early and late pregnancy, while the -hCG level in the PE group was lower than that in the non-PE group in mid-pregnancy.
Analysis of factors affecting PE risk
Binary logistic regression was conducted on the effects of biomarkers (PAPP-A and -hCG) combined with the relevant clinical risk factor (BMI) on the risk for PE (the results are shown in Table 2). In early pregnancy, PAPP-A and -hCG impacted PE risk, with regression coefficients of 0.014 and 0.002, respectively ( 0.006 and 0.028, respectively). In mid-pregnancy, -hCG and BMI impacted PE risk, with regression coefficients of 0.005 and 0.325, respectively ( 0.044 and 0.028, respectively). Finally, in late pregnancy, PAPP-A and BMI impacted PE risk, with regression coefficients of 0.002 and 0.341, respectively ( 0.032 and 0.021, respectively).
Adjusted binary logistic regression models for biomarkers and clinically relevant risk variables between PE and non-PE
B
Wald
Exp (B)
1st
PAPP-A
0.014
0.005
7.579
0.006
1.014
-hCG
0.002
0.001
4.809
0.028
1.002
2nd
-hCG
0.005
0.003
4.064
0.044
1.005
BMI
0.325
0.148
4.836
0.028
1.385
3rd
PAPP-A
0.002
0.001
4.619
0.032
1.002
BMI
0.341
0.148
5.304
0.021
1.406
Abbreviation: , standard deviation; B, standardized regression coefficient; PAPP-A, pregnancy-associated plasma protein A; -hCG, -human chorionic gonadotropin; BMI, body mass index; PE, pre-eclampsia.
ROC analysis
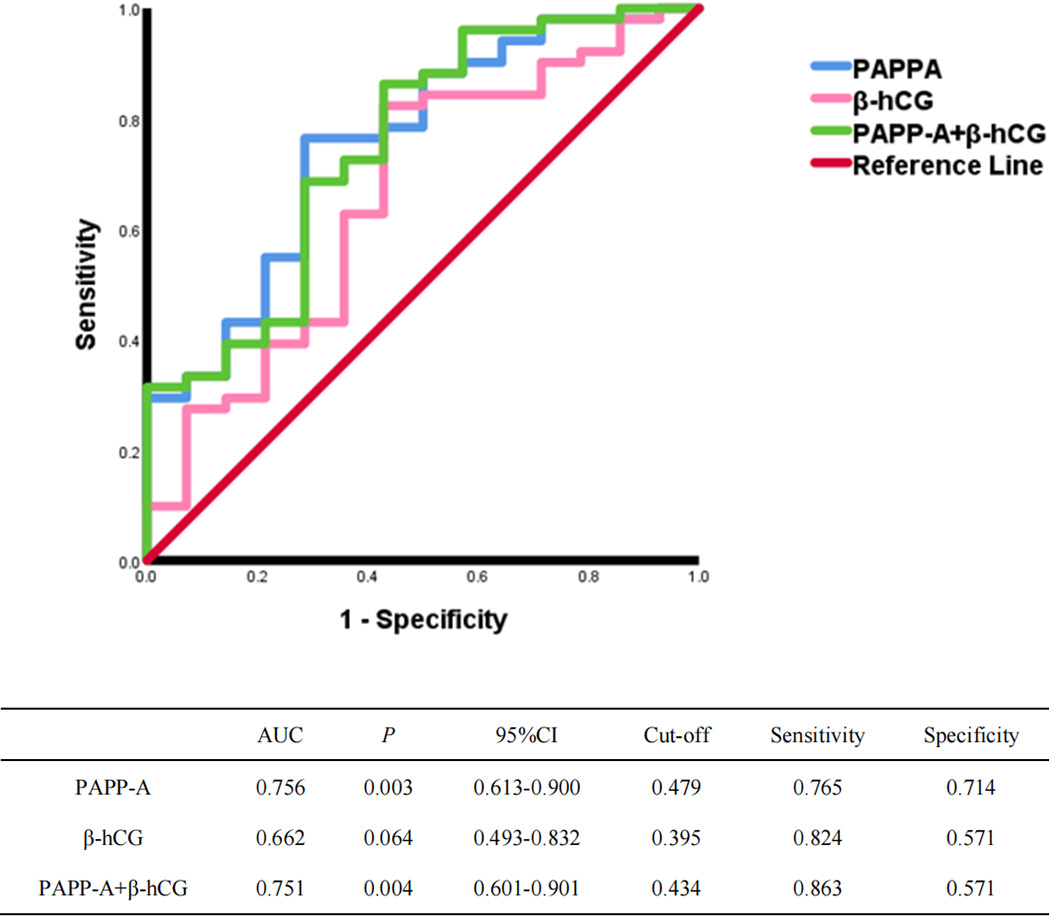
The ROC curve analysis revealed that when PE was diagnosed in early pregnancy, the area under the ROC curve (AUC) of PAPP-A was 0.756 (95% confidence interval [CI] [0.613, 0.900], 0.003), and the AUC of -hCG was 0.662 (95% CI [0.493, 0.832], 0.064). The highest sensitivity and specificity were obtained using Youden’s index, and the corresponding cutoff values of PAPP-A and -hCG were 0.479 and 0.395, respectively. Under this condition, the corresponding sensitivity and specificity of PAPP-A were 76.5% and 71.4%, respectively, and the sensitivity and specificity of -hCG were 82.4% and 57.1%, respectively. The AUC of the combined diagnosis of PE with the two markers was 0.751 (95% CI [0.601, 0.901], 0.004), and the sensitivity and specificity were 86.3% and 57.1%, respectively (see Fig. 2).
ROC curve for the diagnosis of PE in the first trimester. Note: PAPP-A, pregnancy-associated plasma protein A; -hCG, -human chorionic gonadotropin; PE, pre-eclampsia.
When PE was diagnosed in mid-pregnancy, the AUC value of -hCG was 0.647 (95% CI [0.465, 0.828], 0.124), and the AUC value of BMI was 0.653 (95% CI [0.454, 0.851], 0.101). Using Youden’s index, the corresponding cutoff values of -hCG and BMI were 0.298 and 0.416, respectively; under this condition, the corresponding sensitivity and specificity of -hCG were 88.1% and 41.7%, respectively, and the sensitivity and specificity of BMI were 83.3% and 58.3%, respectively. The AUC value of the combined diagnosis of PE with -hCG and BMI was 0.687 (95% CI [0.495, 0.878], 0.005), and the sensitivity and specificity were 85.7% and 58.3%, respectively (see Supplementary Information Table 1A).
When PE was diagnosed in late pregnancy, the AUC value of PAPP-A was 0.617 (95% CI [0.460, 0.774], 0.022), and the AUC value of BMI was 0.621 [95% CI [0.419, 0.823], 0.103]. Using Youden’s index, the corresponding cutoff values of PAPP-A and BMI were 0.346 and 0.309, respectively; under this condition, the corresponding sensitivity and specificity of PAPP-A were 42.9% and 91.7%, respectively, and the sensitivity and specificity of BMI were 97.6% and 33.3%, respectively. The AUC value of the combined diagnosis of PE with PAPP-A and BMI was 0.748 (95% CI [0.579, 0.917], 0.009), and the predictive sensitivity and specificity were 81% and 75%, respectively (see Supplementary Information Table 1B).
Discussion
This retrospective study determined and evaluated the serum levels of PAPP-A, -hCG, AFP, and uE3 of 65 pregnant women with and without PE. A multi-index model was established using PAPP-A/-hCG biomarkers and clinical relative risk factors for PE (gestational age, gestational age, BMI, etc.) to predict PE risk. The research results revealed that during pregnancy, PAPP-A, AFP, and uE3 showed an upward trend, while -hCG exhibited an initial upward trend before decreasing. The comparison between the PE group and the non-PE group revealed significant differences in the levels of PAPP-A, AFP, and uE3 during early pregnancy and no significant difference in the levels of PAPP-A, AFP, and uE3 during mid- and late pregnancy. There was no statistical difference in the level of -hCG between the PE group and the non-PE group throughout the entirety of each stage of pregnancy.
A combination of biomarkers (PAPP-A -HCG, AFP, and uE3) and related clinical risk factors (gestational age, gestational age, BMI, etc.) was used to establish a pregnancy PE risk prediction model; the result revealed that in the early pregnancy stage, the risk-prediction model for PE established using PAPP-A alone or in combination with -hCG had high sensitivity and high specificity.
This study revealed that the level of PAPP-A had an upward trend during pregnancy, and the level of PAPP-A in pregnant women with PE was lower than that in normal pregnant women. Similar to the results of the present study, by screening PAPP-A in pregnant women at 11–13 6 weeks, Yu et al. revealed that a lower PAPP-A in early pregnancy was associated with adverse pregnancy outcomes (e.g., preterm birth and PE) [7]. The mechanism of low levels of PAPP-A in pregnant women with PE may be that PAPP-A is a metalloprotease secreted by syncytiotrophoblasts that cleaves the complex of insulin-like growth factor (IGF) and IGF binding protein to enhance the mitosis of IGF. Since IGF plays an important role in trophoblasts, decreased PAPP-A levels might be associated with the pathogenesis of PE [22]. Researchers have revealed that PAPP-A tends to increase during early pregnancy and continue to increase throughout pregnancy, which is similar to the findings of the present study [2, 23, 24, 25].
The present study revealed that in early and late pregnancy, the -hCG levels in pregnant women with PE were higher than those in women with normal pregnancies. In mid-pregnancy, the -hCG levels in pregnant women with PE were lower than those in women with normal pregnancies; moreover, there was an initial increasing trend followed by a tendency to decrease throughout the pregnancy. However, it was found that the difference in -hCG levels between women with and without PE during pregnancy was not statistically significant. Yu et al. [7] conducted a study on serum biomarkers (-hCG) during early and mid-pregnancy and revealed that there was no statistical difference in -hCG levels between pregnant women with PE and pregnant women without PE. This is similar to the results of the present study.
However, a retrospective study conducted by Chen et al. revealed that the -hCG levels in pregnant women with PE were lower than those in pregnant women without PE; the difference was statistically significant, and the results are inconsistent with our findings [26, 27]. The differences might be attributable to differences in sample sizes. The small sample size in our study limited statistical evaluation, so in the future, it will be necessary to verify the results using a larger-sized sample dataset.
This study’s logistic regression analysis revealed that PAPP-A and -hCG had significant impacts on PE risk in early pregnancy, -hCG and BMI had significant impacts on PE risk in mid-pregnancy, and PAPP-A and BMI had significant impacts on PE risk in late pregnancy. The ROC curve revealed that PAPP-A alone or in combination with -hCG had high sensitivity and specificity for diagnosis in early pregnancy. However, diagnosis using BMI alone or in combination with biomarkers (PAPP-A and -hCG) in mid- and late pregnancy had no high sensitivity or specificity for PE risk.
In a previous study [15], the determination of PAPP-A and -hCG levels helped to clarify the clinical characteristics and medical histories of pregnant women to help improve the ability to predict PE risk. Anna et al. found that through the study of early-onset PE (EOPE), the combination of PAPP-A and -hCG detected EOPE in 48% of pregnant women at 9–13 6 weeks, with a false positive rate of 10%; accordingly, this model could serve as a suitable prediction model [28]. Ozdamar et al. found that through the combined study of PAPP-A and -hCG and NT, PAPP-A was significant in predicting pregnancy hypertensive disorders (especially PE) in early pregnancy, although -hCG had no significance in predicting PE risk in early pregnancy, which is consistent with our results [29]. However, Chen et al. found that PAPP-A and -hCG alone had no diagnostic value for PE in early pregnancy [26], which is inconsistent with the results of our study. In addition, other researchers found that AFP levels in pregnant women with PE increased in early pregnancy, and AFP combined with PAPP-A, -hCG, etc., could predict the development process after EOPE. However, our study did not find that AFP or uE3 affected PE risk. These differences may be attributed to ethnic and regional differences in the study’s subject population [27].
The advantages of this study was that pregnant women were recruited so the whole pregnancy process could be studied. However, this study had the following limitations: (1) Due to its small sample size, the difference in sample size between the PE and non-PE groups and the small total sample size led to difficulties in statistical evaluation. In the future, the sample size should be increased to obtain more reliable statistical results. (2) The number of parameters was limited, and more relevant indicators should be included to comprehensively evaluate the ability to predict PE risk to enhance the possibilities for PE risk prediction. (3) The conversion of the results was not performed.
Conclusion
In conclusion, this study established a predictive model for diagnosing PE using PAPP-A and -hCG alone or in combination with related clinical risk factors. Our study results revealed that the combination of PAPP-A and -hCG had the greatest predictive effect on screening pregnant women for PE in early pregnancy. Therefore, the combination of PAPP-A, -hCG, and clinical risk factors as screening indicators of PE during prenatal examinations might form a new approach for the early identification of PE in pregnant women with normal blood pressure; in turn, this approach could be used to guide medical staff to provide low-dose aspirin as an intervention method as early as possible to reduce both birth defect rates and perinatal maternal mortality.
The intervention of predictive, preventive, and personalized medicine (PPPM) is conducive to the promotion of predictive diagnosis and helps with conducting targeted preventive measures to provide personalized treatment for patients. The selection of biomarkers for PPPM requires careful evaluation and selection via important parameters, such as sensitivity and specificity. Therefore, in the future, additional markers should be included in combination to screen for PE to improve the prediction of the disease.
Footnotes
Conflict of interest
None to report.
Supplementary data
ROC curve for the diagnosis of PE in the second trimester
AUC
95% CI
Cut-off
Sensitivity
Specificity
-hCG
0.647
0.124
0.465–0.828
0.298
0.881
0.417
BMI
0.653
0.109
0.454–0.851
0.416
0.833
0.583
-hCGBMI
0.687
0.050
0.495–0.878
0.44
0.857
0.583
Abbreviation: -hCG, -human chorionic gonadotropin; BMI, body mass index; PE, pre-eclampsia.
ROC curve for the diagnosis of PE in the third trimester
AUC
95% CI
Cut-off
Sensitivity
Specificity
PAPP-A
0.617
0.220
0.460–0.774
0.346
0.429
0.917
BMI
0.621
0.204
0.419–0.823
0.309
0.976
0.333
PAPP-ABMI
0.748
0.009
0.579–0.917
0.56
0.81
0.75
Abbreviation: PAPP-A, pregnancy-associated plasma protein A; BMI, body mass index; PE, pre-eclampsia.
References
1.
Hypertension in pregnancy. Report of the american college of obstetricians and gynecologists’ task force on hypertension in pregnancy. Obstet Gynecol.2013; 122(5): 1122-1131.
2.
KhanamZMittalPSuriJ. Does the addition of serum PAPP-A and β-hCG improve the predictive value of uterine artery pulsatility index for preeclampsia at 11–14 weeks of gestation? A prospective observational study. J Obstet Gynaecol India.2021; 71(3): 226-234.
3.
AsiltasBSurmen-GurEUncuG. Prediction of first-trimester preeclampsia: Relevance of the oxidative stress marker MDA in a combination model with PP-13, PAPP-A and beta-HCG. Pathophysiology.2018; 25(2): 131-135.
4.
KimSYKimHJParkSY, et al. Early prediction of hypertensive disorders of pregnancy using cell-free fetal DNA, cell-free total DNA, and biochemical markers. Fetal Diagn Ther.2016; 40(4): 255-262.
5.
De MuroPCapobiancoGLepeddaAJ, et al. Plasma PP13 and urinary GAGs/PGs as early markers of pre-eclampsia. Arch Gynecol Obstet.2016; 294(5): 959-965.
6.
KumarMGuptaUBhattacharjeeJ, et al. Early prediction of hypertension during pregnancy in a low-resource setting. Int J Gynaecol Obstet.2016; 132(2): 159-64.
7.
YuNCuiHChenX, et al. First trimester maternal serum analytes and second trimester uterine artery Doppler in the prediction of preeclampsia and fetal growth restriction. Taiwan J Obstet Gynecol.2017; 56(3): 358-361.
8.
AllenREZamoraJArroyo-ManzanoD, et al. External validation of preexisting first trimester preeclampsia prediction models. Eur J Obstet Gynecol Reprod Biol.2017; 217: 119-125.
9.
HuppertzB. Maternal-fetal interactions, predictive markers for preeclampsia, and programming. J Reprod Immunol.2015; 108: 26-32.
10.
ZhongYZhuFDingY. Serum screening in first trimester to predict pre-eclampsia, small for gestational age and preterm delivery: Systematic review and meta-analysis. BMC Pregnancy Childbirth.2015; 15: 191.
11.
WuPVan Den BergCAlfirevicZ, et al. Early pregnancy biomarkers in pre-eclampsia: A systematic review and meta-analysis. Int J Mol Sci.2015; 16(9): 23035-56.
12.
LiBSahotaDSLaoTT, et al. Applicability of first-trimester combined screening for fetal trisomy 21 in a resource-limited setting in mainland China. Bjog.2016; 123(Suppl 3): 23-9.
13.
HartwigTSSørensenSJørgensenFS. The maternal age-related first trimester risks for trisomy 21, 18 and 13 based on Danish first trimester data from 2005 to 2014. Prenat Diagn.2016; 36(7): 643-9.
14.
LanRYChouCTWangvH, et al. Trisomy 21 screening based on first and second trimester in a Taiwanese population. Taiwan J Obstet Gynecol.2018; 57(4): 551-554.
15.
WrightAGuerraLPellegrinoM, et al. Maternal serum PAPP-A and free β-hCG at 12, 22 and 32 weeks’ gestation in screening for pre-eclampsia. Ultrasound Obstet Gynecol.2016; 47(6): 762-7.
16.
ZygmuntMHerrFKeller-SchoenwetterS, et al. Characterization of human chorionic gonadotropin as a novel angiogenic factor. J Clin Endocrinol Metab.2002; 87(11): 5290-6.
17.
ChenYNingWChuX, et al. Predicting hypertensive disease in the first trimester of pregnancy: Risk models and analysis of serum d-dimer levels combined with plasma pregnancy-associated protein a, free β-subunit of human chorionic gonadotropin, and fetal nuchal translucency. Biomed Res Int.2022; 2022: 8264958.
18.
BernardesTPZwertbroekEFBroekhuijsenK, et al. Delivery or expectant management for prevention of adverse maternal and neonatal outcomes in hypertensive disorders of pregnancy: An individual participant data meta-analysis. Ultrasound Obstet Gynecol.2019; 53(4): 443-453.
19.
HelmoFRLopesAMMCarneiroA, et al. Angiogenic and antiangiogenic factors in preeclampsia. Pathol Res Pract.2018; 214(1): 7-14.
20.
QuanLMXuQLZhangGQ, et al. An analysis of the risk factors of preeclampsia and prediction based on combined biochemical indexes. Kaohsiung J Med Sci.2018; 34(2): 109-112.
21.
HuangTBedfordHMRashidS, et al. Modified multiple marker aneuploidy screening as a primary screening test for preeclampsia. BMC Pregnancy Childbirth.2022; 22(1): 190.
22.
SharmaKSinghRKumarM, et al. First-trimester inflammatory markers for risk evaluation of pregnancy hypertension. J Obstet Gynaecol India.2018; 68(1): 27-32.
23.
OngCYLiaoAWSpencerK, et al. First trimester maternal serum free beta human chorionic gonadotrophin and pregnancy associated plasma protein A as predictors of pregnancy complications. Bjog.2000; 107(10): 1265-70.
24.
SmithGCStenhouseEJCrossleyJA, et al. Early pregnancy levels of pregnancy-associated plasma protein a and the risk of intrauterine growth restriction, premature birth, preeclampsia, and stillbirth. J Clin Endocrinol Metab.2002; 87(4): 1762-7.
25.
FialovaLMalbohanIM. Pregnancy-associated plasma protein A (PAPP-A): Theoretical and clinical aspects. Bratisl Lek Listy.2002; 103(6): 194-205.
26.
ChenYXieZWangX, et al. A risk model of prenatal screening markers in first trimester for predicting hypertensive disorders of pregnancy. Epma J.2020; 11(3): 343-353.
27.
GuoYFXuKXHongJWYinSNiuXFengQJ, et al. Analysis of phytochemical constituents of zuogui wan in rat serum and its effects on early embryonic development of mice. World J Tradit Chin Med.2020; 6: 324-30.
28.
YliniemiAMakikallioKKorpimakiT, et al. Combination of PAPPA, fhCGβ, AFP, PlGF, sTNFR1, and maternal characteristics in prediction of early-onset preeclampsia. Clin Med Insights Reprod Health.2015; 9: 13-20.
29.
OzdamarOGunIKeskinU, et al. The role of maternal serumbeta-HCG and PAPP-A levels at gestational weeks 10 to 14 in the prediction of pre-eclampsia. Pak J Med Sci.2014; 30(3): 568-73.