



Abstract
BACKGROUND:
Gliomas are one of the most common malignancies in the central nervous system (CNS). Members of the minichromosomal maintenance protein (MCM) family play an essential role in diagnosing and prognosis of malignant tumors. MCM10 is found in gliomas, but the prognosis and immune infiltration of gliomas has not been elucidated.
OBJECTIVE:
To explore the biological function and immune infiltration of MCM10 in gliomas and provide a reference for the diagnosis, treatment, and prognostic evaluation.
METHODS:
The MCM10 expression profile and the clinical information database of glioma patients were obtained from the China Glioma Genome Atlas (CGGA) and Cancer Genome Atlas (TCGA) glioma data. We analyzed the MCM10 expression levels in various cancers from The TCGA.RNA sequencing data were analyzed using the R packages to determine differentially expressed genes (DEGs) between high- and low MCM10 expressing GBM tissues from the TCGA-GBM database. The Wilcoxon rank sum test was used to compare MCM10 expression levels in glioma and normal brain tissue. To evaluate the value of MCM10 expressions in the prognosis of glioma patients by the Kaplan-Meier survival analysis, a univariate Cox analysis, multivariate Cox analysis, and a ROC curve analysis were used to analyze the correlation of MCM10 expression and the clinicopathological features of glioma patients using the TCGA database data. Subsequently, a functional enrichment analysis was performed to explore its potential signaling pathways and biological functions. Moreover, a single-sample gene set enrichment analysis was used to assess the extent of immune cell infiltration. Lastly, the authors constructed a nomogram to predict the overall survival rate (OS) of gliomas at 1, 3 and 5 years after diagnosis.
RESULTS:
MCM10 is highly expressed in 20 cancer types including gliomas, and MCM10 expression was an independent adverse prognostic factor in glioma patients. Similarly, high expression of MCM10 was associated with advanced age (60 years), increased tumor grade, tumor recurrence or development of a secondary tumor, IDH wild-type, and non-codeletion of 1p19q (
CONCLUSION:
MCM10 is an independent prognostic index of glioma patients, and the high expression of MCM10 suggests a poor prognosis; MCM10 expression is closely related to the immune cell infiltration of gliomas, and MCM10 may be related to drug resistance and development of gliomas.
Introduction
Gliomas are one of the most common malignancies in the central nervous system (CNS). In 2021, the World Health Organization (WHO) released the updated CNS Tumor Classification (fifth edition) guidelines [1] that divide adult-type diffuse gliomas into three categories. Astrocytoma, IDH-mutant; Oligodendroglioma, IDH mutation, and 1p/19q codeletion; glioblastoma multiforme (GBM), and IDH wild-type. According to the degree of malignancy, gliomas can be classified into low-grade gliomas (LGG; WHO grade II/III and GBM; WHO grade IV) [2, 3]. In recent years, despite the progress made in radiotherapy and chemotherapy, the prognosis of gliomas remains poor [4, 5]. Therefore, it is necessary in order to deeply investigate the molecular markers and therapeutic targets associated with glioma treatment and prognosis and develop bio interest and tumor genomics that enable the discovery of novel tumor biomarkers and therapeutic targets.
Studies have found that members of the minichromosomal maintenance protein (MCM) family play an essential role in the diagnosis and prognosis of malignant tumors [6, 7]. There are eight members of the MCM family, where 2–7 and 10 are mainly involved in DNA replication in the cell cycle [8, 9]. High expression of MCMs has been detected in various tumor tissues and cells and is associated with helicase activity that plays a crucial role in the initiation or termination of DNA replication [10].
In osteosarcoma, the over expression of MCM10 is driven by the interaction of the EWS RNA-binding protein 1 (EWS)/Fli-1 proto-oncogene, the ETS transcription factor (FLI1), and the nuclear receptor subfamily B member 1 (DAX1) [11]. In addition, previous studies have shown that MCM10 was significantly higher in medulloblastoma cell lines and tissues than in controls, and the knockdown of the MCM10 gene inhibited the proliferation of medulloblastoma cells [12]. However, MCM 2, 3, and 7 are highly expressed in gliomas and associated with poor prognoses [13].
MCM10 is found in gliomas and is associated with cell proliferation and cell cycle [14], but the prognosis and the immune microenvironment, such as immune infiltration of gliomas, have not been elucidated. This study compares the China Glioma Genome Atlas (CGGA) dataset and the Cancer Genome Atlas (TCGA) database. Using bioinformatics techniques, we evaluated the MCM10 expression, its prognostic value in glioma tissues, and the potential association of MCM10 expression with tumor immune cell infiltration. Exploring the biological function of MCM10 in gliomas will provide a reference for the diagnosis, treatment, and prognostic evaluation of gliomas.
Materials and methods
Public database
TCGA database: Enter the TCGA (
CGGA database: China Glioma Genome Atlas, releasing the functional genomics data of 2,000 Chinese glioma samples. Clinical data of 1018 gliomas (LGG and GBM) were downloaded from the CGGA (
HPA database: in this study, we performed immunohistochemical experiments with MCM10 histochemical antibody (No. HPA045899) on normal brain tissue and glioma tissue. Entering the keyword “MCM10” in the Human Protein Atlas database (
Analysis of the differentially expressed genes
Xiantao Bioinformatics Tool (
Functional enrichment analysis
Gene ontology (GO) analysis and gene set enrichment analysis (GSEA): Conduct GO analysis by Metascape, and select the genes associated with MCM10 gene expression
Prognostic analysis
First, clinical information of glioma patients with effective prognostic information included in the TCGA database was screened. Patients were divided into MCM10 high expression and low expression of MCM10 according to the median expression values of all patients with screened gliomas. The total survival time (overall survival, OS) was analyzed using the Log-Rank method. A Cox regression analysis was then used to analyze the final risk factors for OS in MCM10 patients. Clinical variables were first subjected to a univariate Cox proportional hazards regression analysis, and then the selected covariates were included in the subsequent multivariate Cox risk regression analysis. The R package ggplot2 was used to visualize the forest map.
Analysis of the tumor immune infiltration
A total of 24 immune cells were used to calculate the immune infiltration levels, and the relative enrichment scores of these immune cells in glioma were assessed by a single-sample GSEA and completed using the R package GSVA [16]. To investigate the correlation of MCM10 expression with these immune cells. Wierman’s correlation analysis and the Wilcoxon rank sum test were used to evaluate the differences between immune infiltration levels of MCM10 high and low expression 10 groups.
Construction and validation of the nomograms
To predict the overall survival probability, we built a nomogram based on the independent prognostic factors in the multivariate Cox analysis. The calibration graph was then used to evaluate the performance of the nomogram, and the consistency index (c-index) was used to quantify the identity of the nomogram. The nomogram and calibration maps were created using the R package RMS (version 5.1-4). The time-dependent time ROC software package was used to detect subject operating characteristic (ROC) curves to assess prediction accuracy.
Results
The expression level of MCM10 was increased in the gliomas
Pan-cancer analysis showed that MCM10 was highly expressed in 20 cancer types, including glioma, such as bladder and urothelial carcinoma, breast cancer, cervical squamous cell carcinoma, adenocarcinoma and cholangiocarcinoma, colon cancer, and esophageal cancer head and neck squamous cell carcinoma (Fig. 1A). MCM10 expression was significantly higher in the glioma samples than in the normal tissue (
Expression levels of MCM10 in different types of tumors and gliomas. Expression of MCM10 (A) in different types of tumors compared with normal tissues in TCGA and GTEx databases, (B) MCM10 expression increased with increased WHO grade in the CGGA database (C) in glioma and non-matched normal tissues in the TCGA and GTEx databases (D) ROC curves for classifying glioma versus normal tissues in the TCGA database. TCGA, The Cancer Genome Atlas; GTEx, Genotype Tissue Expression Project; ROC, receiver operating characteristic. 
To further identify the expression of MCM10 in the glioma protein level. We used the HPA database. The MCM10 histochemical antibody (No. HPA045899) was used to show the main staining in the nucleus. The positive expression point and positive intensity of MCM10 in glioma tissues (
Representative images of MCM10 expression in glioma tissues and normal tissues.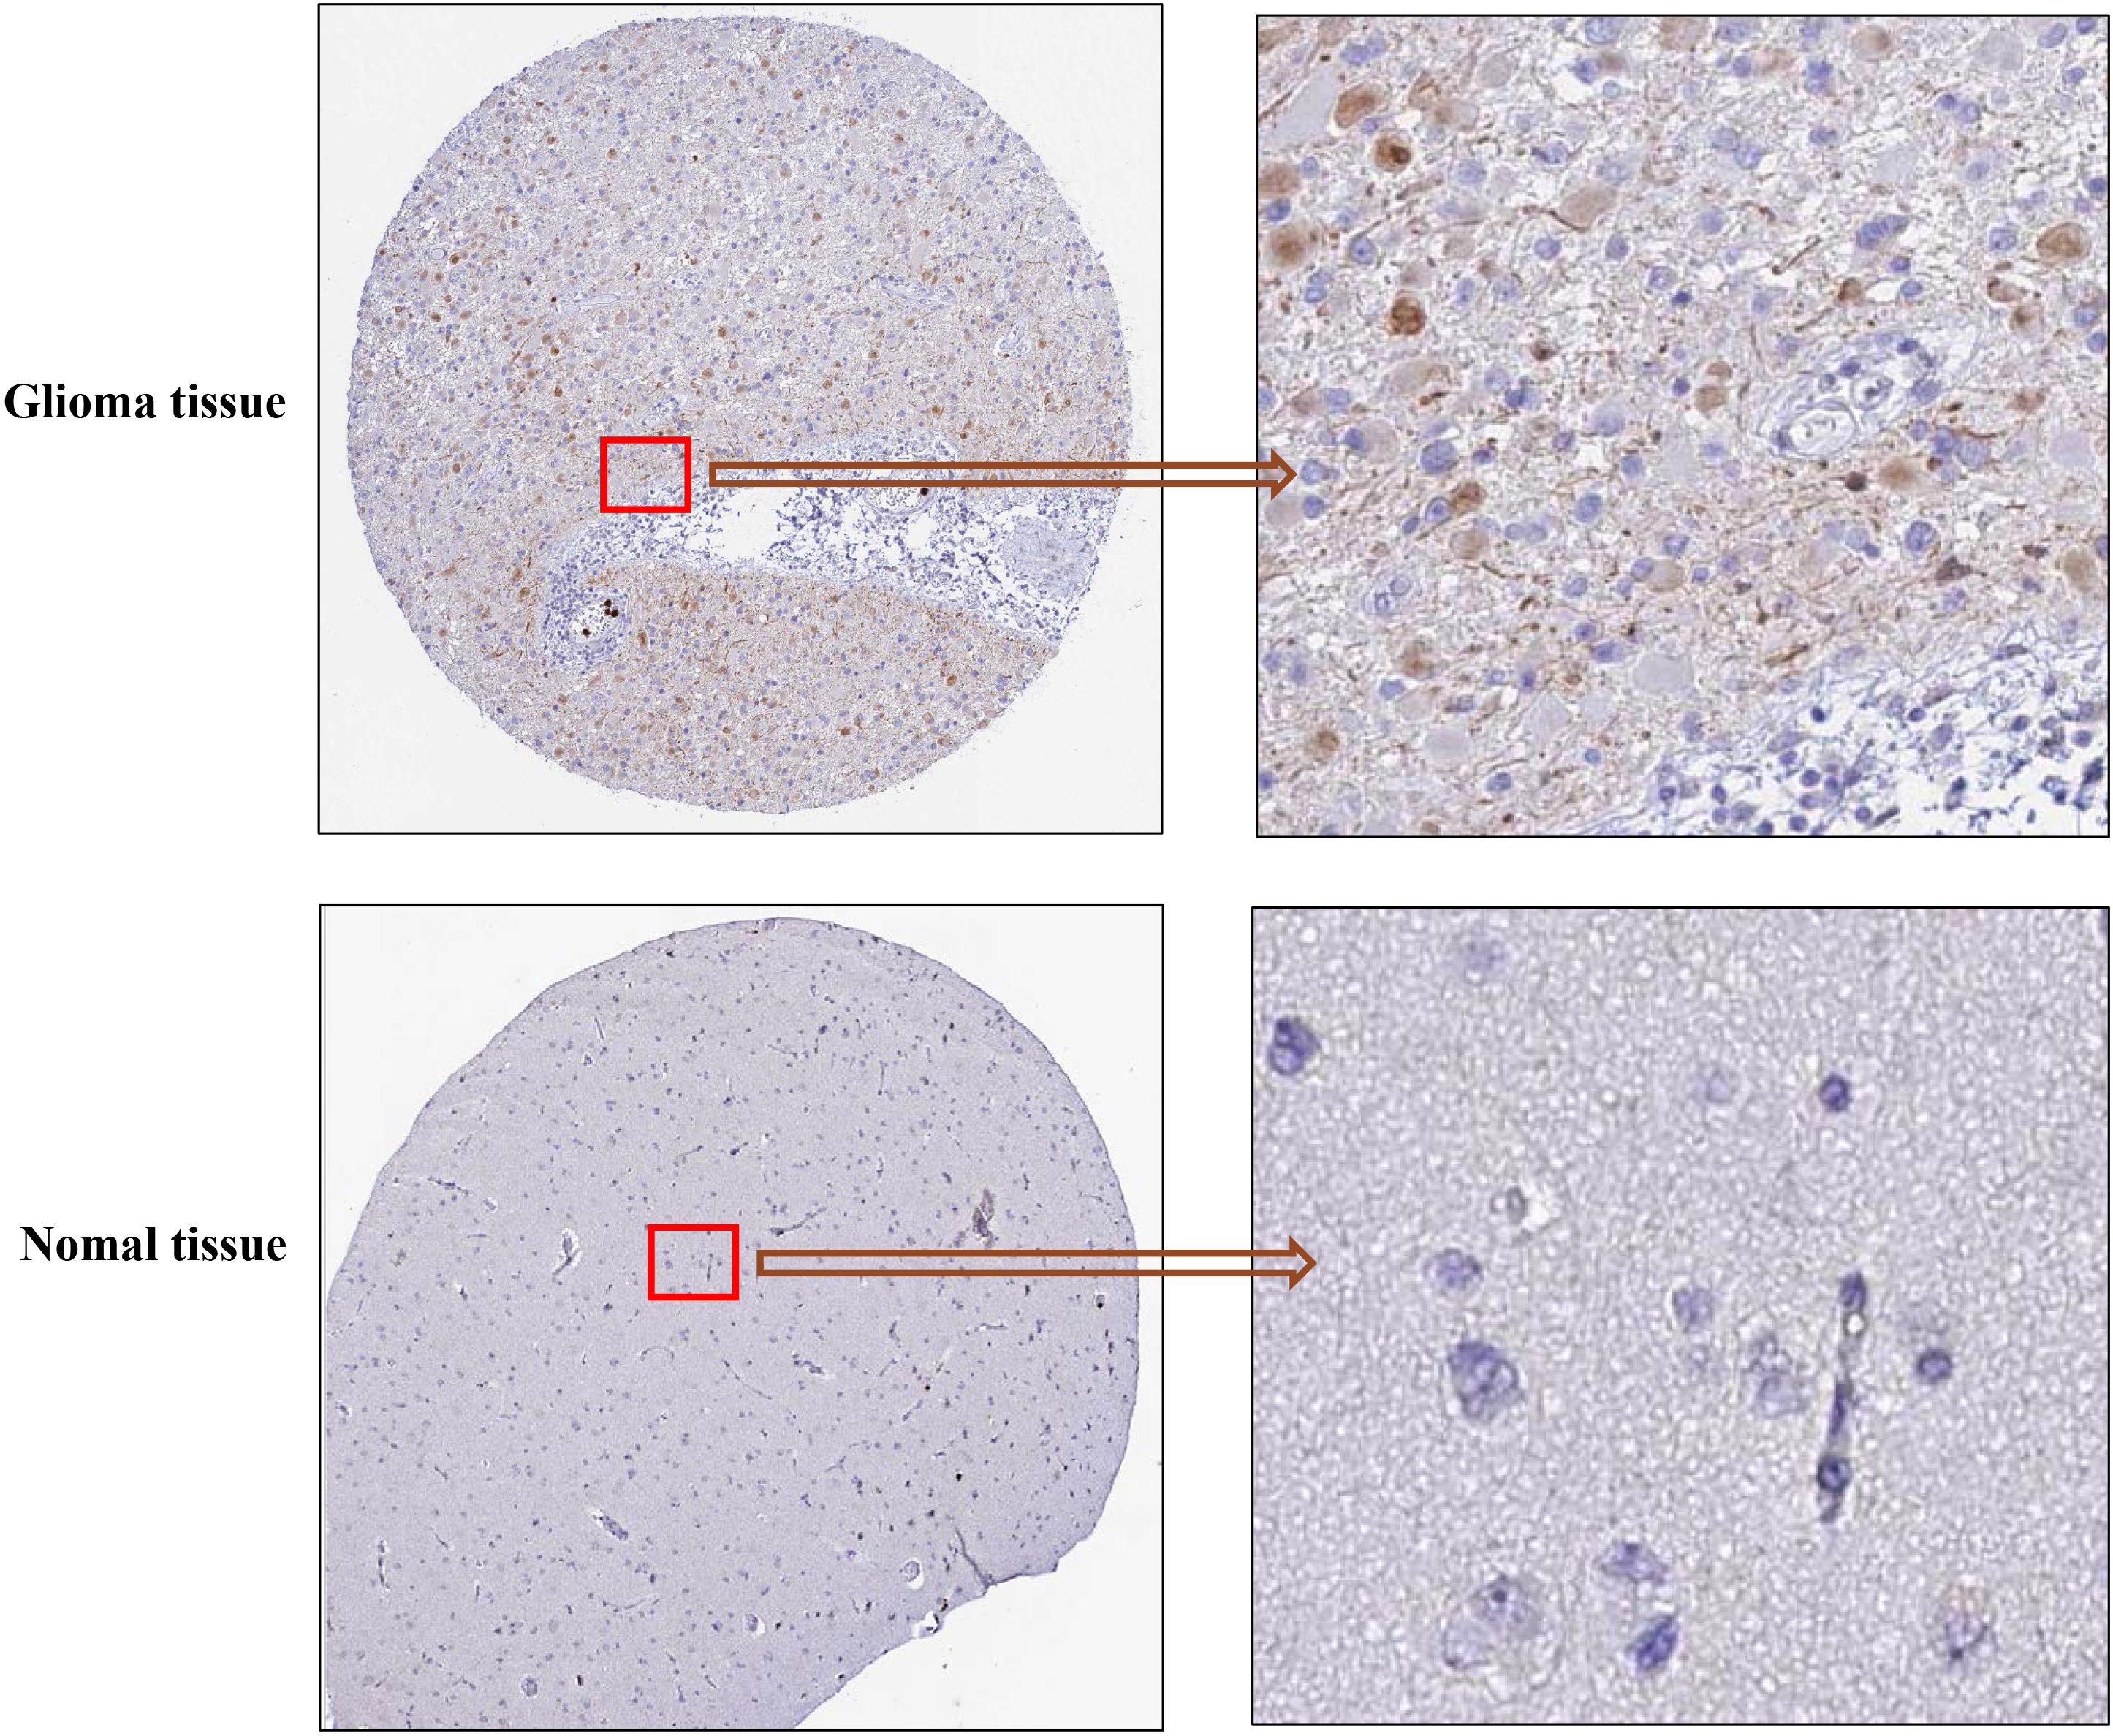
Clinicopathological characteristics of high and low MCM10 expression groups
Clinicopathological characteristics of high and low MCM10 expression groups
Associations between MCM10 expression and clinicopathological characteristics. Data are shown for (A) Histological type; (B) WHO grade; (C) Age (D) IDH status; (E) 1p/19q codeletion; (F) OS event; (G) DSS event; (H) Primary therapy outcome; (I) PFI event.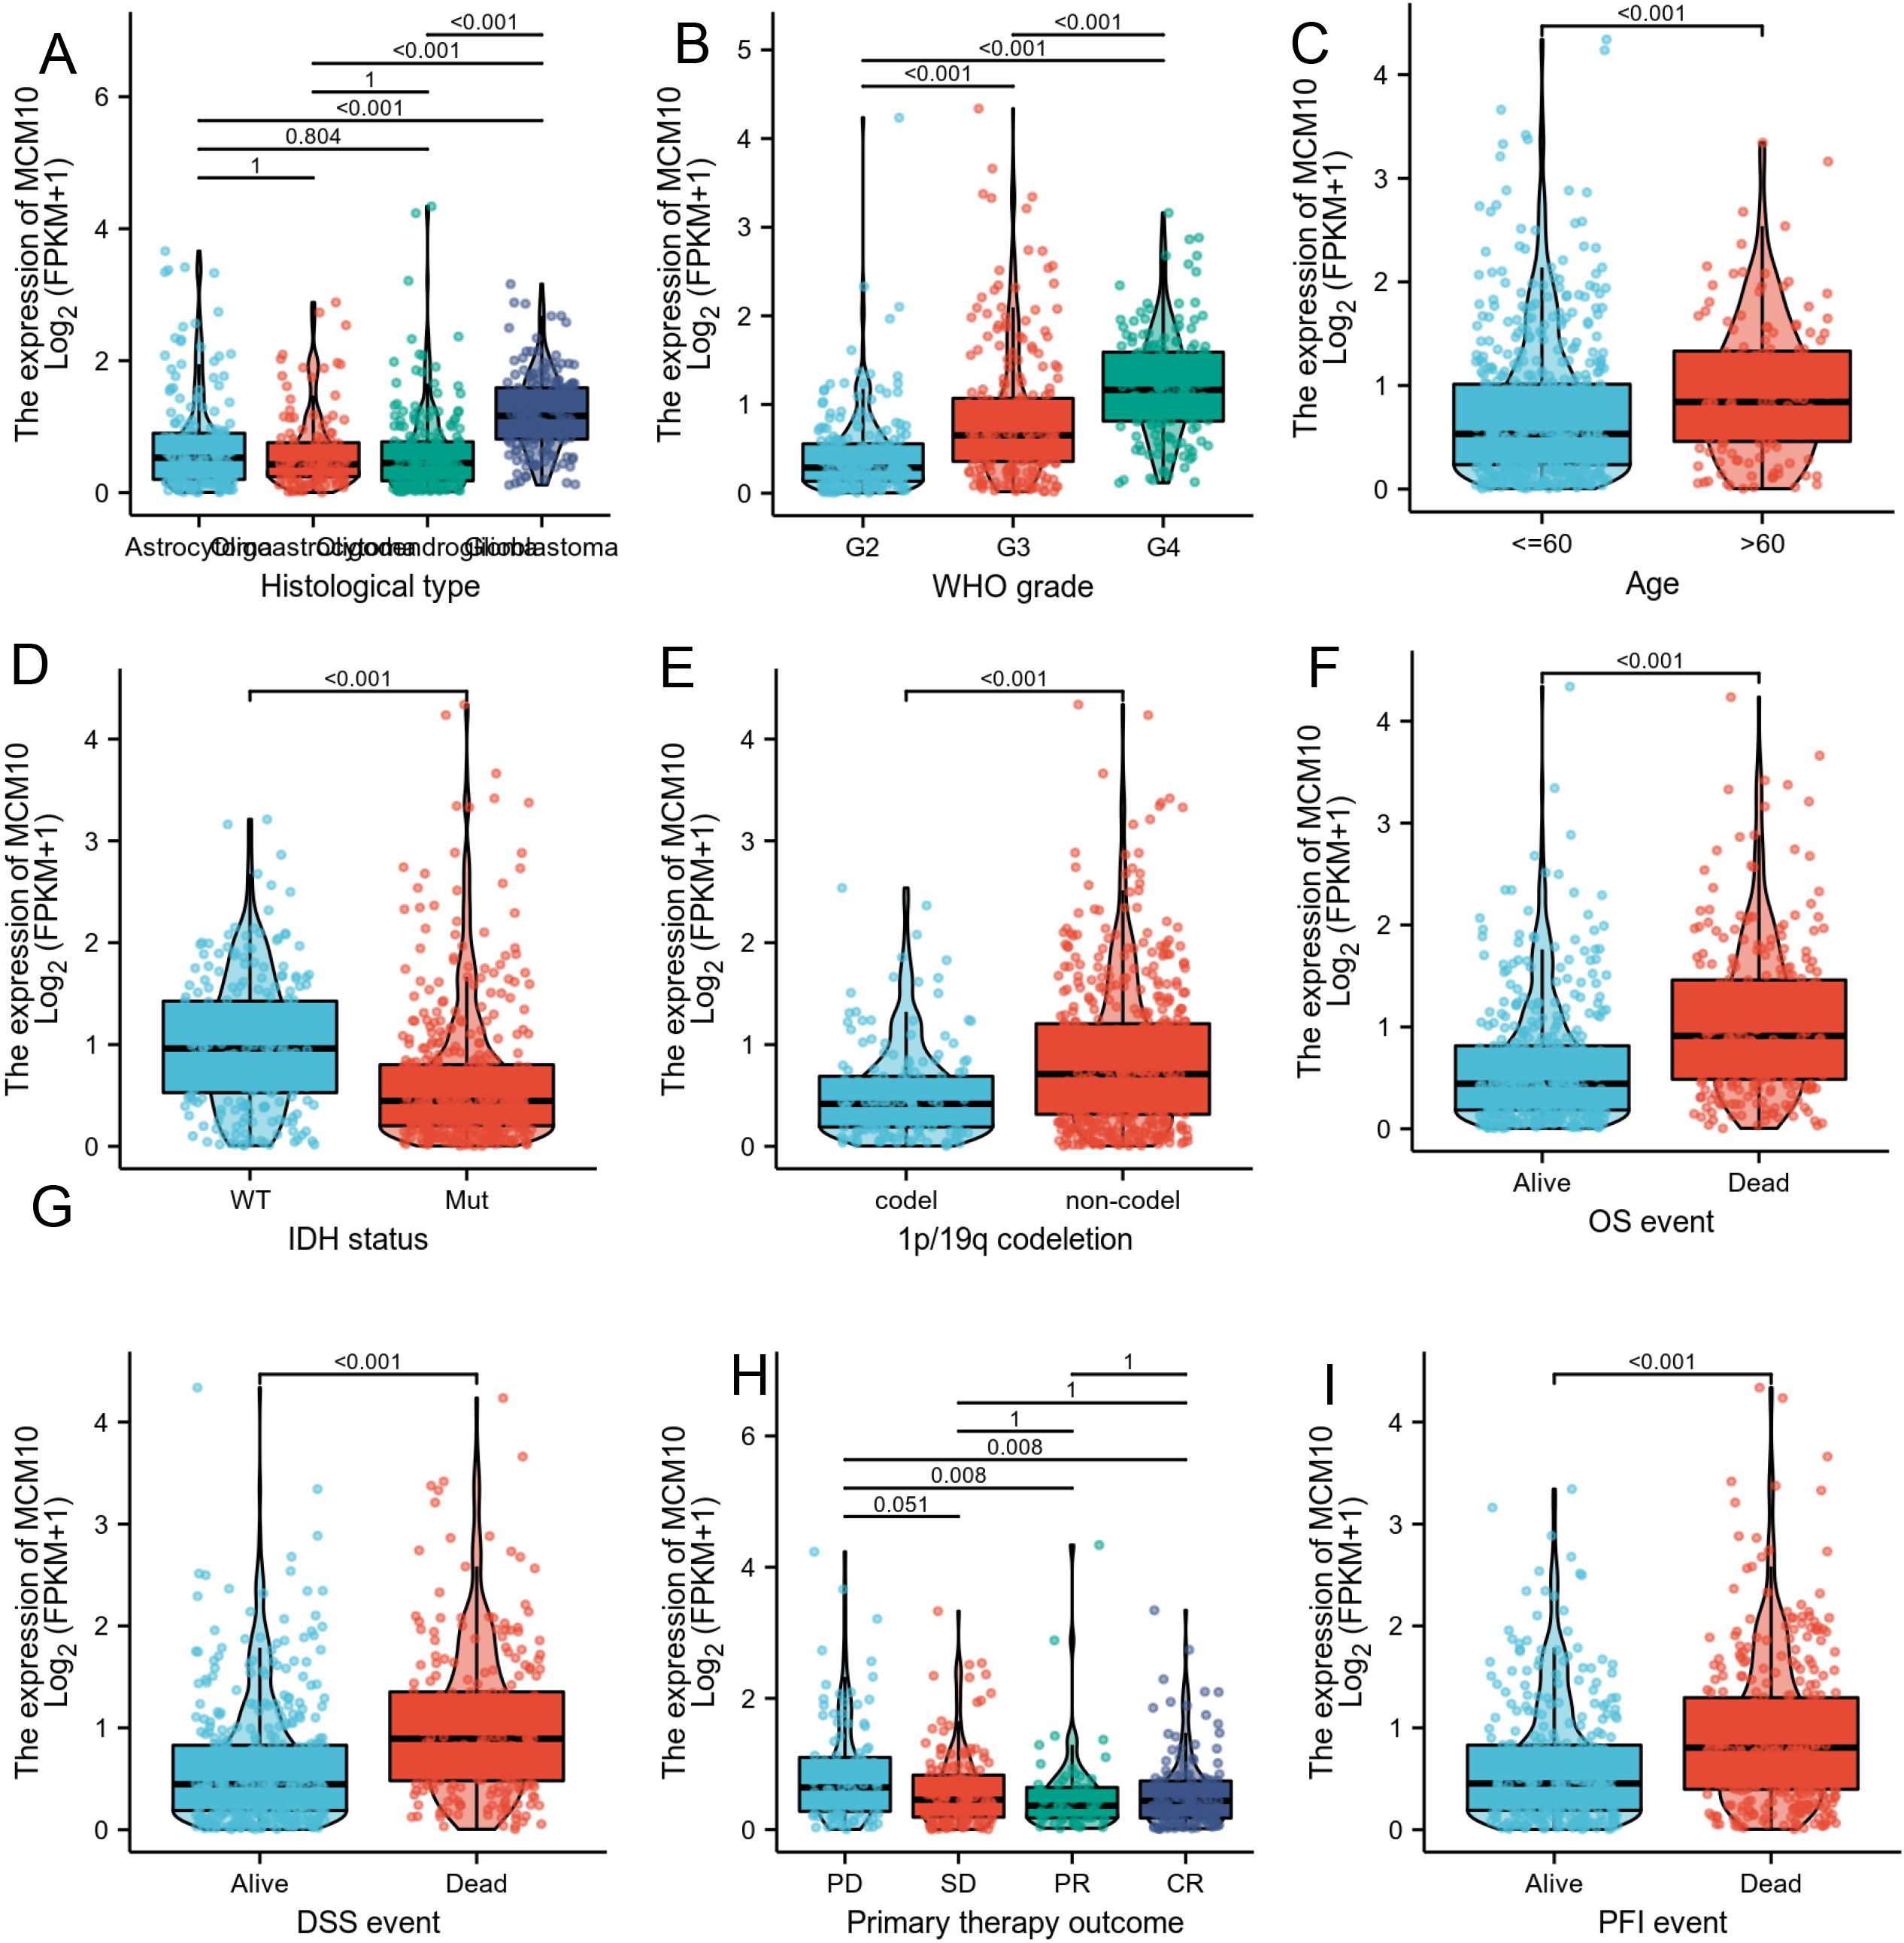
As shown in Table 1 and Fig. 3, high-expression of MCM10 was significantly associated with age of patients (
Associations of MCM10 expression with clinicopathological characteristics of patients (
There were 4620 genes differentially expressed in the MCM10 high and low expression groups, with 3317 DEGs upregulated (71.8%) and 1303 DEGs down-regulated (28.2%) (adjusted
MCM10-related differentially expressed genes (DEGs) and functional enrichment analysis of MCM10 in gliomas using GO and KEGG. (A) Volcano plot of DEGs. Blue and red dots indicate the significantly down-regulated and up-regulated DEGs, respectively. (B) Heatmap of correlation between MCM10 expression and the top 10 DEGs. (C) GO analysis of DEGs. (D) KEGG analysis of DEGs. GO, Gene Ontology; KEGG, Kyoto Encyclopedia of Genes and Genomes; DEGs, differentially expressed genes. 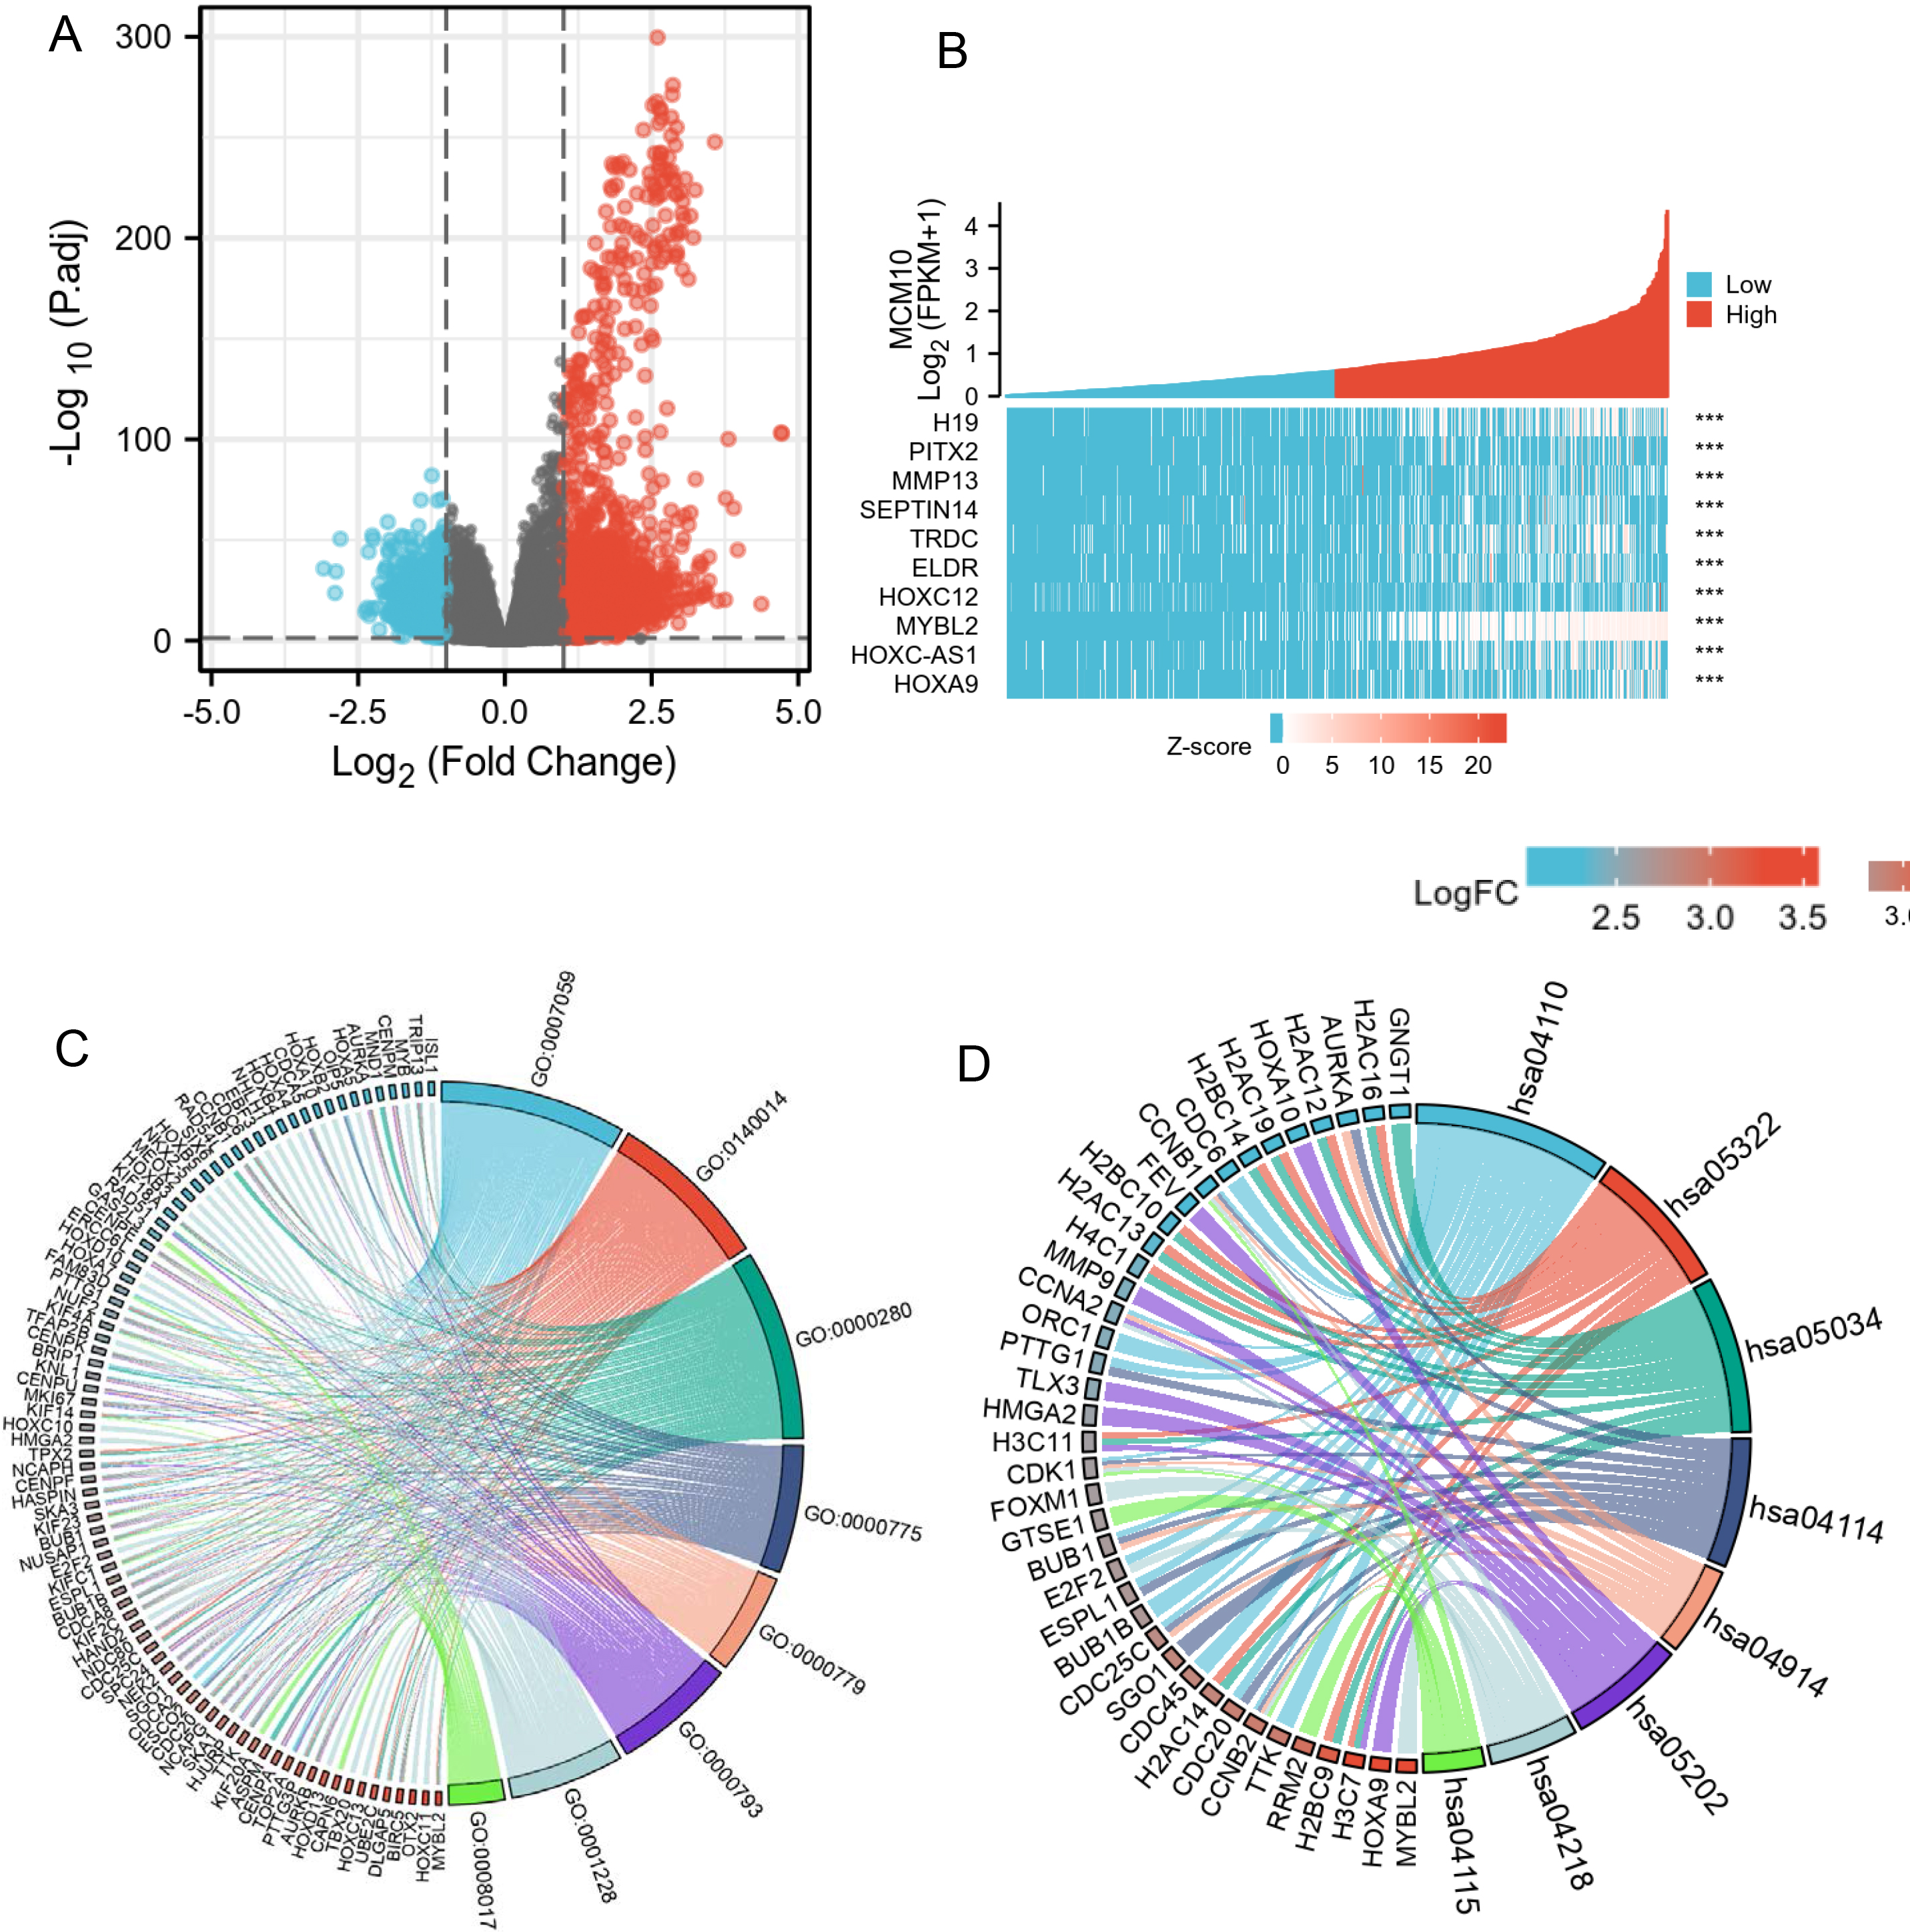
GO enrichment analysis, including biological processes, cellular compositions, and molecular functions revealed that DEGs were enriched in different GO terms such as DNA-binding transcription activator activity, mitotic nuclear division, RNA polymerase II-specific, chromosome, centromeric region (Fig. 4C). Additionally, KEGG pathway analysis showed that significantly DEGs-enriched pathways included cell cycle, systemic lupus erythematosus, alcoholism, transcriptional mis-regulation in cancer, and cellular senescence (Fig. 4D). Subsequently, GSEA enrichment analysis between the MCM10 high and low expression groups revealed a significant enrichment of more immune-related biological processes in the MCM10 high-expression group, suggesting a decreased immunophenotype (Fig. 5A–D).
Gene set enrichment analysis (GSEA) of DEGs. (A) GSEA analysis of the Hallmark gene sets deposited in MSigDB. (B) GSEA analysis of the bp of Gene Ontology gene sets downloaded from MSigDB. (C) GSEA analysis of the cc of Gene Ontology gene sets downloaded from MSigDB. (D) GSEA analysis of the mf of Gene Ontology gene sets downloaded from MSigDB. GSEA, gene set enrichment analysis; DEGs, differentially expressed genes; MSigDB, Molecular Signatures database; NES, normalized enrichment score.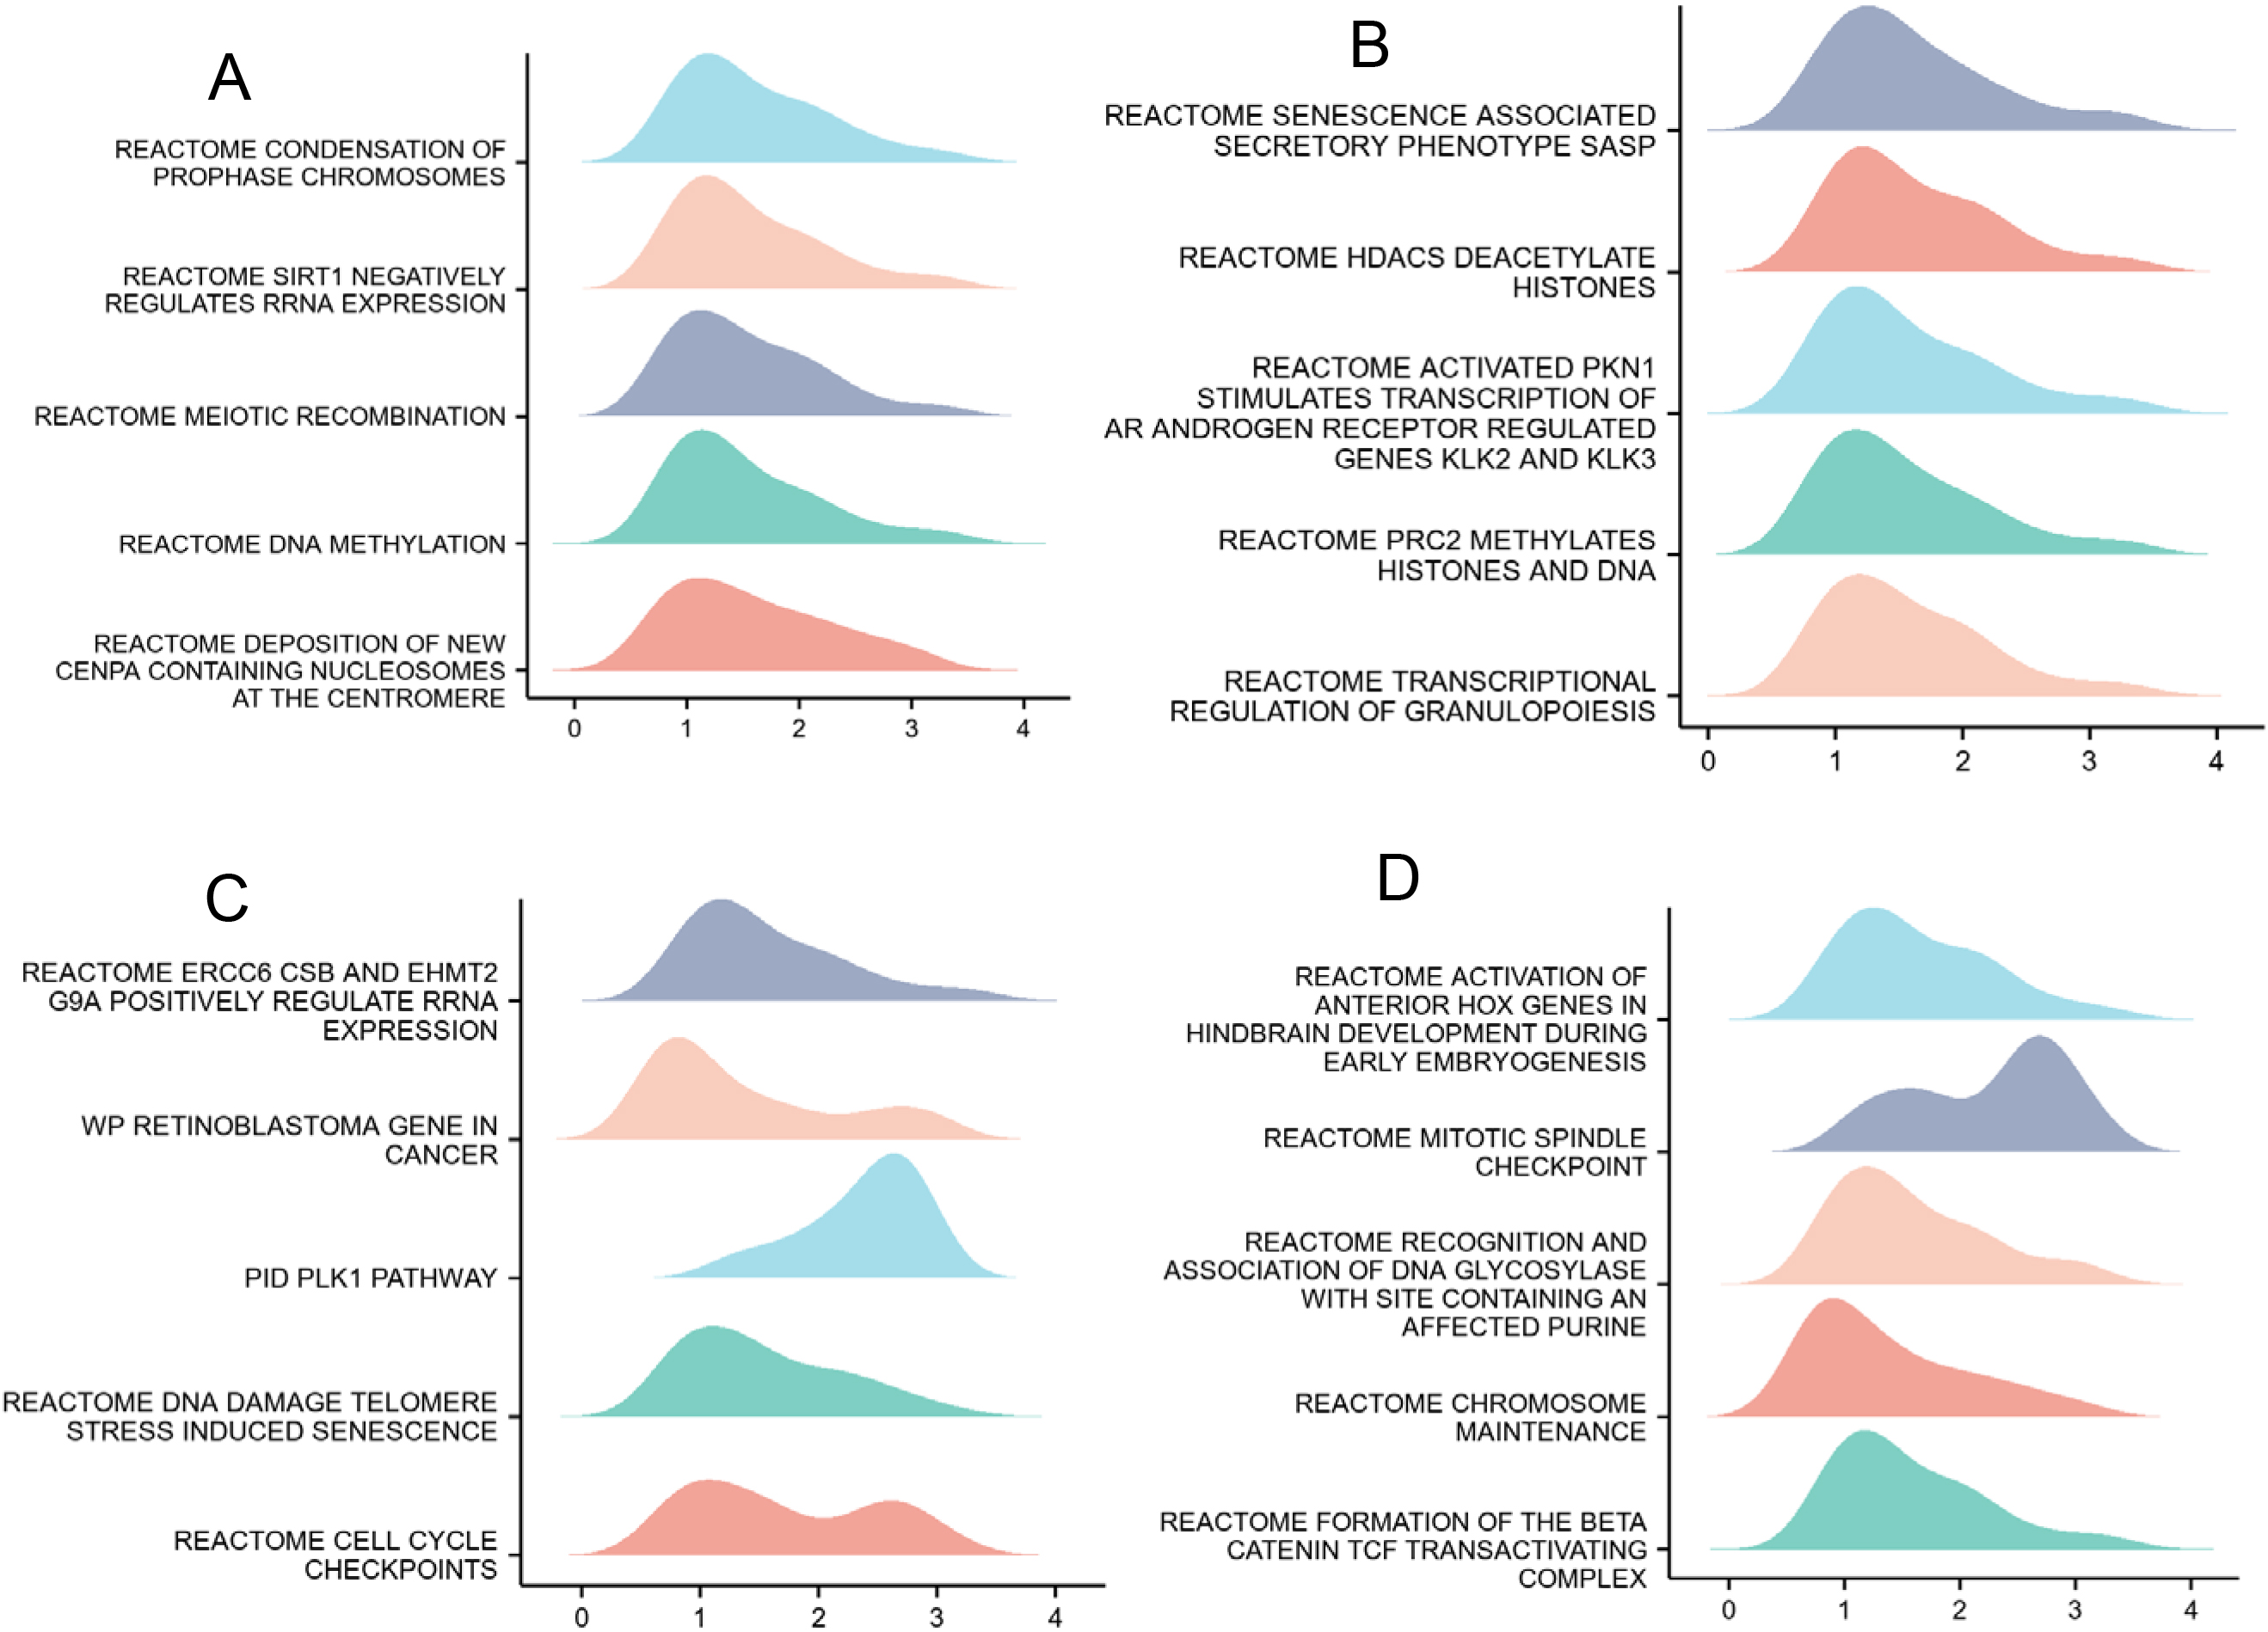
The expression of MCM10 was significantly negatively correlated with the levels of immune cell infiltration of NK CD56bright cells (
Correlation of MCM10 expression with immune infiltration level in gliomas. (A) Correlation between MCM10 expression and relative abundance of 24 types of immune cell. The size of dot corresponds to the absolute Spearman’s correlation coefficient values. (B–E) Comparison of immune infiltration levels of immune cells (including NK CD56bright cells, Tfh cells, DC, and pDCs) between the high- and low-MCM10 expression groups. (F–I) Correlations between the relative enrichment scores of immune cells (including NK CD56bright cells, Tfh cells, DC, and pDCs) and the expression of MCM10. Tfh, follicular helper T cell; pDCs, plasmacytoid dendritic cells; DC, dendritic cells.
The correlation between MCM10 expression and the prognosis of glioma patients was calculated using the Kaplan-Meier method. Patients were divided into the high and low MCM10 expression groups as determined by using the median of MCM10 expression as the cut-off value. Both OS and DSS in MCM10 showed significantly poor prognosis (OS: hazard ratio [HR]
Prognostic values of MCM10 expression in patients with glioma evaluated by the Kaplan-Meier method. Overall survival (A) and disease-specific survival (B) for glioma patients with high versus low MCM10. (C) Forest map based on multivariate Cox analysis for overall survival. HR, hazard ratio; CI, confidence interval.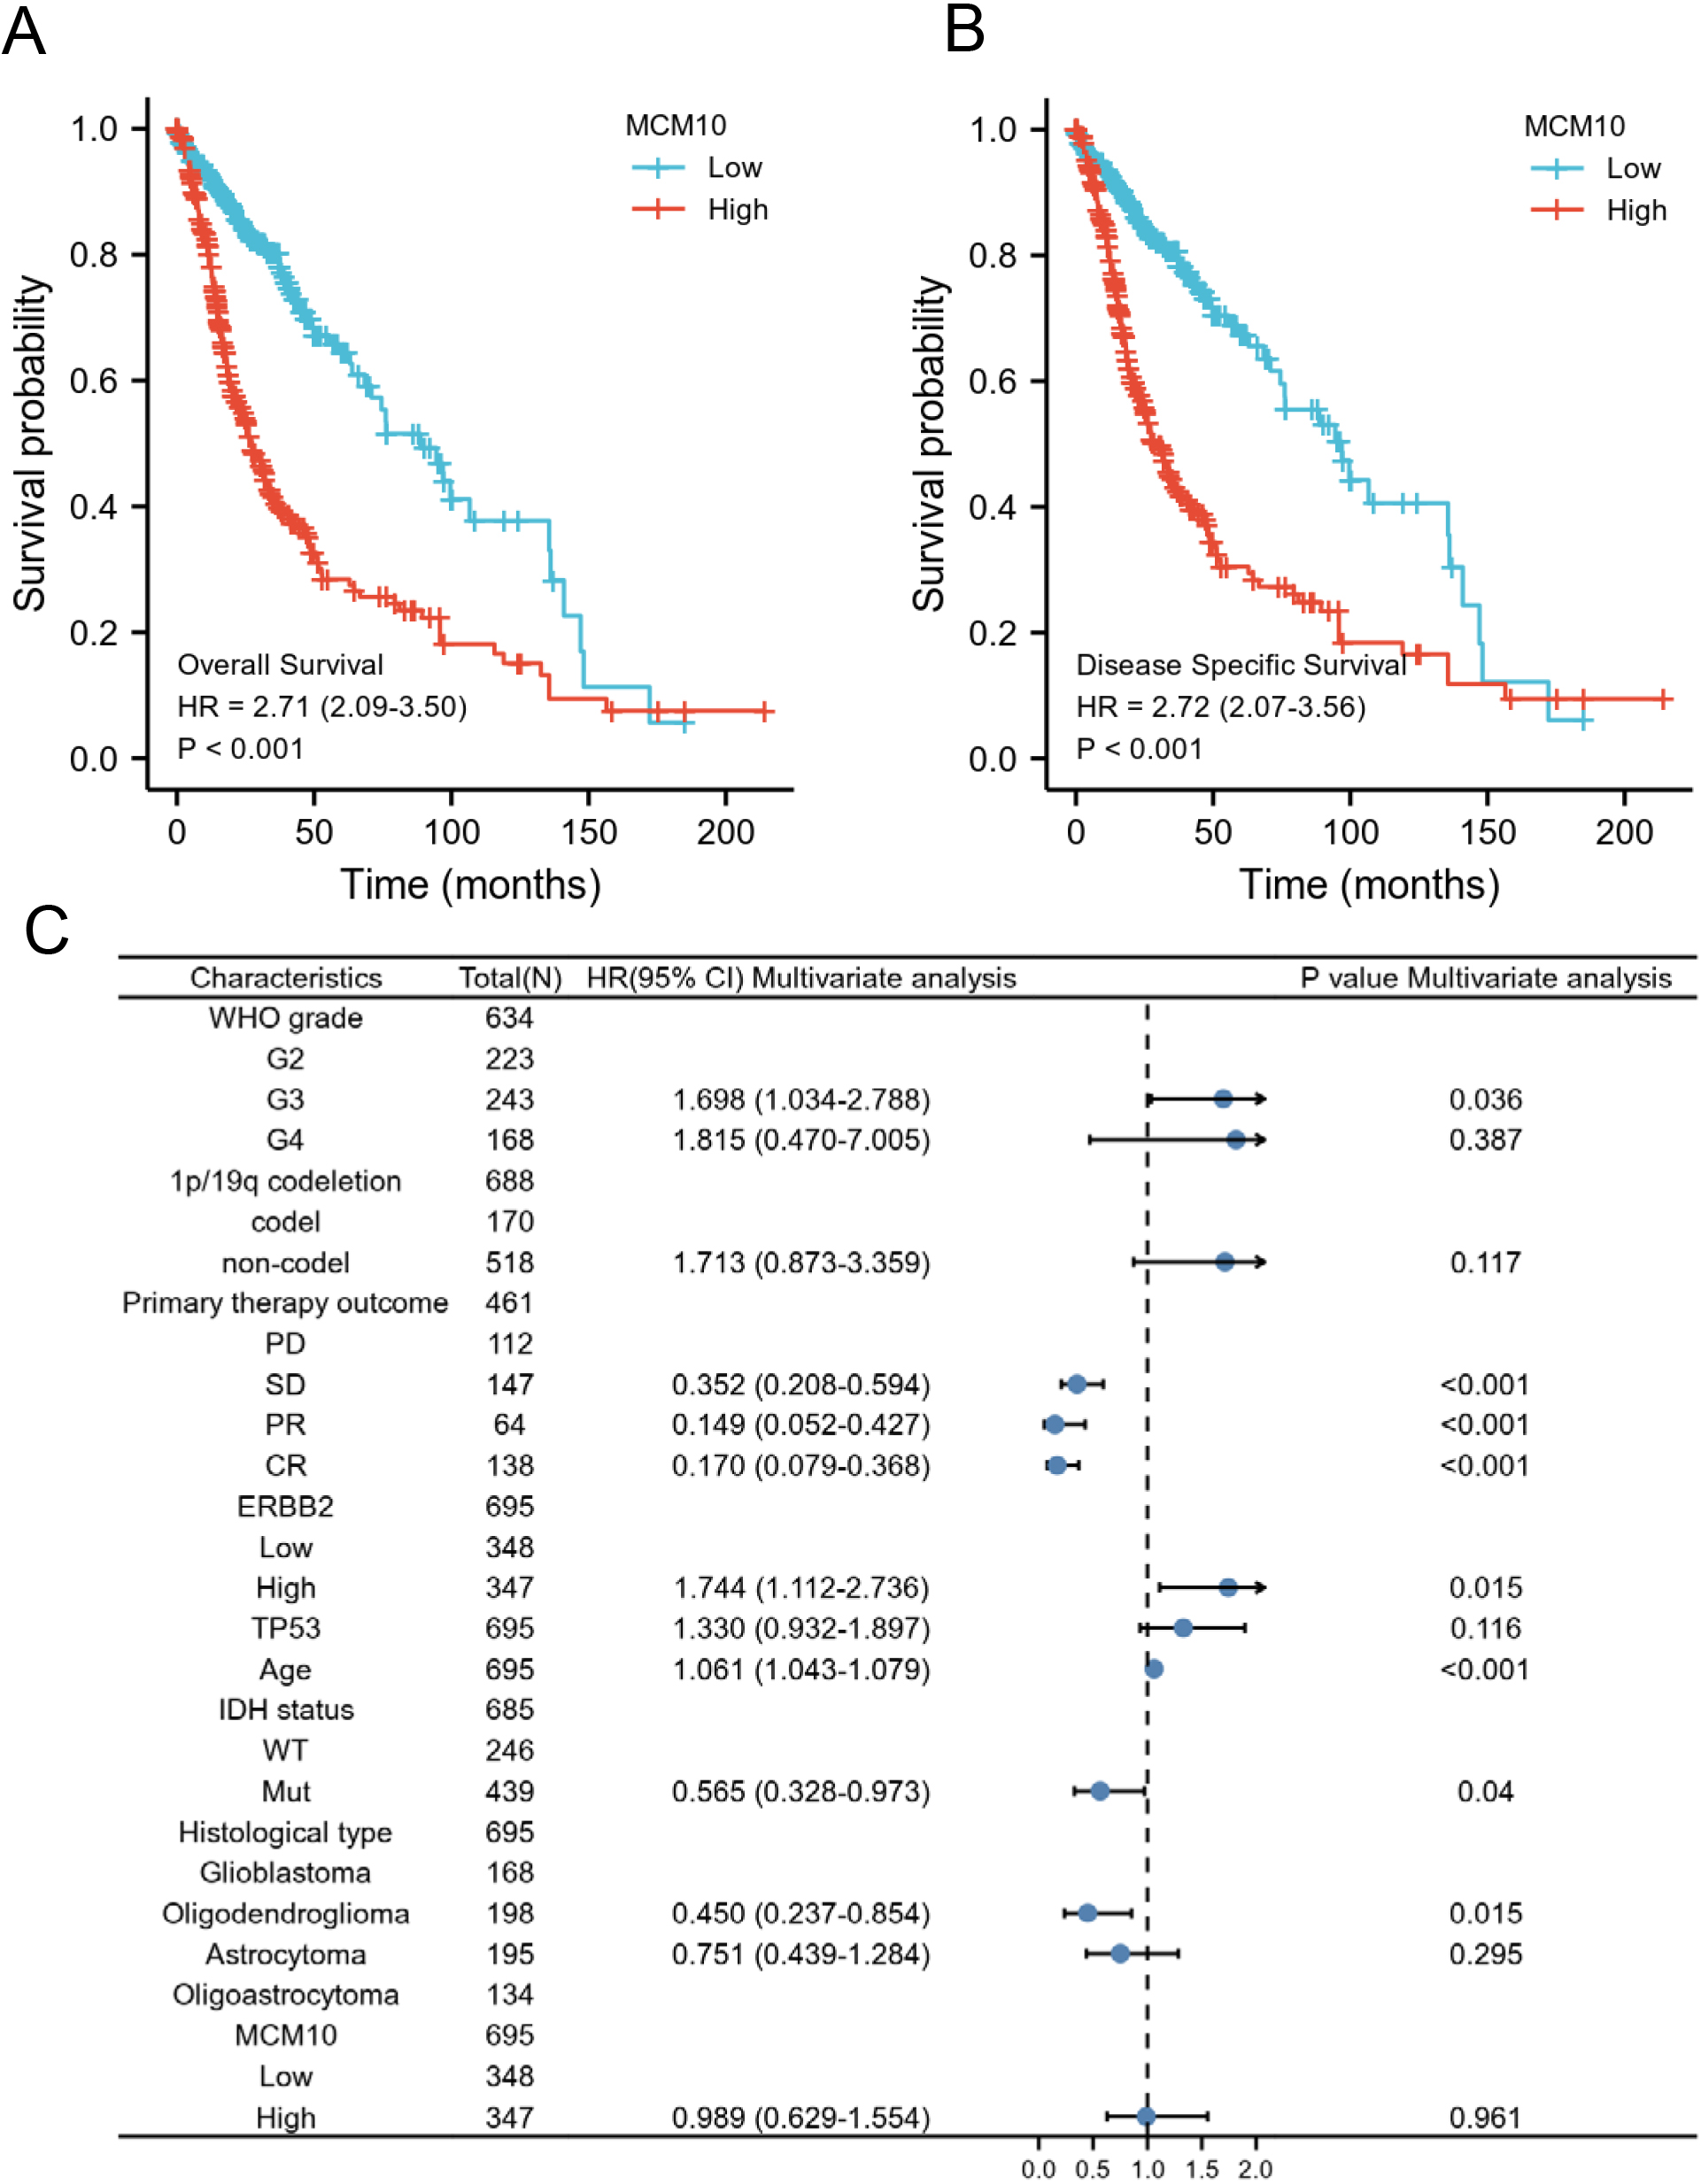
Prognostic values of MCM10 expression in patients with glioma evaluated by the Kaplan-Meier method in different subgroups. (A–F) OS survival curves of G2 and G3, 1p/19q codeletion: non-codel, IDH status: Mut. Primary therapy outcome: SD and age 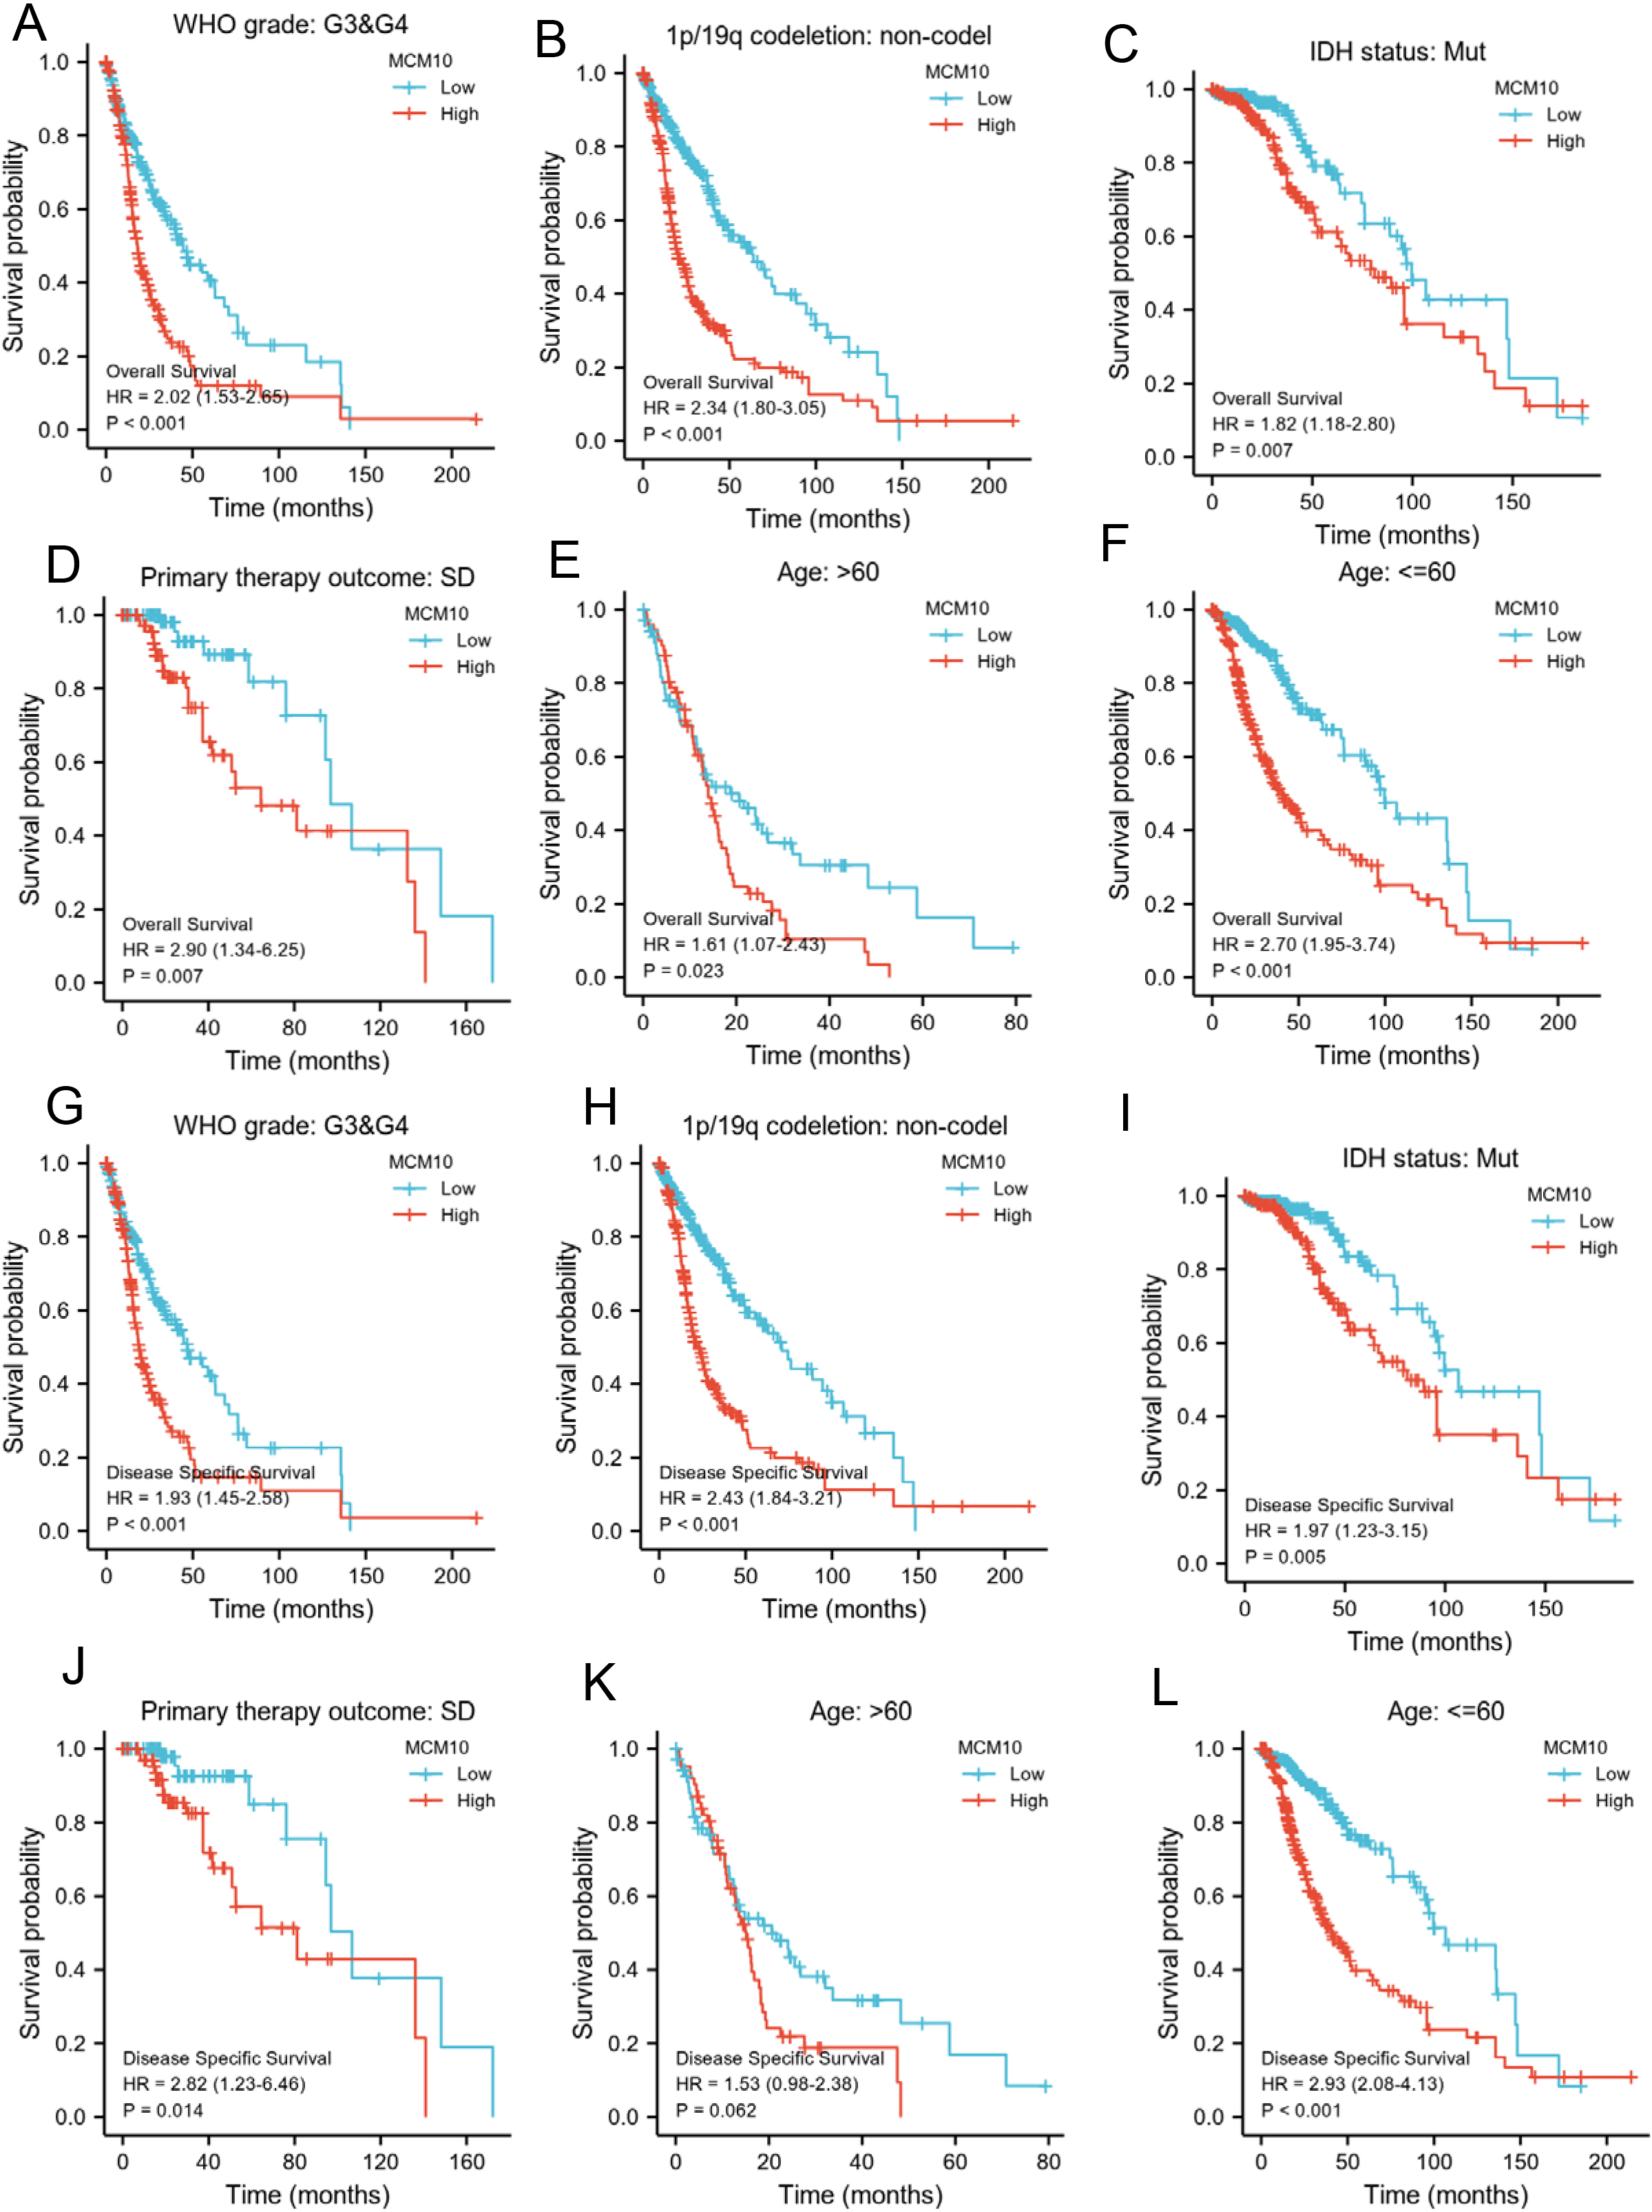
The prognosis of patients with high MCM10 expression, regardless of OS or DSS, was significantly more unfavorable in several subgroups, including G3 and G4, 1p/19q codeletion: non-codel, IDH status: Mut, Primary therapy outcome: SD, and age 60 years (
Cox proportional hazards regression analyzed the association of MCM10 expression levels and OS prognosis in Glioma patients
To predict the prognosis of glioma patients, we generated a nomogram based on the independent factors of OS. On the nomogram, the increase in total points was correlated with a worse prognosis (Fig. 9A). In addition, the calibration curves were used to evaluate the prediction effect of the nomogram (Fig. 9B–D). The bootstrap-corrected c-index of the nomogram was 0.821 (95% CI
A nomogram and calibration curves for prediction of one-, three-, and five-year overall survival rates of patients with glioma. (A) A nomogram for prediction of one-, three-, and five -overall survival rates of patients with glioma. (B–D) Calibration curves of the nomogram prediction of one-, three-, and five-year overall survival rates of patients with glioma.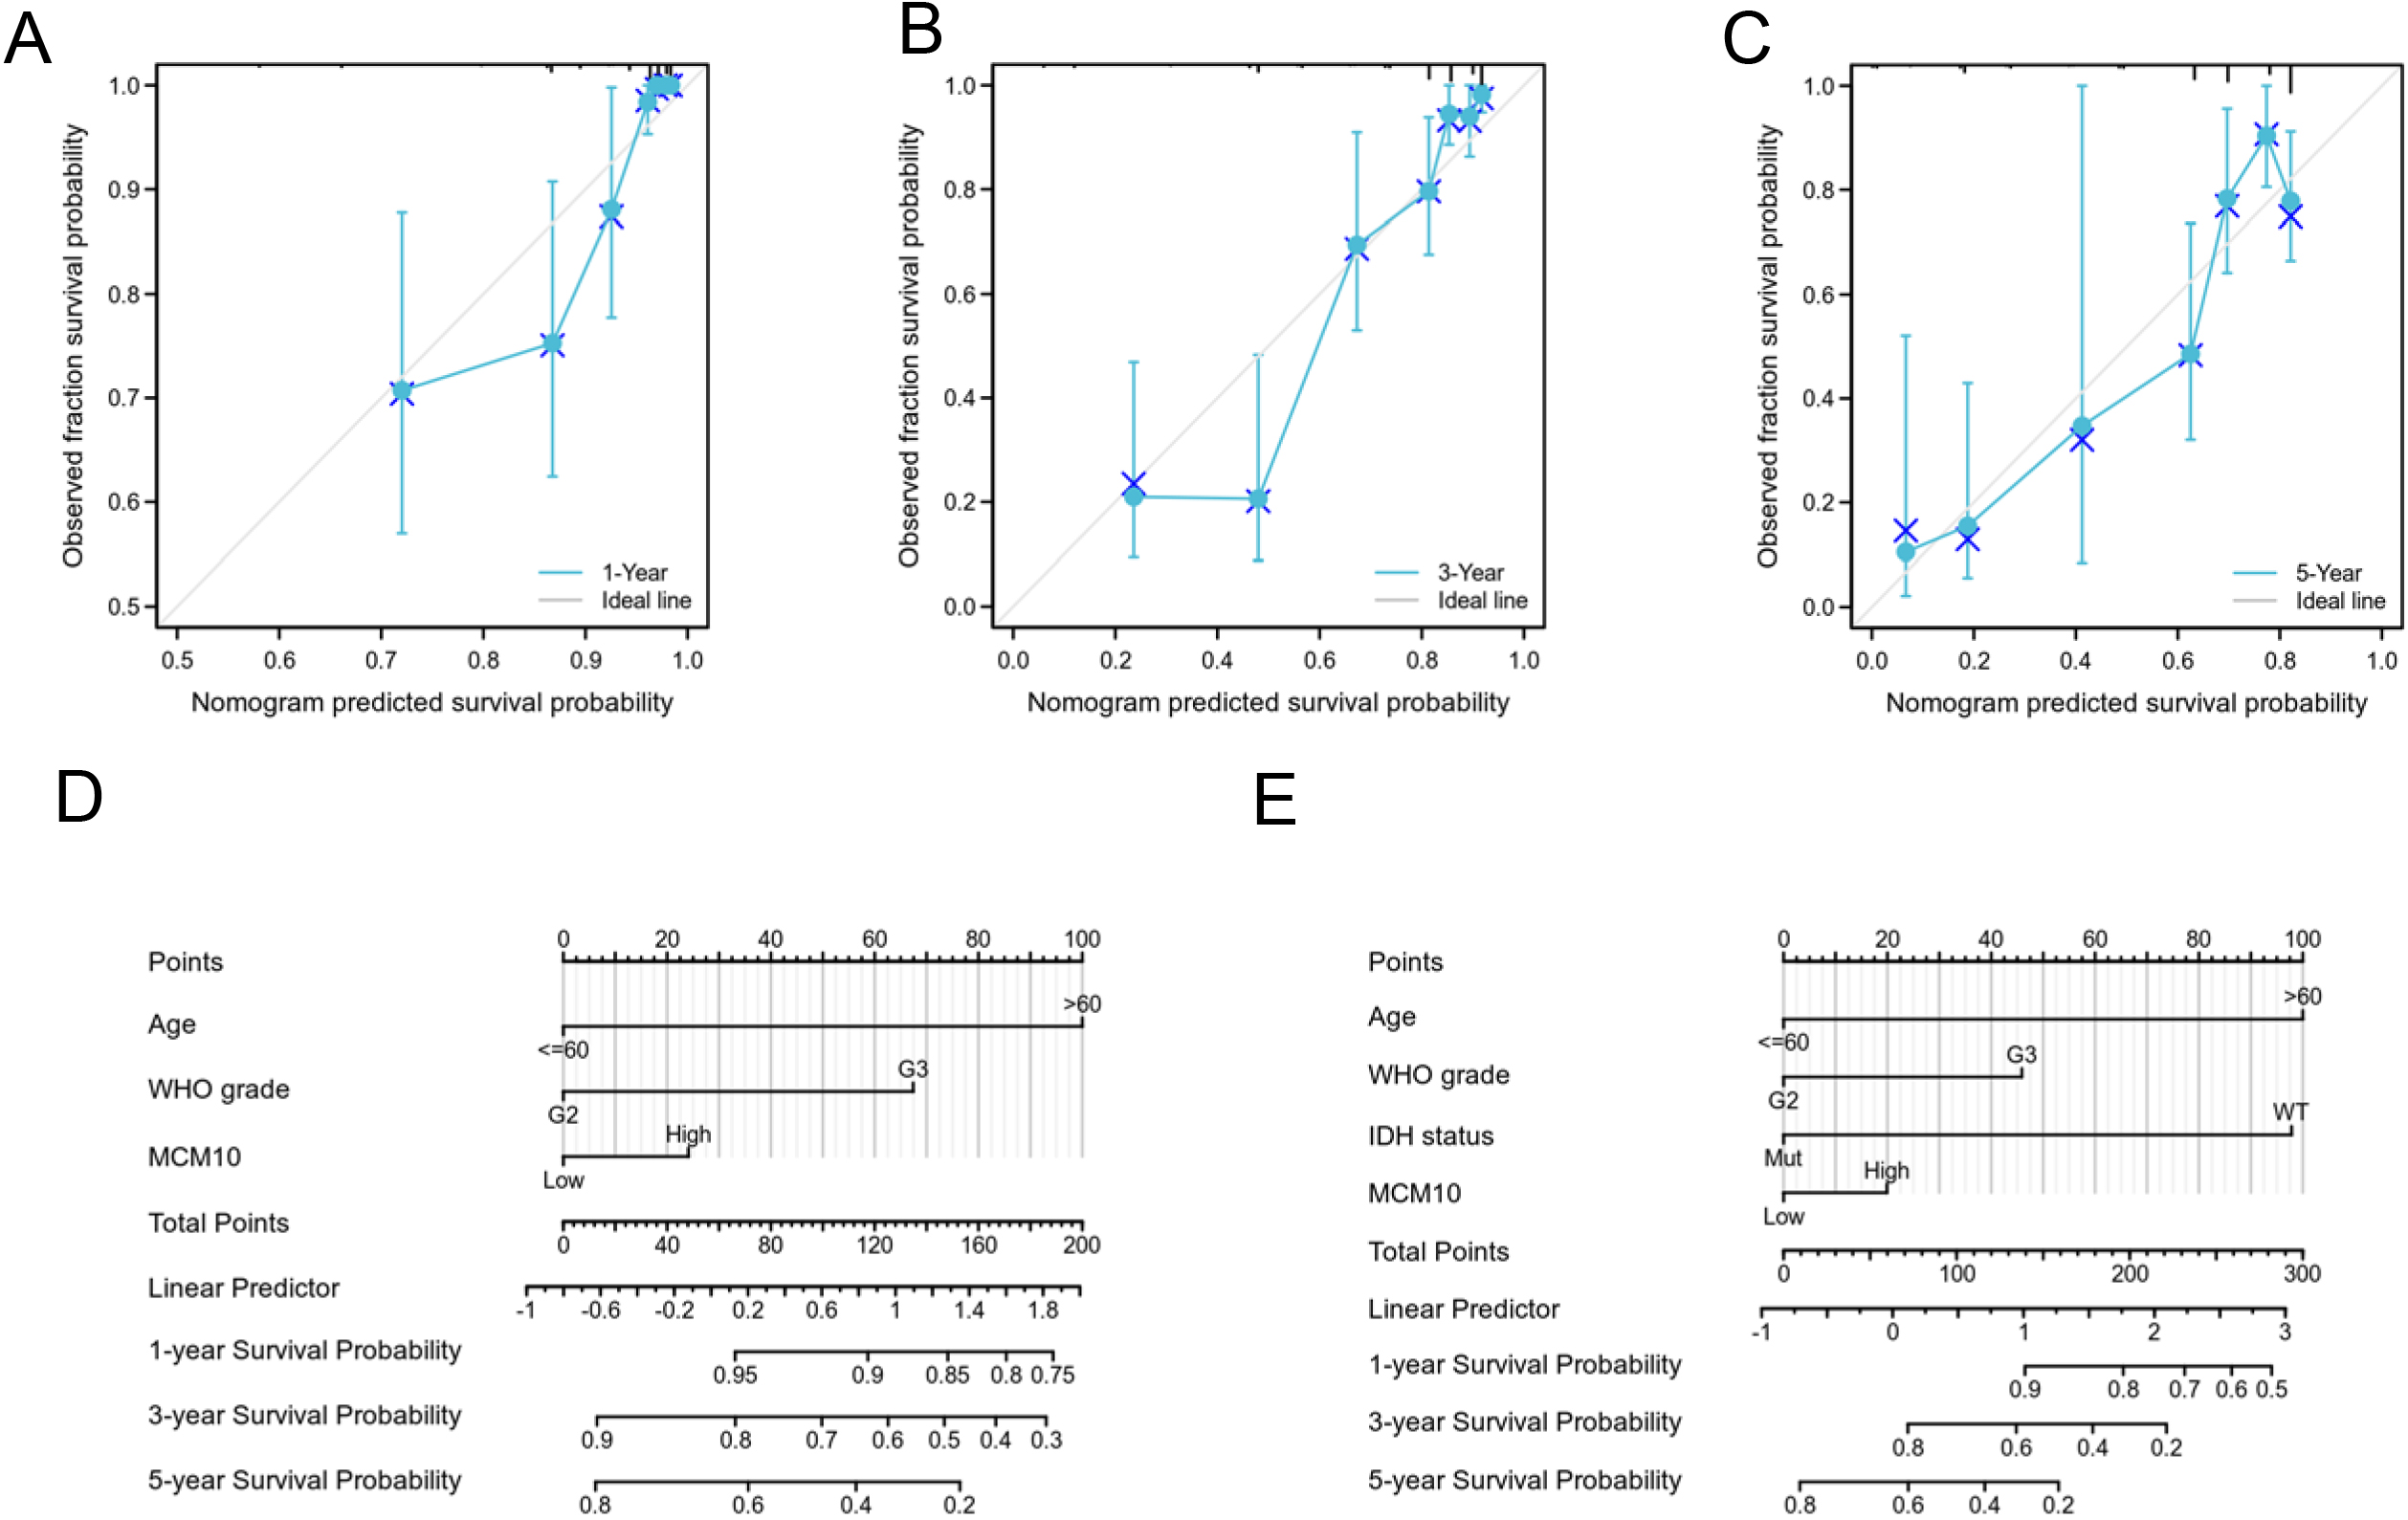
DNA replication is one of the basic physiological activities of living organisms, and the precise replication of DNA requires multiple mechanisms to maintain the structural and functional integrity of the genomes. Any error will lead to genome instability, and then tumors will occur. The MCM family members are important proteins involved in this process [16, 17]. Recent studies have shown that MCM family members are involved in the formation of some tumors, such as the abnormal expression of MCM protein, as predictors for prostate, lung, and gliomas [18, 19, 20, 21]. However, the prognosis correlation of MCM10 protein in glioma and immune infiltration have not yet been reported.
In this study, a combined analysis using the CGGA database and TCGA database found that MCM10 expression was significantly up-regulated in gliomas, and high MCM10 expression was associated with unfavorable clinicopathological factors, such as WHO grade (G3 & G4), 1p/19q codeletion (non-codel), IDH status (Mut) subtype, Age (
Furthermore, MCM10 has been shown to influence a variety of cancer-associated signaling pathways, including BRCA2 associates with MCM10 to suppress PRIMPOL-mediated repriming and single-stranded gap formation after DNA damage [26] and Rad53 checkpoint kinase regulation of DNA replication fork rate via Mrc1 phosphorylation [27]. However, these results do not fully elucidate the mechanism of MCM10 in gliomas, and we should further investigate the biological function of MCM10 and the signaling pathway. In this study, we performed a GSEA analysis and found that the significantly enriched signaling pathways in the MCM10 high expression group included: Rho GTPases signaling, M phase, DNA repair, extra cellular matrix organization, nuclear receptors. The Rho subfamily of GTPase belongs to the Ras superfamily of small GTP binding protein, it is a nucleotide-dependent protein, which plays a “molecular switch” function in the signal transduction process and control of numerous signaling pathways. Rho protein is widely distributed in related immune cells, in T cells and B cells as the effector cells of the adaptive immune system Rho signaling are pivotal for activation and migration. More recently, mutations of Rho and Rho-modulating factors have been identified to predispose for autoimmune diseases and as causative for hematopoietic malignancies [28].
Currently, increasing attention has been given to the tumor immune microenvironment, especially the function of tumor-infiltrating immune cells. Given that the high MCM10 expression group was enriched in signaling pathways related to immune response regulation, we therefore further calculated the correlation between MCM10 expression and the level of immune cell infiltration, The results showed that MCM10 over expression was negatively associated with NK CD56bright cells, Tfh cells, pDCs, and DC. Tfh produce interleukin-21, which sustains proliferation, viability, cytokine production and cytotoxic functions of exhausted T cells. The presence of Tfh is required for efficacy of ant programmed cell death ligand-1 therapy. It is closely linked to the formation of an immunosuppressive microenvironment in gliomas [29]. Glioma cells in the tumor microenvironment and other immune-regulatory-related fine cells such as dendritic cells (DC) produce and secrete cytokines such as IL-6, IL-10, transforming growth factor (TGF), prostaglandin E2 (PGE2), and ID-2, 3-dioxygenase (IDO), These cytokines can directly or indirectly inhibit NK cell activation [30]. These results suggest that MCM10 over expression may influence glioma progression and prognosis by modulating the level of infiltration of immune cells.
The analysis of the identification of DEGs in gliomas showed that the top 10 DEGs with the largest differences in the high and low expression groups of MCTS1 were lncRNA H19, PITX2, MMP13, SEPTIN14, TRDC, ELDR, HOXC12, MYBL2, HOXC-AS1, and HOXA9. Studies have shown that lncRNA H19 may be associated with glioma drug resistance, such as the silencing of LncRNA-H19 decreases chemoresistance of human glioma cells to temozolomide by suppressing epithelial-mesenchymal transition via the Wnt/
However, MCM10 is involved in the recognition of replication initiation sites and the recruitment of other factors, rather than playing a role in the DNA helicase hexamers [16]. Thus, the functional mechanisms of MCM10 remain elusive. Suramin (an antiparasitic drug) and its analogues can block MCM10 binding to dsDNA and reduce replication products [34]. However, no clinical reports of suramin as cancer treatment.
Conclusion
In this study, we identified MCM10 as an independent prognostic indicator in glioma patients, while the high expression of MCM10 suggests a poor prognosis; MCM10 expression is closely related to the immune cell infiltration of gliomas, and MCM10 may be related to the drug resistance and development of gliomas. Although no in vivo experimental validation has been performed, the present results provide a reference for an in-depth exploration of the biological function and mechanism of MCM10 in gliomas.
Footnotes
Conflict of interest
The authors declare that they have no conflict of interest related to this study.
Supplementary data
The supplementary files are available to download from https://dx-doi-org.web.bisu.edu.cn/10.3233/THC-220576.