




Abstract
BACKGROUND:
Diabetic kidney disease (DKD) is an important microvascular complication of diabetes mellitus (DM).
OBJECTIVE:
This study aimed to develop predictive nomograms to estimate the risk of DKD in patients with type 2 diabetes mellitus (T2DM).
METHODS:
The medical records of patients with T2DM in our hospital from March 2022 to March 2023 were retrospectively reviewed. The enrolled patients were randomly selected for training and validation sets in a 7:3 ratio. The models for predicting risk of DKD were virtualized by the nomograms using logistic regression analysis.
RESULTS:
Among the enrolled 597 patients, 418 were assigned to the training set, while 179 were assigned to the validation set. Using the predictors included glycated hemoglobin A1c (HbA1c), high density lipoprotein cholesterol (HDL-C), presence of diabetic retinopathy (DR) and duration of diabetes (DD), we constructed a full model (model 1) for predicting DKD. And using the laboratory indexes of HbA1c, HDL-C, and cystatin C (Cys-C), we developed a laboratory-based model (model 2). The C-indexes were 0.897 for model 1 and 0.867 for model 2, respectively. The calibration curves demonstrated a good agreement between prediction and observation in the two models. The decision curve analysis (DCA) curves showed that the two models achieved a net benefit across all threshold probabilities.
CONCLUSION:
We successfully constructed two prediction models to evaluate the risk of DKD in patients with T2DM. The two models exhibited good predictive performance and could be recommended for DKD screening and early detection.
Introduction
Diabetic kidney disease (DKD), which often occurs in patients with diabetes mellitus (DM) without long-term adequate glycemic control, is an important microvascular complication of DM [1]. It has been reported that DKD occurs in approximately 40% of people with type 2 diabetes mellitus (T2DM) and 30% of those with type 1 diabetes mellitus (T1DM) [2]. And the number of DKD patients is expected to increase by nearly 50% over the next 24 years [2]. The most common outcome for DKD patients is renal failure, but the cardiovascular disease and premature mortality also occur frequently [3]. DKD is closely associated with the prognosis of DM patients. Early diagnosis of DKD and appropriate intervention is important to delay the progression of kidney function decline and prevent end-stage kidney disease (ESKD) [3, 4].
For DKD diagnosis, kidney biopsy is the gold-standard approach. However, it is an invasive procedure and cannot be feasible for all patients [5]. It has been reported that several clinical characteristics were correlated with DKD in T2DM patients [6]. There are some predictive models for prediction of incident DKD and meta-analyses had been performed to review the performances of these models [7, 8]. Different prediction models have different concerns, and it is still necessary to develop more prediction models for DKD events. Nomograms are statistical predictive models that incorporate independent factors to estimate prognosis and risk of chronic diseases [9]. In the present study, we aimed to develop predictive nomograms to estimate the risk of DKD in patients with T2DM in the hope that the models would be useful for DKD screening.
Methods
Patients
This retrospective study was approved by the Ethics Committee of our hospital in accordance with the Declaration of Helsinki. Due to the nature of retrospective study and anonymized patient’s information, informed consent was waived.
All patients were inpatients in the endocrine department from March 2022 to March 2023. Patient information was queried and collected by the HIS system from April to May 2023. The inclusion criteria were: (1) patients with T2DM; (2) aged 18–80 years. The main exclusion criteria included: (1) patients with severe systemic disease such as severe infectious diseases (Pestis and cholera), autoimmune diseases, and cancer; (2) patients with severe psychiatric disturbance; (3) pregnant women; (4) patients without complete data.
Generally speaking, the sample size of the study is 10–20 times the total number of factors to be analyzed. Based on this calculation, the sample size for this study was 170–340. In order to obtain a more reliable outcome, we included as many cases as possible.
A training set and a validation set were randomly generated from the study population in a 7:3 ratio. The training set was used to train the prediction models. The validation data were used to validate the models.
Data collection
DKD was diagnosed as eGFR
Predicted outcomes
The included outcomes for external validation were microalbuminuria, macroalbuminuria, diabetic kidney disease, and chronic kidney disease. The outcomes defined was as follows: DKD was diagnosed as eGFR
Statistical methods
The data analysis was performed using R4.0.3 software. Whether the continuous data conformed to a normal distribution was tested by the Kolmogorov-Smirnov test. Continuous data were expressed as mean
The validation set was used to confirm the newly established nomograms. The concordance index (c-index) was used to evaluate the predictive accuracy of the models. Sensitivity and specificity were evaluated by receiver operating characteristics curve (ROC). Furthermore, the clinical value of the model was evaluated by decision curve analysis (DCA). The Delong test was used to compare the area under curve (AUC) of the ROC curves. A
Results
Demographic and clinical characteristics of patients
From March 2022 to March 2023, 597 patients (314 men and 283 women) with T2DM who met the inclusion criteria were retrospectively analyzed in this study. The mean age of the enrolled patients was (61.54
The demographic data for the enrolled patients (
597)
The demographic data for the enrolled patients (
Note: BMI, body mass index; SD, standard deviation; FPG, fasting plasma glucose; HbA1c, glycated hemoglobin A1c; IQR, interquartile range; BUN, blood urea nitrogen; Cys-C, cystatin C; TG, triglyceride; TC, total cholesterol; HDL-C, high density lipoprotein cholesterol; LDL-C, low density lipoprotein cholesterol; DPN, diabetic peripheral neuropathy; DR, diabetic retinopathy; DD, duration of diabetes; DKD, diabetic kidney disease.
The results of the univariate analysis of logistic regression model are presented in Table 2. We found that gender (
Univariate analysis of predictors for diabetic kidney disease screening in the training cohort
Univariate analysis of predictors for diabetic kidney disease screening in the training cohort
Note: OR, odds ratio; CI, confidence interval; Note: BMI, body mass index; SD, standard deviation; FPG, fasting plasma glucose; HbA1c, glycated hemoglobin A1c; BUN, blood urea nitrogen; Cys-C, cystatin C; TG, triglyceride; TC, total cholesterol; HDL-C, high density lipoprotein cholesterol; LDL-C, low density lipoprotein cholesterol; DPN, diabetic peripheral neuropathy; DR, diabetic retinopathy; DD, duration of diabetes.
Multivariate analysis of predictors for diabetic kidney disease screening in model 1
Note: OR, odds ratio; CI, confidence interval; HbA1c, glycated hemoglobin A1c; HDL-C, high density lipoprotein cholesterol; DR, diabetic retinopathy; DD, duration of diabetes.
Multivariate analysis of predictors for diabetic kidney disease screening in model 2
Note: OR, odds ratio; CI, confidence interval; HbA1c, glycated hemoglobin A1c; Cys-C, cystatin C; HDL-C, high density lipoprotein cholesterol.
The nomograms for estimating risk of DKD in patients with T2DM: (A) full model (model 1); (B) laboratory-based model (model 2). HbA1c, glycated hemoglobin A1c; Cys-C, cystatin C; HDL-C, high density lipoprotein cholesterol; DR, diabetic retinopathy; DD, duration of diabetes; DKD, diabetic kidney disease; T2DM, type 2 diabetes mellitus.
ROC curves of different models for diabetic kidney disease screening: (A) ROC curve of model 1 in training set; (B) ROC curve of model 1 in validation set; (C) ROC curve of model 2 in training set; (D) ROC curve of model 2 in validation set. ROC: Receiver operating characteristic; AUC: area under curve.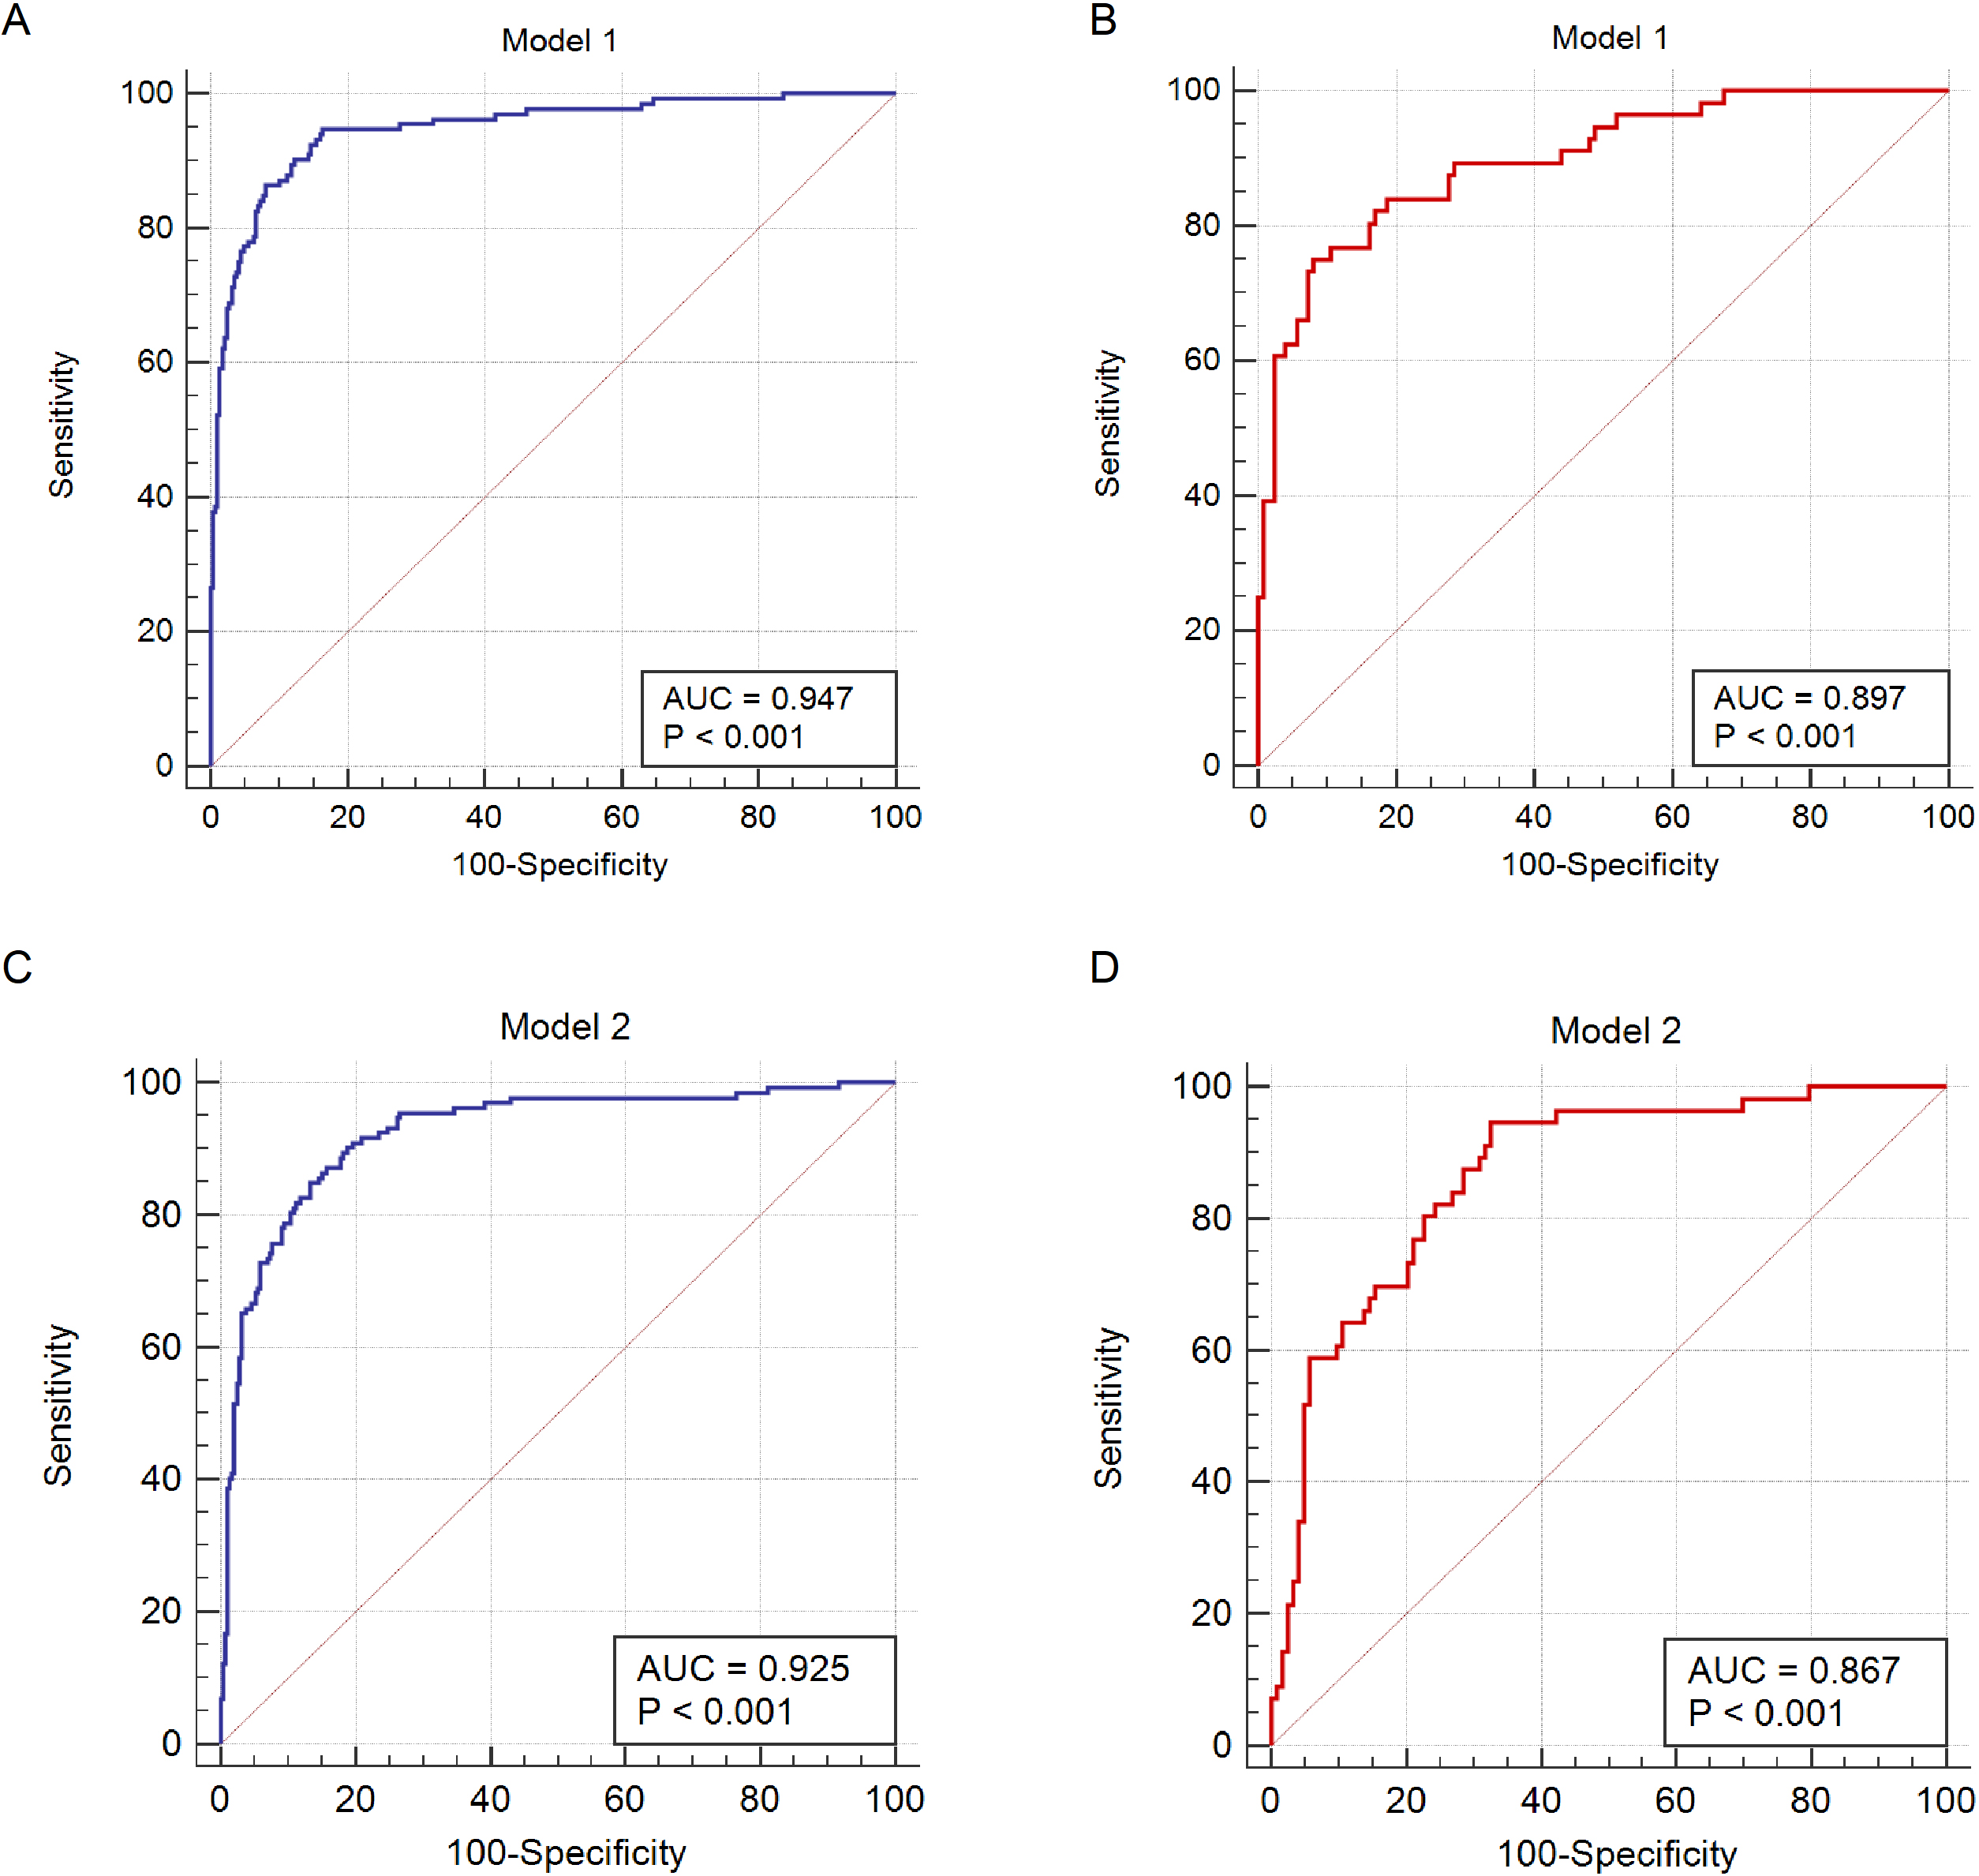
The C-index for model 1 was 0.947 (95% CI, 0.923–0.971) in the training set (Fig. 2A) and 0.897 (95% CI, 0.847–0.948, Fig. 2B) in the validation set. The C-index for model 2 was 0.925 (95% CI, 0.896–0.954) in the training set (Fig. 2C) and 0.867 (95% CI, 0.812–0.922, Fig. 2D) in the validation set. Both models generated AUCs with good discrimination. For both models, the Hosmer-Lemeshow test found no statistical significance in the validation set (
Calibration curves of different models in the validation set: (A) calibration curves of model 1; (B) calibration curves of model 2.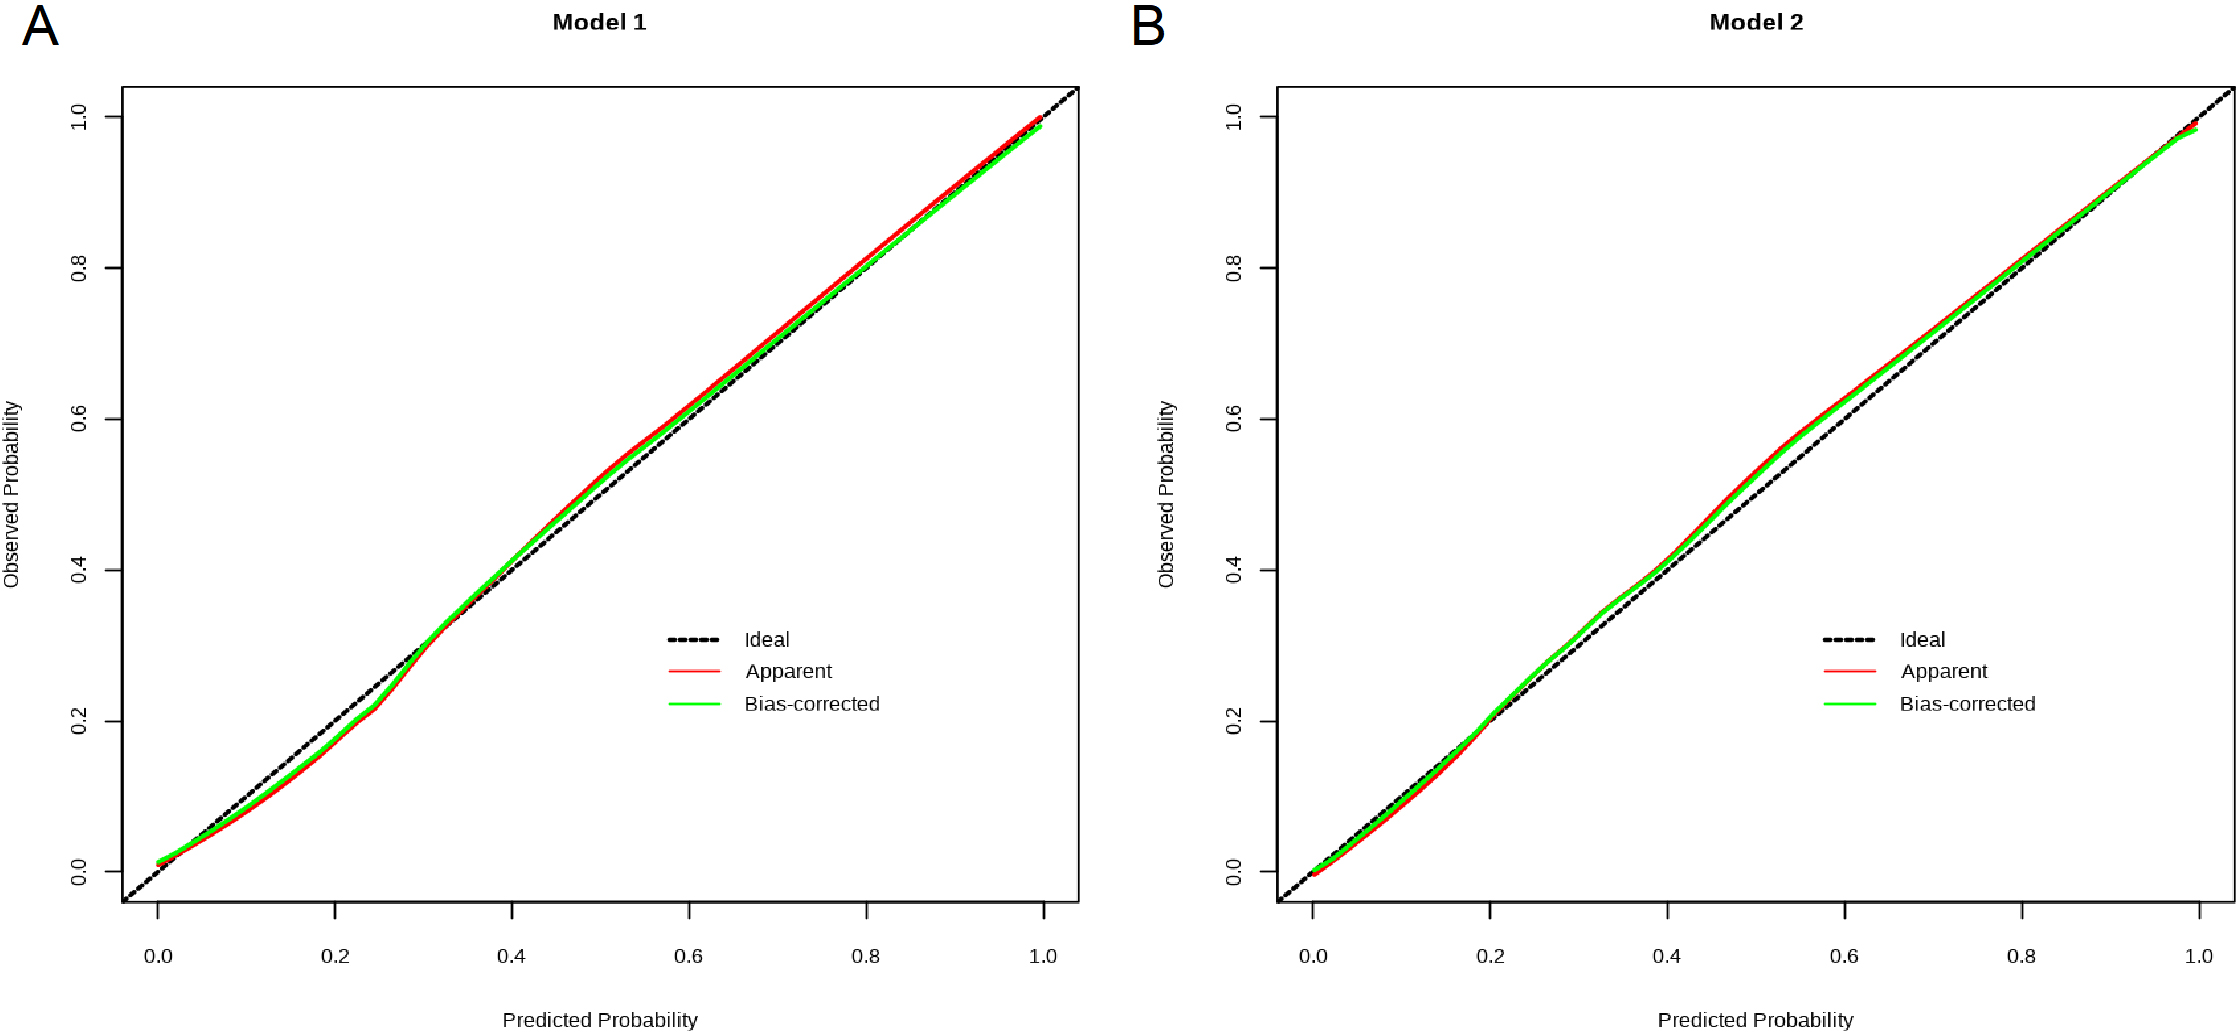
Decision curve analysis for the predictive models. The net benefit was produced against the high-risk threshold.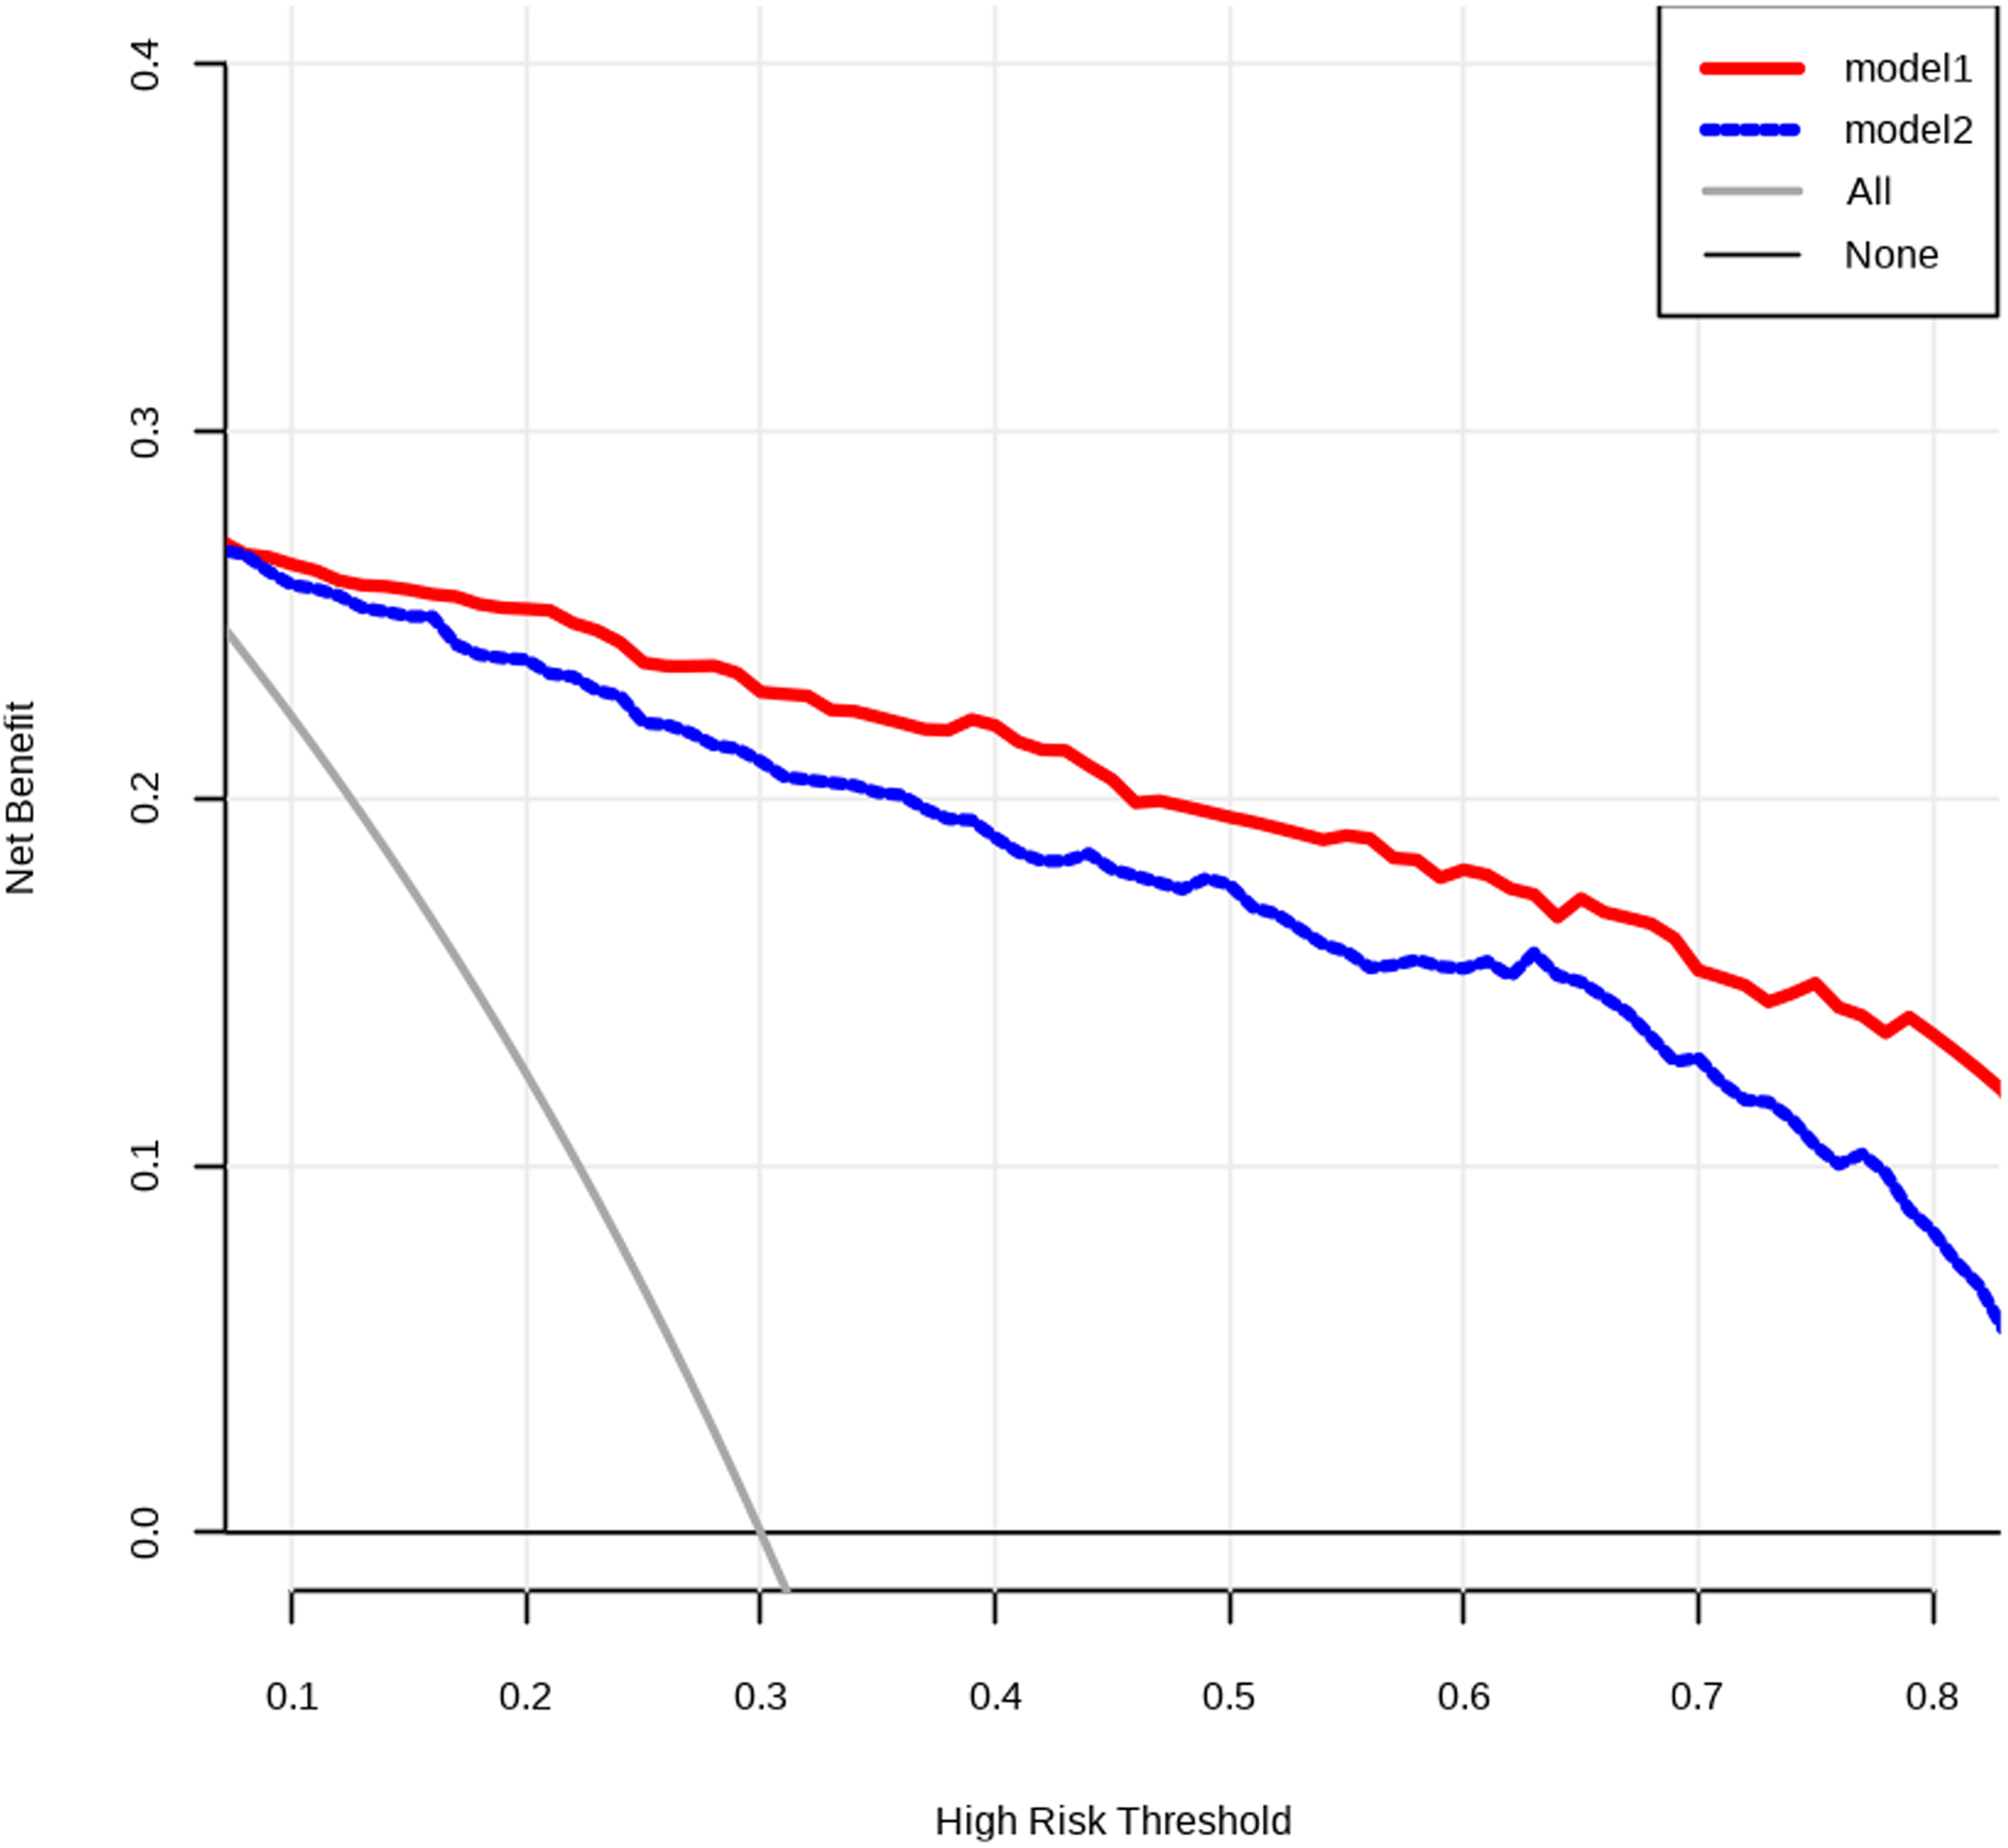
Subsequently, we compared the diagnostic performances of the two models in the validation set. The results showed that the AUC of model 1 for predicting DKD was similar to that of model 2 (0.897 vs. 0.867,
Comparison of ROC curves of the established models.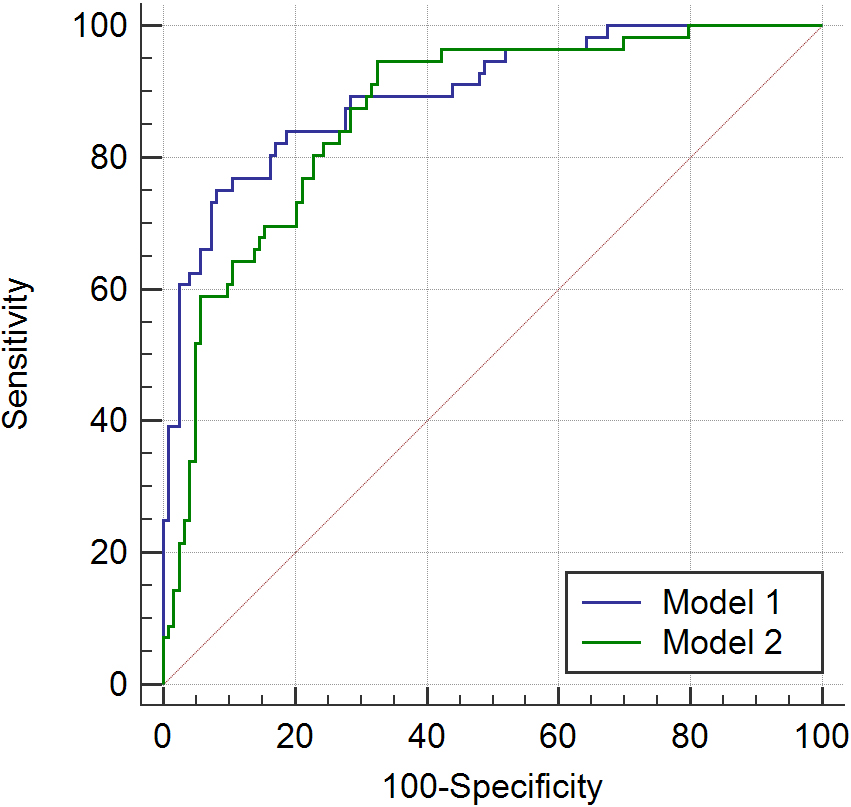
We enrolled all T2DM patients regardless of the renal function. We successfully constructed two nomograms (a full model and a laboratory-based model) for DKD screening. We demonstrated that the two models showed good discrimination and calibration for estimating DKD risk.
Using the predictors included HbA1c levels, HDL-C levels, presence of DR and DD, we constructed a full model (model 1) for predicting DKD. And using the laboratory indexes of HbA1c, HDL-C, and Cys-C, we developed a laboratory-based model (model 2). HbA1c is traditionally used to monitor blood glucose control in DM patients. It has been reported that lowering HbA1c could reduce the risk of micro- and macrovascular complications of DM [11]. Maintenance of the low HbA1c level can prevent the development and progression of DKD [12]. In previous studies, HbA1c was reported to be a sensitive risk factor for clinical outcomes in DM patients with DKD [8, 13]. The HbA1c-based predicting models were found to be helpful for differential diagnosis of DKD and non-DKD in DM patients [5, 14]. In line with previous studies, we found that higher HbA1c levels were associated with higher risk of DKD in the present study.
HDL-C concentration is one of the main features of dyslipidemia in patients with DM [15]. Several studies have demonstrated that high HDL-C level is the protective factor against the progression of DKD [15, 16]. In Italy, Russo et al. analyzed the data from 47,177 patients with T2DM and found that low HDL-C was an independent risk factor for the development of DKD [17]. In this study, we also identified that the HDL-C level was a predictor of DKD risk in T2DM patients, which was included in the two models we established. Our results showed that patients with a higher HDL-C level had a lower risk to develop DKD.
DR and DKD are two most important complications of DM. Previous studies have shown that there is a strong correlation between the severity of DR with severity of DKD [18]. Consistent with these studies, the presence of DR was also demonstrated as a predictor for DKD risk in T2DM patients in model 1. We found that patients with DR were more likely to develop DKD.
It is generally believed that the interval between T2DM onset and development of DKD was over 10 years [5]. Thus, a longer duration of T2DM was significantly associated with a higher risk of DKD [19, 20]. In the study where a specific time period was clearly defined, a duration of less than 5 years from T2DM onset could predict non-DKD [20]. Similarly, in this study, we found that patients with a DD more than 5 years had a higher risk to develop DKD than those with a DD less than 5 years. DD was identified as a predictor for DKD risk and included in our full model.
In our study, we also observed that a higher Cys-C level could predict a risk of DKD. It has been clearly pointed out that serum Cys-C is an early marker for detection of DKD and reflection of renal function changes [21, 22]. Wei et al. [23] found in their study that patients with DKD had a higher Cys-C level than those without DKD. Liao et al. [24] conducted a meta-analysis to evaluate the accuracy of serum Cys-C for diagnosing DKD. They included 26 published studies and found that Cys-C had an excellent diagnostic value with good sensitivity and specificity for DKD [24]. Thus, Cys-C is potential risk factor for DKD development in patients with T2DM. In the present study, Cys-C level was included in our laboratory-based model. But for the full model, Cys-C level was rejected after multivariate analysis. The rejection of this factor in model 1 may be the result of nuances in the data set or confounding by other predictors.
The risk screening tools are essential and cost-effective in clinical practice and healthcare management. In this study, we demonstrated that both models we constructed exhibited good discrimination and calibration in our internal validations. They are the potential useful tools for DKD screening in patients with T2DM. Furthermore, the diagnostic performances of the two models were not significantly different. Physicians can choose different models to evaluate DKD risk for patients with T2DM based on the personal medical data.
The present study has several limitations. First, the nomograms were established based on data obtained from a single center in China. This may cause selection bias. Second, information bias and selection bias (including inclusion criteria and processing of missing data) may cause bias in the results of this study. Third, DKD is usually associated with numerous factors. But our study only included the most available factors. In this study, the influencing factors of DKD were not fully included. Artificial intelligence has broad prospects in disease detection [25, 26]. In the future, we will include more influencing factors [27] and expand the sample size for further research. In the future, the prediction model established in this study will be combined with artificial intelligence for early diagnosis and classification of domain diseases [28].
Conclusion
In this study, we successfully constructed two prediction models to evaluate the risk of DKD in patients with T2DM. The two models exhibited good predictive performance and could be recommended for DKD screening and early detection.
Ethics statement
This retrospective study was approved by the Ethics Committee of Bengbu First People’s Hospital in accordance with the Declaration of Helsinki. Due to the nature of retrospective study and anonymized patient’s information, informed consent was waived.
Availability of data and materials
All data generated or analyzed during this study are included in this published article.
Funding
The authors did not receive any financial support for the research, authorship, or publication of this manuscript.
Author contributions
Conception and design of the work: CX; Data collection: CX, PXM; Analysis and interpretation of the data: CX, PXM; Statistical analysis: CX, PXM; Drafting the manuscript: CX; Critical revision of the manuscript: CX, PXM. All authors approved the final version of the manuscript.
Footnotes
Acknowledgments
Not applicable.
Conflict of interest
None of the authors have any personal, financial, commercial, or academic conflicts of interest to report.