



Abstract
BACKGROUND:
Preclinical drug testing requires in vitro and in vivo assessments that are vital for studying drug pharmacokinetics and toxicity. Distinct factors that play an important role in drug screening, such as hydrophobicity, solubility of the substance and serum protein binding can be challenging by inducing result inconsistencies. Hence, establishing accurate methods to quantify drug concentrations in cell cultures becomes pivotal for reliable and reproducible results important for in vivo dosing predictions.
OBJECTIVE:
This research focuses on developing an optimized analytical approach via high-pressure liquid chromatography (HPLC) to determine thymoquinone (TQ) levels in monolayer cell cultures.
METHODS:
The method’s validation adheres to the International Council for Harmonisation (ICH) guideline M10, ensuring its acceptance and applicability. Using an HPLC system with a Diode Array Detector (DAD), the study fine-tuned various parameters to achieve an efficient separation of TQ. Validation covered specificity, sensitivity, matrix effects, linearity, precision, and accuracy, alongside assessing TQ stability in RPMI-1640 medium.
RESULTS:
The HPLC method exhibited remarkable TQ specificity, free from interfering peaks at the analyte retention. Sensitivity analysis at the lower limit of quantification (LLOQ) revealed 5.68% %CV and 98.37% % mean accuracy. Matrix effect evaluation showcased accuracy within 85–115%. Linearity spanned in the concentration range of 2–10
CONCLUSION:
The developed HPLC-DAD method emerges as specific, accurate, sensitive, and reliable for TQ determination in cell cultures. It ensures robust TQ quantification, enhancing precise in vitro assessments and dependable dosing predictions for in vivo studies. Further research is advocated to investigate TQ’s stability across diverse environmental conditions.
Introduction
Preclinical testing is an essential phase in drug development that involves in vitro and in vivo evaluation [1, 2]. In vitro testing is commonly used to assess drug pharmacokinetics and toxicity [3], and different cell-based models are extensively utilized for this purpose. However, these assays can be influenced by various factors, such as compound hydrophobicity, solubility, and non-specific binding with serum proteins, leading to inconsistent data and incorrect dosing metrics. Therefore, it is critical to establish optimal analytical methods for the determination of drug concentrations in cell cultures to ensure accurate results and adequate dosing metrics for in vivo studies [4, 5].
One of the natural compounds that have shown significant pharmacological activities is thymoquinone (TQ), an active constituent of black cumin (Nigella sativa L.). TQ (Fig. 1) has demonstrated anti-inflammatory, anti-oxidant, anti-microbial, anti-tumor, analgesic, hepatoprotective, and neuroprotective activities [6, 7, 8, 9]. However, its instability in aqueous solutions makes it challenging to determine its stability and concentration in cell cultures accurately [10, 11].
Structure of Thymoquinone.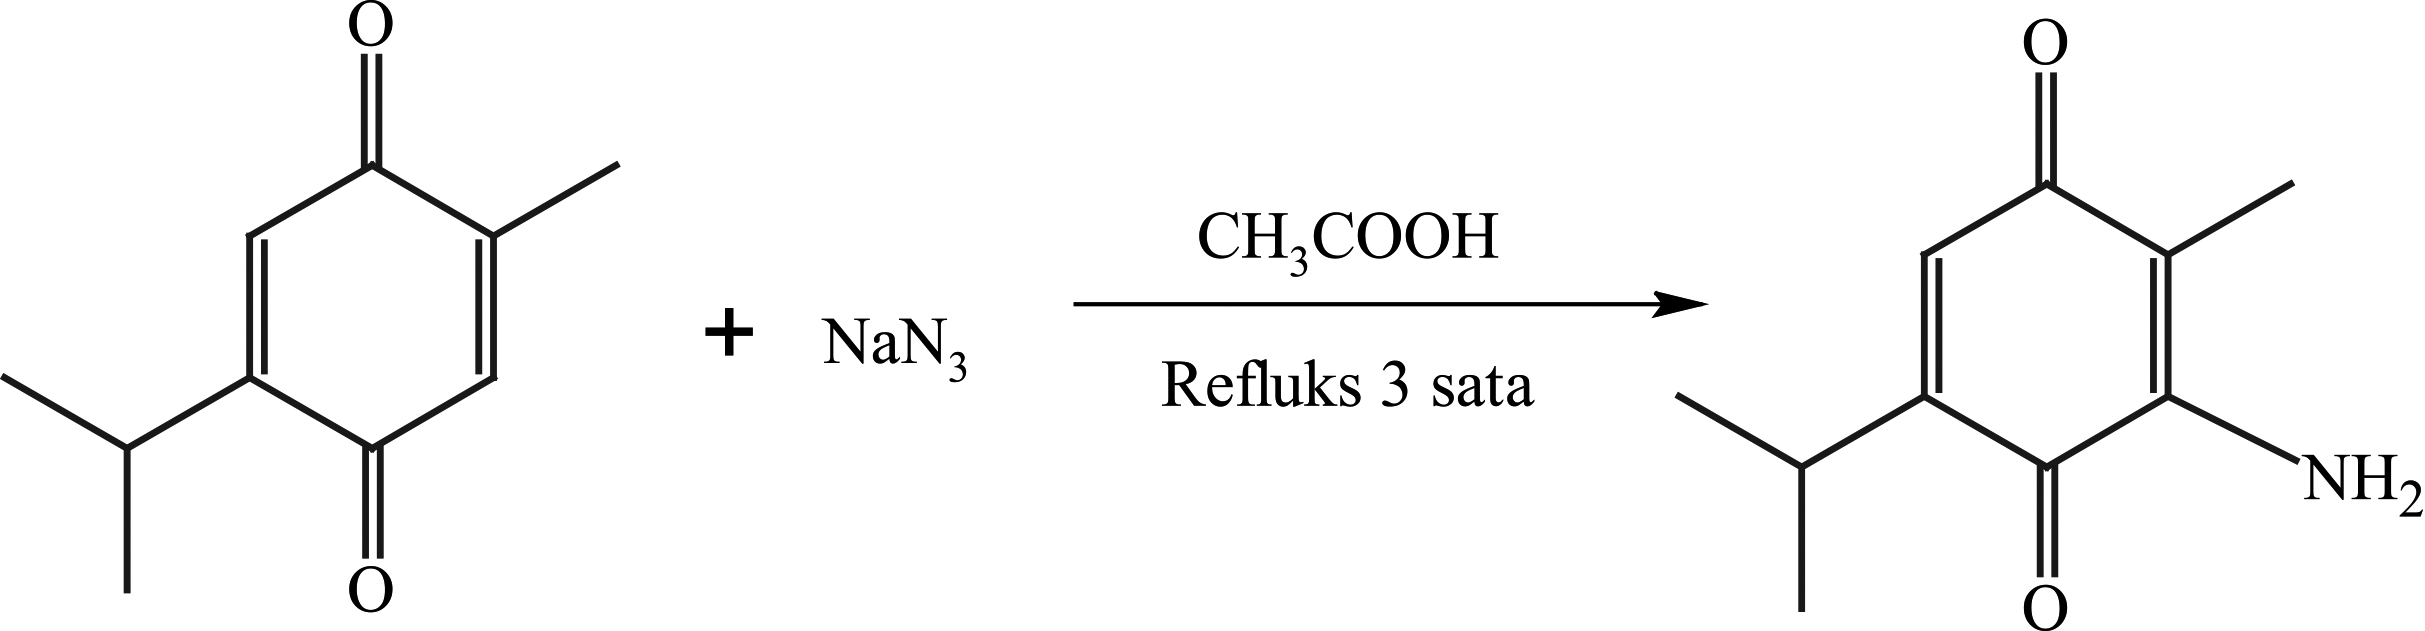
To address this issue, this study aimed to establish optimal analytical conditions for TQ determination in monolayer cell cultures using high-pressure liquid chromatography (HPLC). The validation of the optimized method was carried out in accordance with the International Council for Harmonisation (ICH) guideline M10 on bioanalytical method validation and study sample analysis to ensure its acceptability and application [12].
By establishing reliable and accurate analytical methods for TQ determination in cell cultures, the results of in vitro evaluations can be adequately interpreted, and dosing metrics for studies can be determined accurately. This approach can help overcome some of the disadvantages of in vitro testing and give an insight into the importance of application of analytical methods in drug screening as numerous factors in cell culture media can influence the drug stability.
Chemicals and cells
Pharmaceutical grade TQ (purity 99.8%) was purchased from Sigma-Aldrich Chemie GmbH, Germany. Acetonitrile (for HPLC-super gradient Reag. Ph. Eur., ACS water
Apparatus
The Agilent Technologies HPLC 1260 Infinity II (Agilent Technologies, Inc., Santa Clara, USA) was used for method development and validation. This system was equipped with a binary pump integrated with a two-channel degasser, autosampler, column oven, and diode-array detector (DAD). The chromatographic separation was performed on a Zorbax SB-C18 5
HPLC conditions
Isocratic separation was performed at 30∘C using a mixture of acetonitrile and water (50:50,
Standard solution
To prepare a stock standard solution with a concentration of 100
Samples
Cells were plated in 6-well plates at a concentration of 2
In negative control, DMSO in final concentration 0.001 % was added to the cells. After half an hour, cells were centrifuged for 5 minutes at 320 g and supernatant was used for analysis of TQ concentration. Additionally, two solutions of 10
Method validation
Following the ICH guidelines M10 for bioanalytical method validation and study sample analysis [12], we conducted a thorough validation procedure that encompassed multiple aspects. These included evaluating specificity and screening the biological matrix, assessing sensitivity, investigating the matrix effect, determining linearity, as well as examining precision and accuracy, and the method’s ruggedness in terms of precision, accuracy, and linearity.
System suitability was evaluated using a middle quality control (MQC) sample with a concentration of 6
Specificity assessment involved utilizing six blank standards and LLOQ-level samples to screen the biological matrix. Our scrutiny aimed to uncover any potential interference between blank and sample responses. Sensitivity analysis revolved around utilizing the LLOQ-level sample to establish the lowest detectable limit. Subsequently, we calculated the % mean accuracy and % CV (coefficient of variation). Furthermore, we explored the matrix effect’s impact on analyte quantitation in relation to signal consistency, encompassing both suppression and enhancement effects. This investigation was conducted across six distinct lots of TQ cell growth medium. We prepared three replicates each of low quality control (LQC) and high quality control (HQC) levels from these cell growth medium samples, totaling 36 quality control (QC) samples. The accuracy was evaluated, and % bias was calculated across all QC samples. For testing of the dilution integrity, QC was prepared with analyte concentrations in the matrix that exceeded the ULOQ. The QC was then diluted with the blank matrix and six replicates per dilution factor (
To ascertain linearity, we examined standard plots corresponding to a 6-point standard calibration curve. This curve displayed linear behaviour within the range of 2–10
Analytical tools for greenness assessment
The greenness of chemical processes, crucial in modern laboratories, is evaluated through specific tools considering environmental impacts. This assessment includes parameters like chemical hazards, energy consumption, occupational risks, and waste generation [13]. For our method, we assessed greenness using the National Environmental Methods Index (NEMI) tool [14].
Results and discussion
HPLC-DAD involves the use of a DAD in conjunction with HPLC, making it a highly utilized method for monitoring active substance concentrations in various media and matrices under different conditions [15]. In order to develop a method for direct determination of TQ in cell cultures, we developed the HPLC method and optimized some important parameters to achieve the best performance. Different combinations of solvent systems of acetonitrile–water and methanol-water were tested in order to determine the best conditions for the effective separation and optimization of TQ. Collectively, the best chromatographic condition was achieved using acetonitrile and water (50:50,
The appropriate validation of analytical methods has become an essential part of successful identification and quantification of active substances [16]. Method validation is the process of demonstrating that an analytical method is suitable for its intended purpose and can provide accurate and reliable results. It ensures that the results obtained from the method are trustworthy and can be used for making critical decisions related to the safety and efficacy of a product.
Validation of the analytical method involves examining the validation parameters and assessing their usability [17]. The most commonly used validation is performed according to ICH Guideline [12], which clearly points out the criteria by which a given analytical method is tested. The guidelines discuss the characteristics to be taken into account during the validation of analytical procedures included as part of registration applications submitted to distinct authorities.
The validation parameters typically include specificity, selectivity, calibration curve (response function), range (LLOQ to ULOQ), accuracy, precision, carry-over, dilution integrity, and stability. These parameters provide information on the ability of the method to produce accurate and precise results, its ability to detect and quantify the analyte at low levels. The proposed analytical method for TQ determination in cell growth media was further validated following the ICH Guidelines.
Method validation
System suitability and auto sampler carryover
Six individual replicates of middle quality control samples, each featuring distinct concentrations, were subjected to injection. The coefficient of variation (%CV) was subsequently computed for these samples. Specifically, the %CV calculations encompassed the retention time of the analyte. The findings revealed that the %CV values for the retention time remained at or below 2%. These outcomes, falling within the predefined acceptance criteria, have been succinctly summarized in Table 1. To ascertain the accuracy and precision of the method, a carryover experiment was executed. This experiment aimed to ensure that carryover effects would not adversely impact these aspects. Importantly, the results of the carryover experiment demonstrated the absence of any detectable carryover, as presented in Table 2.
System suitability data
System suitability data
System suitability data
The assessment of selectivity aims to confirm the absence of substantial response arising from interfering components at the retention time (s) of the analyte or the internal standard in the blank samples. Interfering peaks present in the standard blank at the same retention time as the analyte were required to exhibit a response
Specificity and screening of biological matrix
Specificity and screening of biological matrix
At the LLOQ level, the precision and accuracy of TQ exhibited a coefficient of variation (%CV) of 5.68%, and the % mean accuracy was determined to be 98.37%. As per the acceptance criteria, a minimum of 67% (4 out of 6) of the samples should fall within the range of 80–120%. Moreover, the % mean accuracy is expected to be within the 80–120% range, and the %CV accuracy should not exceed 20%.
The obtained results align with the acceptance limits and are presented in Table 4. This confirms high sensitivity of the method towards TQ.
Sensitivity data
Sensitivity data
Table 5 displays the matrix effect information for HQC and LQC levels. To fulfil the acceptance criteria, a minimum of 67% (2 out of 3) of samples at each level should fall within the 85–115% range. Additionally, the acceptance criteria dictate that at least 80% (5 out of 6) of the matrix lots should meet these standards. Moreover, the % mean accuracy of the back-calculated concentration for LQC and HQC samples, which are derived from distinct biological matrix lots, is expected to be within the 85–115% range.
Matrix effect
Matrix effect
The linearity of the method was assessed across six concentration levels, encompassing the LLOQ. The calibration curve exhibited linearity within the range of 2–10
Linearity
Linearity
Calibration plot for concentration v/s area ratio..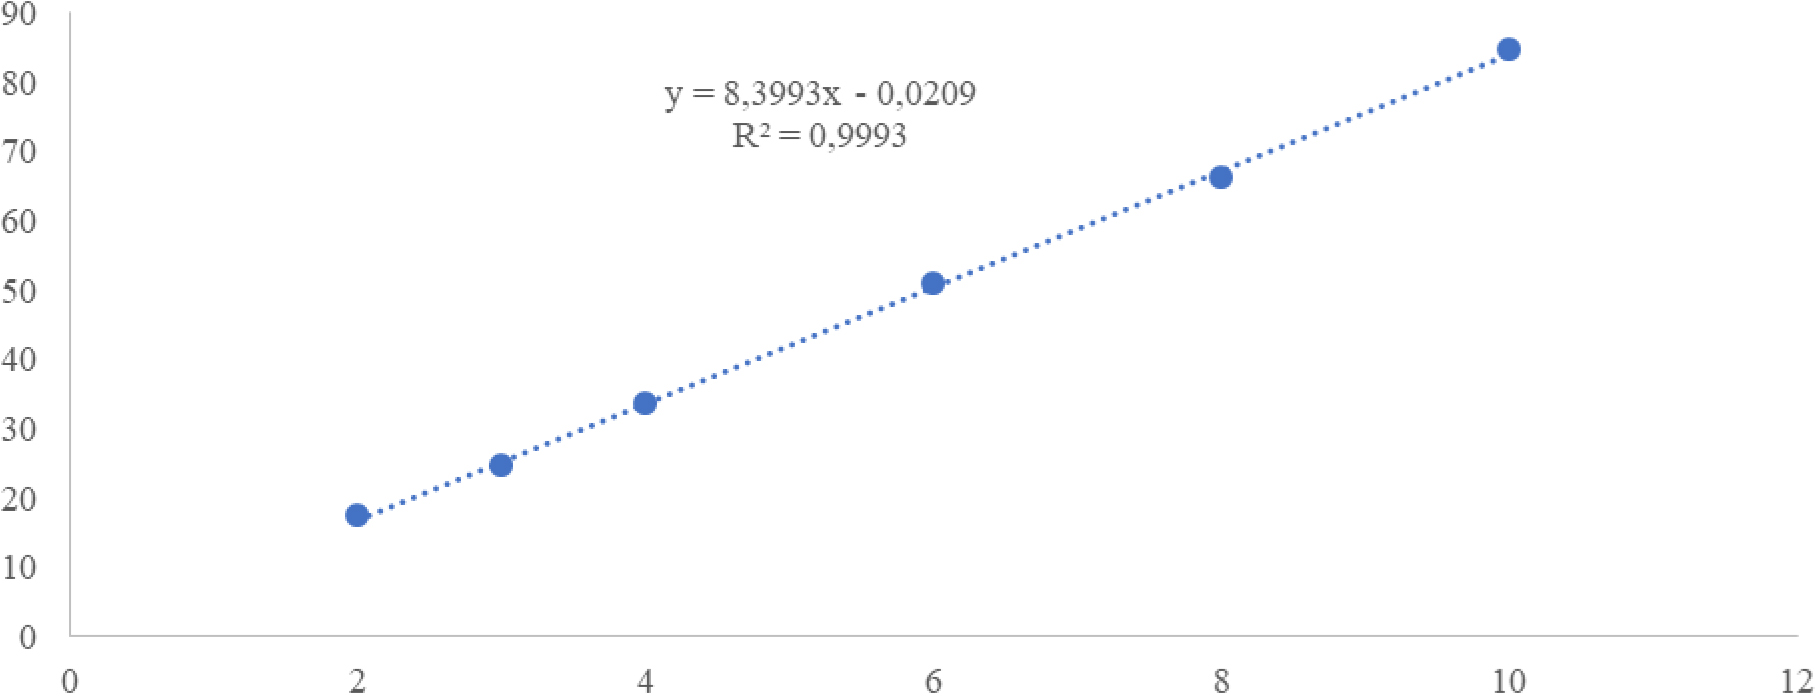
Interday and intraday precisions were quantified as relative standard deviations and expressed as percentages of the TQ concentration [18]. The %CV of estimated concentrations across all four quality control samples, each replicated six times for the analyte, ranged from 0.18% to 4.80%. In terms of % mean accuracy, LLOQ, LOQ, MOQ, and HQC values ranged from 94.52% to 105.80%.
For inter-day precision and accuracy, the %CV and accuracy results across all quality control samples fell within the ranges of 0.42–4.08% and 95.29–102.56%, respectively. Adhering to acceptance criteria, a minimum of 67% of the QC samples were
Detailed precision and accuracy data can be found in Table 7. Figure 3–7 show the chromatograms of the quality control samples. The obtained data collectively indicate favorable precision for all tested concentrations in both intraday and inter-day samples.
Precision interday and intraday data
Precision interday and intraday data
Chromatogram of LLOQ.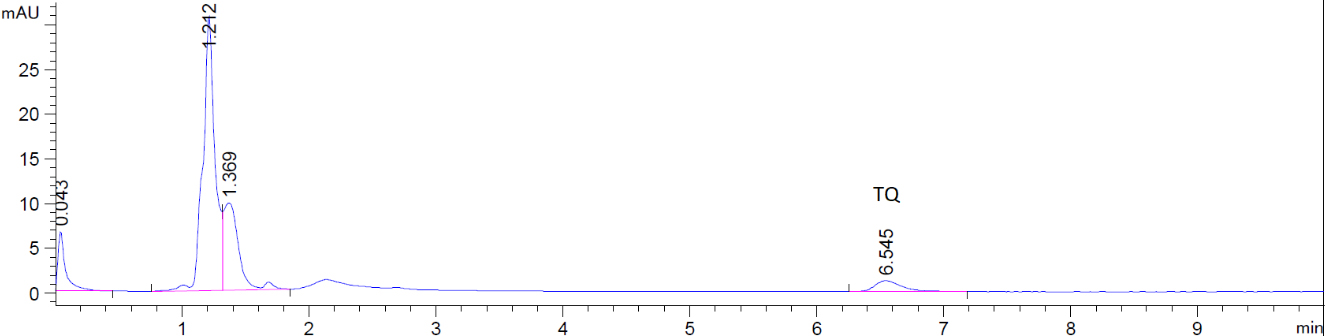
Chromatogram of LQC.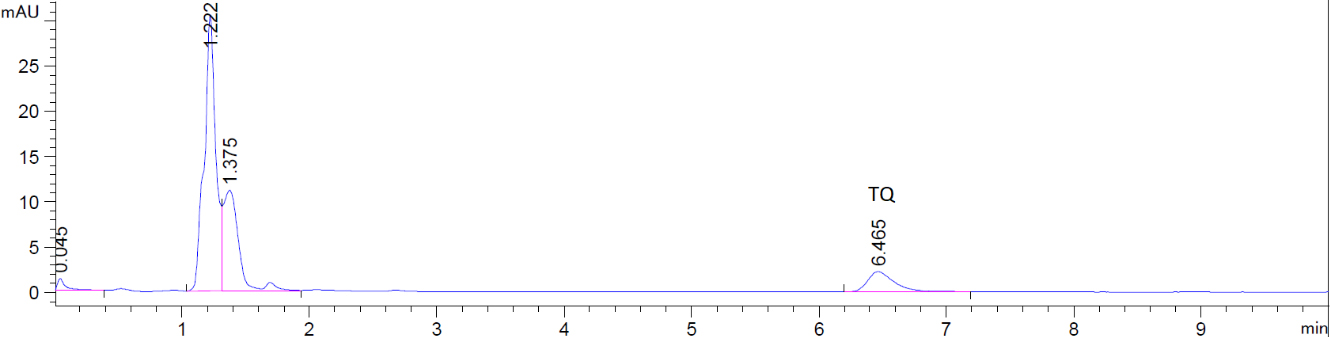
Chromatogram of MQC.
Both dilution factors (3/10 and 5/10) met the precision requirement (
Dilution integrity
Dilution integrity
Chromatogram of HQC.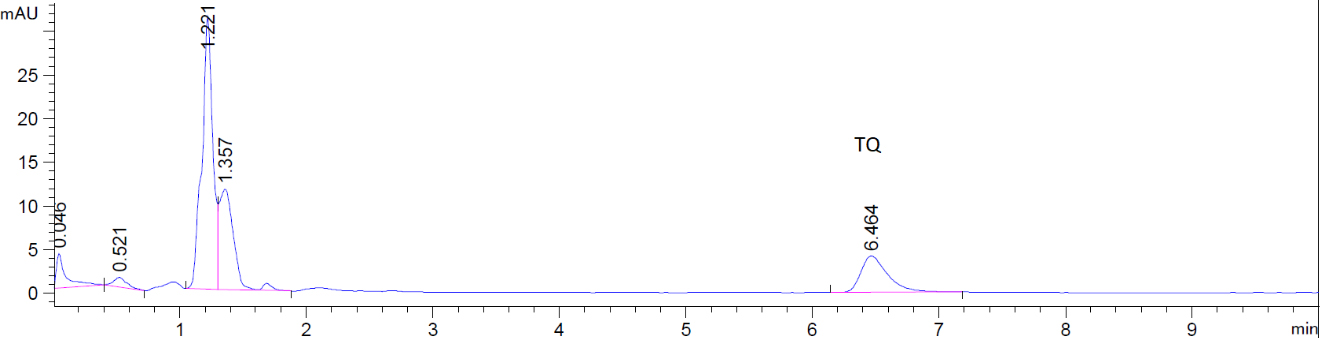
Chromatogram of ULOQ.
Degradation kinetics of TQ in RPMI-1640 medium. Curves of thymoquinone kinetics: a) Zero- order model, b) First- order model, c) Second- order model.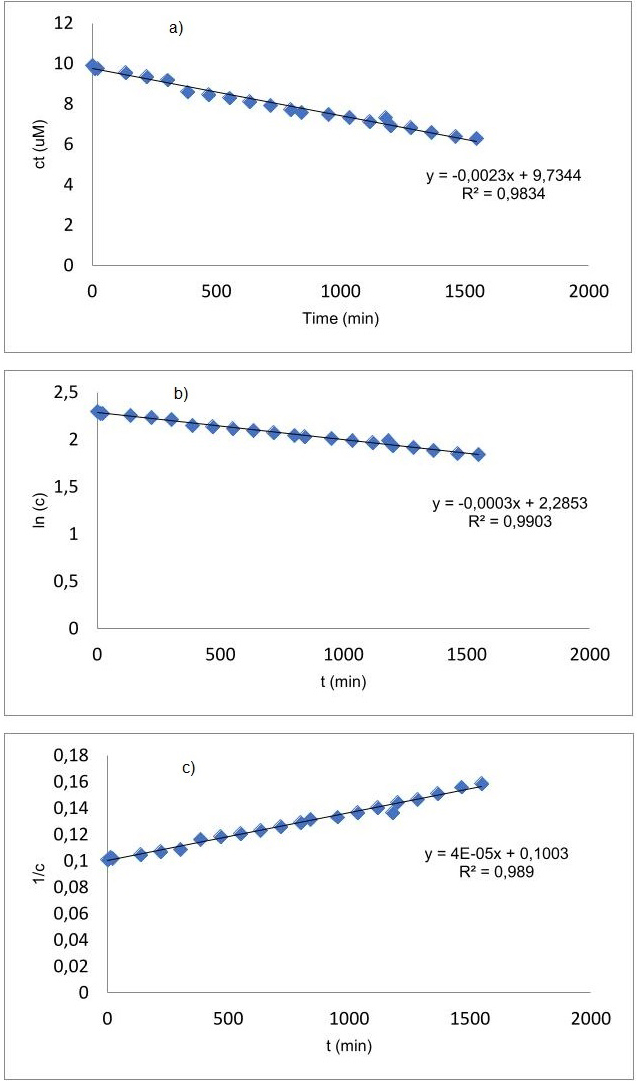
Previous studies have shown that thymoquinone (TQ) is susceptible to degradation in aqueous solutions, especially at an alkaline pH [19, 20]. To assess the stability of TQ under the proposed experimental conditions of TQ (HPLC, we evaluated its degradation kinetics, as shown in Fig. 8. The determination of the degradation kinetics was based on fitting the experimental data to different kinetic models (zero-order, first-order, and second-order). The quality of the fitting was assessed using the coefficient of determination (
The findings presented in this study are preliminary and were obtained under specific experimental conditions. To fully understand the degradation kinetics of TQ in various environmental conditions, more extensive studies are needed. However, our results provide valuable insight into the stability of TQ in RPMI-1640 medium under the experimental conditions tested.
TQ concentration in analyzed samples
TQ concentration in analyzed samples
aND – not detected.
NEMI pictograms’ description.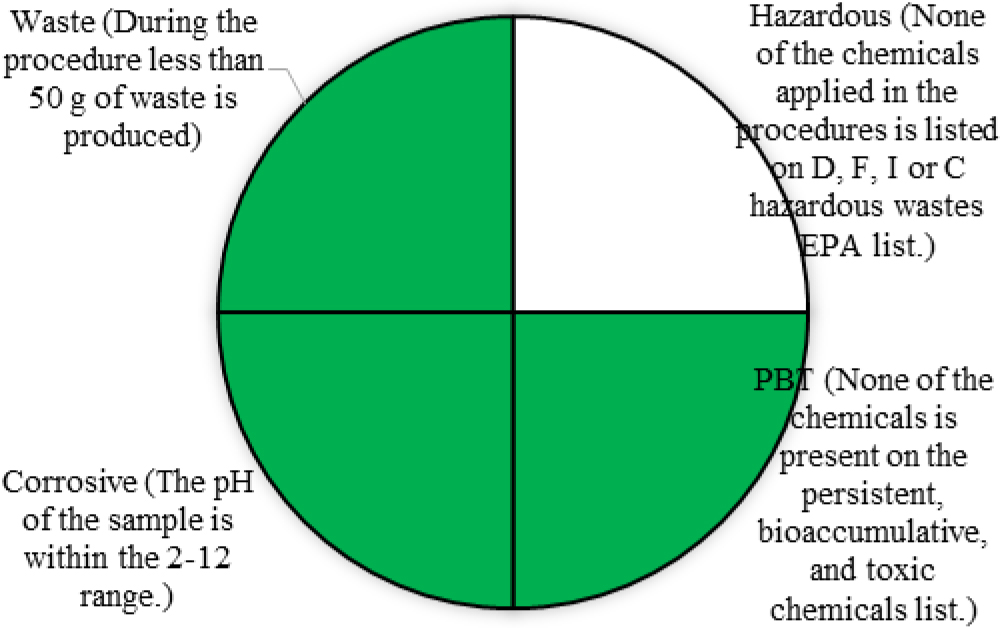
Table 9 shows the TQ concentrations in samples with cells in growth medium supplemented with serum (
National environmental methods index (NEMI)
The National Environmental Methods Index (NEMI) uses a pictogram with four quadrants to represent greenness. A method is greener if: a) reagents aren’t persistent, bio-accumulative, and toxic (PBT) by the Environment Protection Agency’s Toxic Release Inventory (EPA-TRI); [22] b) none of the chemicals applied in the procedure is listed on D, F, I or C hazardous wastes EPA list; [23] c) pH is between 2 and 12; d) waste is under 50 g. NEMI is qualitative, marking quadrants as meeting certain criteria. Our method, shows three green quadrants, indicating high greenness, as detailed in Fig. 9.
Conclusion
In conclusion, this manuscript highlights the significant achievements in developing and validating a high-performance liquid chromatography (HPLC) method for the direct determination of Thymoquinone (TQ) in cell cultures. The research successfully identified the optimal chromatographic conditions, notably using a 50:50 v/v mixture of acetonitrile and water, a column temperature of 30∘C, and a flow rate of 1 mL min - 1. This setup enabled the achievement of a sharp and symmetrical TQ peak at 6.5 minutes, with analytical detection at 254 nm.
The method validation was rigorous, adhering to the ICH Guideline and encompassing various parameters like specificity, sensitivity, linearity, accuracy, precision, and matrix effect. The validation process demonstrated that the method could reliably produce accurate and precise results, with the capability to detect and quantify TQ at low levels. The method’s sensitivity and linearity were particularly noteworthy, with the calibration curve showing a high correlation coefficient.
Furthermore, the study addressed TQ’s stability, a critical factor given its known susceptibility to degradation in aqueous solutions. The degradation kinetics of TQ in RPMI-1640 medium were assessed, revealing that TQ degradation follows first-order kinetics. This insight is crucial for understanding TQ’s behavior in various environmental conditions and its interaction with cellular components.
The application of this method in actual cell culture scenarios showed good reproducibility, though variations were observed when serum was added to the growth medium, suggesting possible binding of TQ to serum proteins or cellular components. These findings open avenues for further research to elucidate these interactions more clearly. The proposed method was found to be greener in terms of usage of persistent, bioaccumulative, and toxic chemicals and solvents, corrosive samples, and waste production.
Overall, this research makes a significant contribution to the accurate measurement of TQ in cell cultures.
Footnotes
Conflict of interest
None to report.