
Abstract
BACKGROUND:
The incidence of kidney tumors is progressively increasing each year. The precision of segmentation for kidney tumors is crucial for diagnosis and treatment.
OBJECTIVE:
To enhance accuracy and reduce manual involvement, propose a deep learning-based method for the automatic segmentation of kidneys and kidney tumors in CT images.
METHODS:
The proposed method comprises two parts: object detection and segmentation. We first use a model to detect the position of the kidney, then narrow the segmentation range, and finally use an attentional recurrent residual convolutional network for segmentation.
RESULTS:
Our model achieved a kidney dice score of 0.951 and a tumor dice score of 0.895 on the KiTS19 dataset. Experimental results show that our model significantly improves the accuracy of kidney and kidney tumor segmentation and outperforms other advanced methods.
CONCLUSION:
The proposed method provides an efficient and automatic solution for accurately segmenting kidneys and renal tumors on CT images. Additionally, this study can assist radiologists in assessing patients’ conditions and making informed treatment decisions.
Introduction
Kidney tumors are growths in the kidneys that can be benign or cancerous. Kidney cancer is one of the most common types of cancer, ranking third among the malignant tumors of the urinary system, after prostate cancer and bladder cancer [1]. According to the World Cancer Research Fund, there were 430,000 new cases reported in 2020 alone [2]. Early detection and treatment play a pivotal role in patient survival and recovery. However, the precision of segmentation is crucial for the accurate diagnosis and effective treatment [3]. Traditionally, tumors are manually delineated by experienced radiologists. This process is not only time-consuming and reliant on the radiologist’s expertise but is also prone to substantial variability between different observers and even within the same observer [4, 5].
Contrast-enhanced computed tomography (CT) is a widely adopted imaging technique that is highly sensitive and specific for detecting and diagnosing kidney tumors [6, 7, 8]. In the past few decades, several methods have been proposed to automatically segment kidney and tumors in CT images. Such automatic methods include region growing algorithms [9], thresholding methods [10], level set methods [11], random forests [12]. However, these methods rely on manual feature extraction, which still requires laborious manual correction in order to achieve accurate segmentation. Therefore, researchers have sought new automatic image segmentation methods that can overcome these challenges and achieve more robust and reliable results.
The latest technological advancements have seen the rise of deep learning-based methods as a dominant trend in kidney and kidney tumor segmentation [4]. Despite the positive outcomes achieved by many deep learning models [13, 14, 15], more precise segmentation is still needed, especially for kidney tumors. The shape and size of tumors vary greatly, and different cases may have different pathological subtypes, which increases the difficulty of the segmentation task [16]. Additionally, the fuzzy and unclear boundaries of tumors present a significant challenge for accurate segmentation. As shown in Fig. 1, the kidney tumor morphology of different pathological subtypes varies greatly.
CT images illustrating kidney tumors of distinct pathological subtypes. Yellow arrows indicate the tumor locations. Pathological subtypes include clear cell renal cell carcinoma in (a), papillary in (b), chromophobe in (c), and oncocytoma in (d).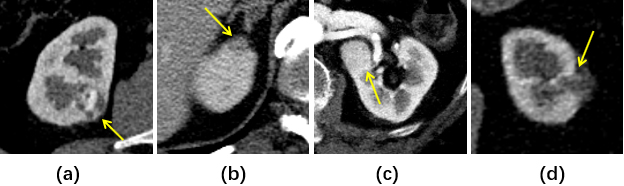
In this paper, we propose a two-stage deep learning framework for accurate CT image segmentation of kidneys and kidney tumors. The initial stage utilizes the You Only Look Once (YOLO) architecture to localize kidney regions, thereby narrowing the segmentation focus. Subsequently, a U-Net-based network processes the localized kidney images to generate precise segments for both kidneys and tumors. Our method, integrating YOLO for localization and U-Net for segmentation, provides an effective and automatic solution. We then compare its performance against several state-of-the-art methods in the field.
We initiated the process with preprocessing steps applied to enhance the kidney region in all CT images. Subsequently, the YOLOv5 object detection algorithm was employed in the second step to automatically identify the kidney portion within each image. The identified section was then cropped into a Region of Interest (ROI) using the network’s output, which provided bounding box coordinates. The resulting cropped ROI served as input for the subsequent stage – a network designed for kidney and kidney tumor segmentation. Figure 2 illustrates an overview of our method’s workflow, with detailed explanations for each step provided in the following sections.
Overview of the proposed framework.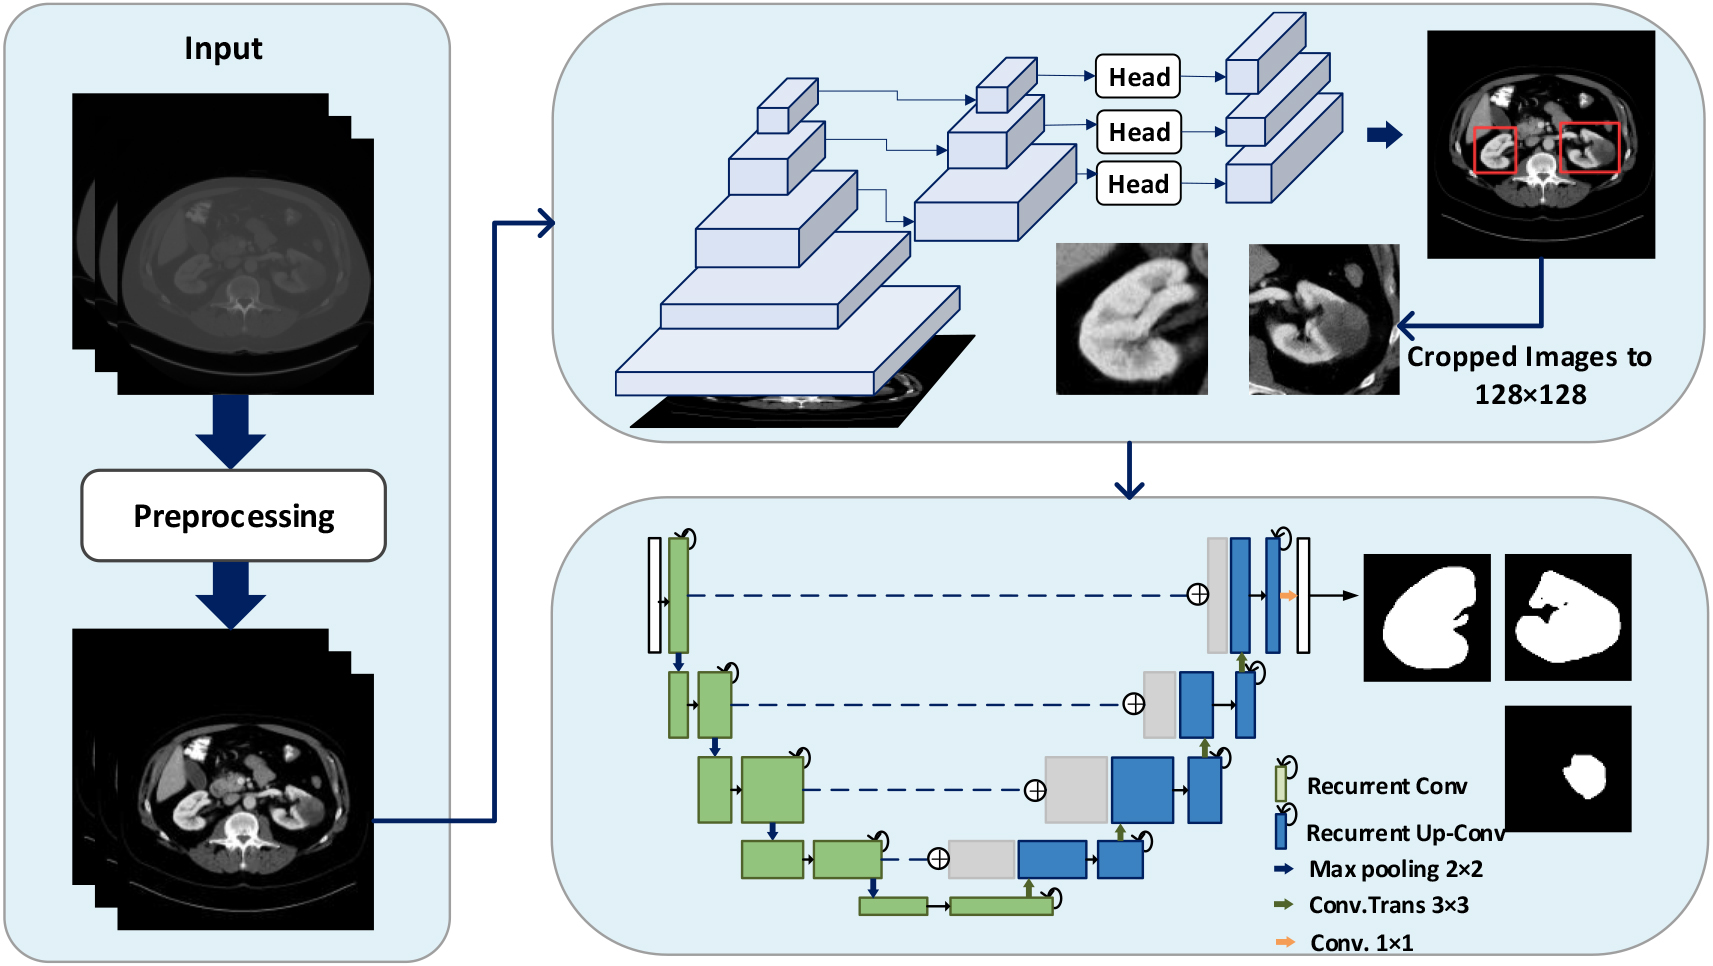
We chose the publicly available KiTS19 dataset for both qualitative and quantitative analyses. This dataset comprises pre-arterial phase abdominal CT images from 300 patients who had one or more kidney tumors and underwent partial or radical nephrectomy. The dataset covers various subtypes of kidney tumors, such as clear cell renal cell carcinoma, papillary renal cell carcinoma, chromophobe renal cell carcinoma, and others. The CT volumes, containing both images and masks, were initially provided in NIFTI format with a size of 512
Data preprocessing
To enhance uniformity, the CT images underwent resampling through three spline interpolations, resulting in images with uniform 1
Kidney localization
After preprocessing, we transformed CT volumes into slices in PNG format. The segmentation labels were then transformed into YOLO format, incorporating the bounding box center coordinates and the box’s relative dimensions for each CT slice. A YOLO model was subsequently trained to narrow down the segmentation region and area, aiming to identify and crop the CT slice to focus on the kidneys. The YOLOv5 architecture, illustrated in Fig. 3, comprises three key components: the backbone, neck, and head. Utilizing CSPDarknet as the backbone enhances the model’s learning capability and accelerates the feature extraction process. The C3 component augments the channel number and feature map expression. PANet serves as the neck for feature fusion, transmitting information to the head for prediction. The head predicts image features, employing anchor boxes to generate multiple-scale feature maps. Each map contains coordinate positions, confidence scores, and class probabilities of anchor boxes in the respective grid cell.
The architecture of the YOLOv5 (Focus using a slicing operation and a convolution operation. C3 contains 3 convolution layers and a series of bottleneck layers. SPP is a spatial pyramid pooling).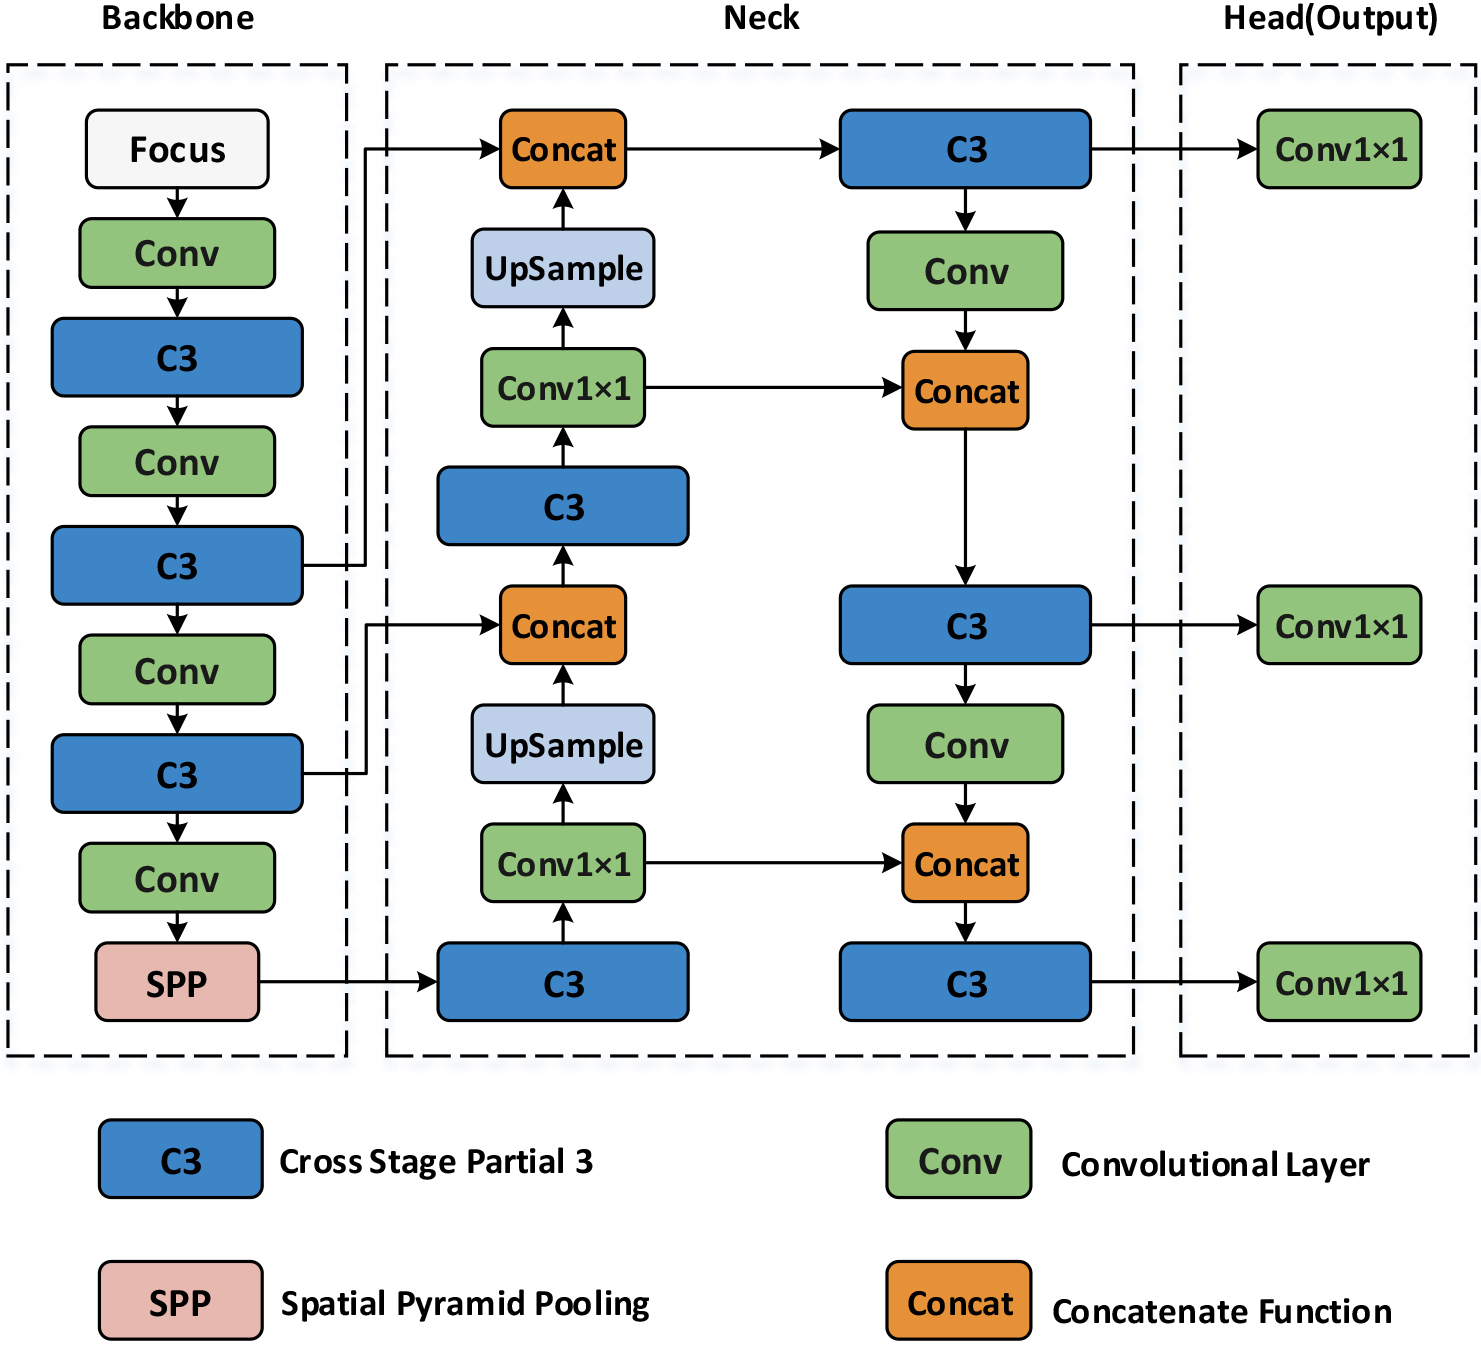
During testing, the trained YOLO model processes each CT slice to determine the image contained kidney. The results shown two types of prediction errors: failure to detect kidneys in a slice that contains them and incorrectly identifying non-kidney parts as kidneys in slices without kidneys. As shown in Fig. 3, incorrect detections can disrupt the continuity of kidneys in three-dimensional space. In (a), the CT volume is displayed, where 0 and 1 represent slices without and with kidneys, respectively. In (b), blue boxes represent correctly detected slices with kidneys, while red boxes represent incorrect detections. Although the kidney range has been reduced, the missing kidney slices remain a problem.
To address these wrong predictions, we implemented postprocessing on the final results. We identified the first and last CT slices with kidneys in each case and filled the entire internal range as the kidney range, as shown in (c). While this may increase the possibility of falsely identifying slices originally recognized as non-kidney slices as having kidneys, such have a smaller impact on subsequent segmentation compared to the other type of error, and many kidney slices have been restored. This method is employed to automatically detect and narrow down the range for each CT volume.
Postprocessing for kidney detection in CT slices.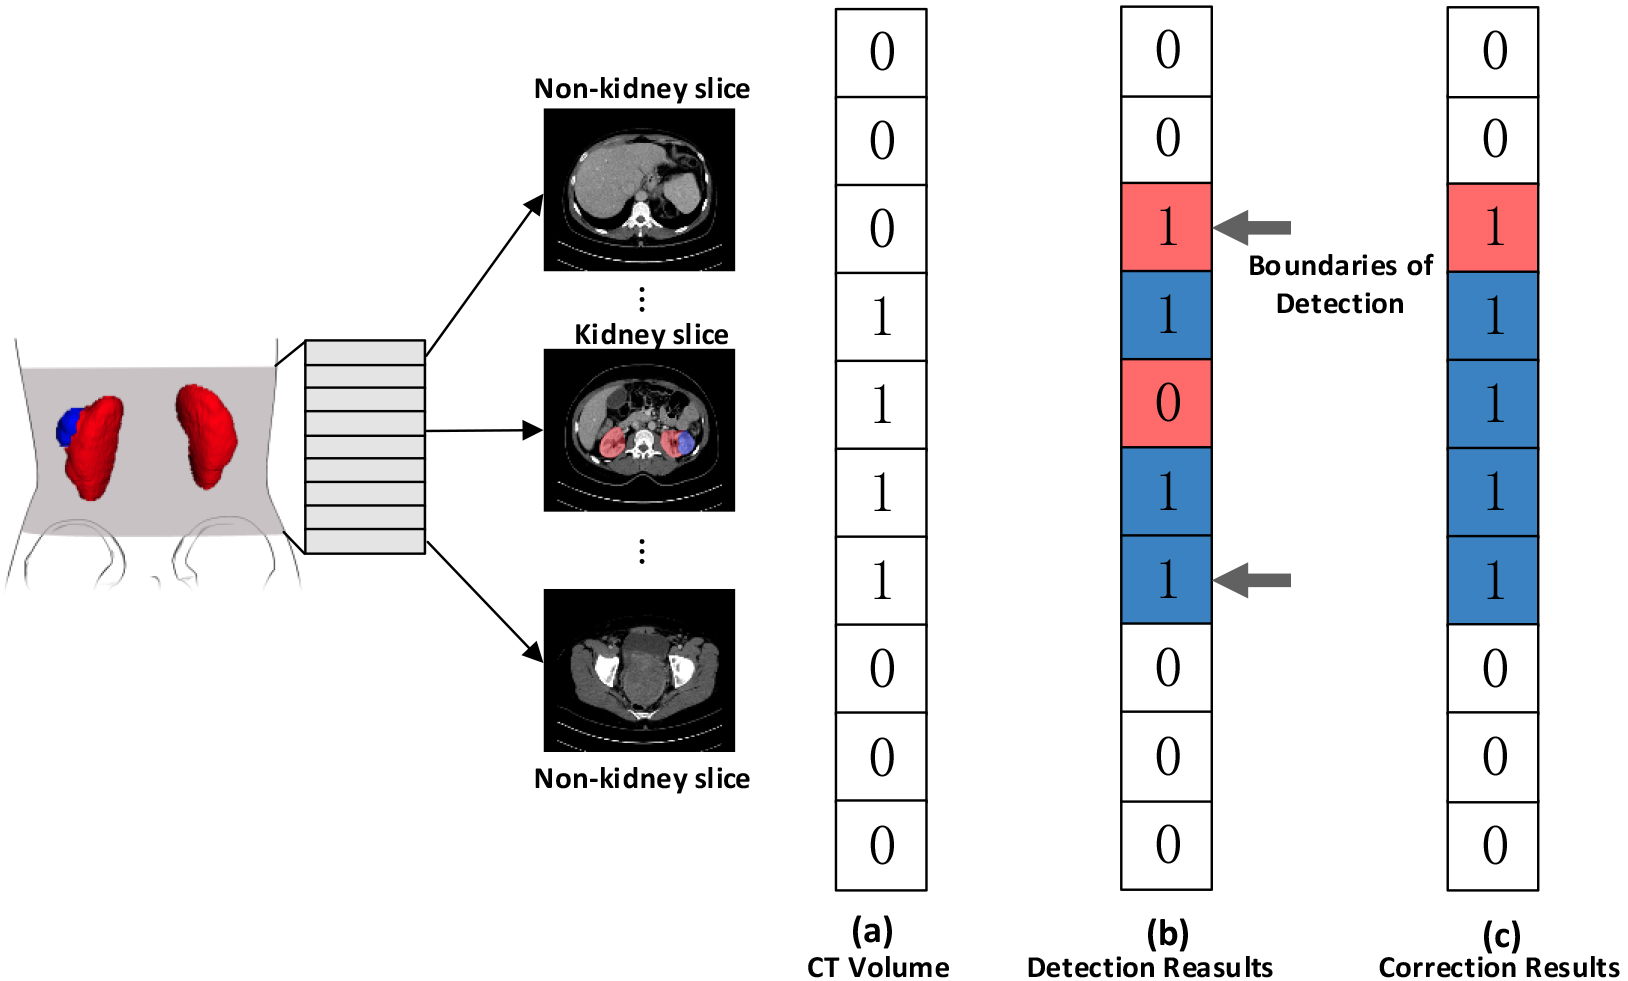
Our approach uses the Attention Recurrent Residual Convolutional Neural Network (R2AU-Net) proposed by Zuo et al. [17], for segmenting kidney and kidney tumor. The R2AU-Net structure based on U-Net integrates the recurrent residual blocks, replacing the traditional Convolutional Layer and Rectified Linear Unit layer. Its ability to capture complex features through a skip connection that propagates information across multiple convolutional layers. The residual block achieves a skip connection by adding the original input to the output, effectively addressing the vanishing gradient issue in deep neural networks. This design enhances convergence speed and overall accuracy. The mapping function of the residual block involves operations such as convolution and activation, facilitating easier weight adjustment during backpropagation. The introduction of attention gates generates a gate signal to control the importance of different region features in the input feature maps. This adaptive attention mechanism is learned during training, making the network particularly effective for medical image segmentation tasks that demand advanced semantic understanding. Figure 5 illustrates the network structure of R2AU-Net.
Model training and evaluation
To improve the model’s generalization and robustness, real-time data augmentation was applied directly to the training set before segmentation, as detailed in Table 1. In our approach, we utilized eight data augmentation operations, with five based on probability. Input images underwent random rotations within the range of [
Data augmentation parameters
Data augmentation parameters
Overall architecture of R2AU-Net.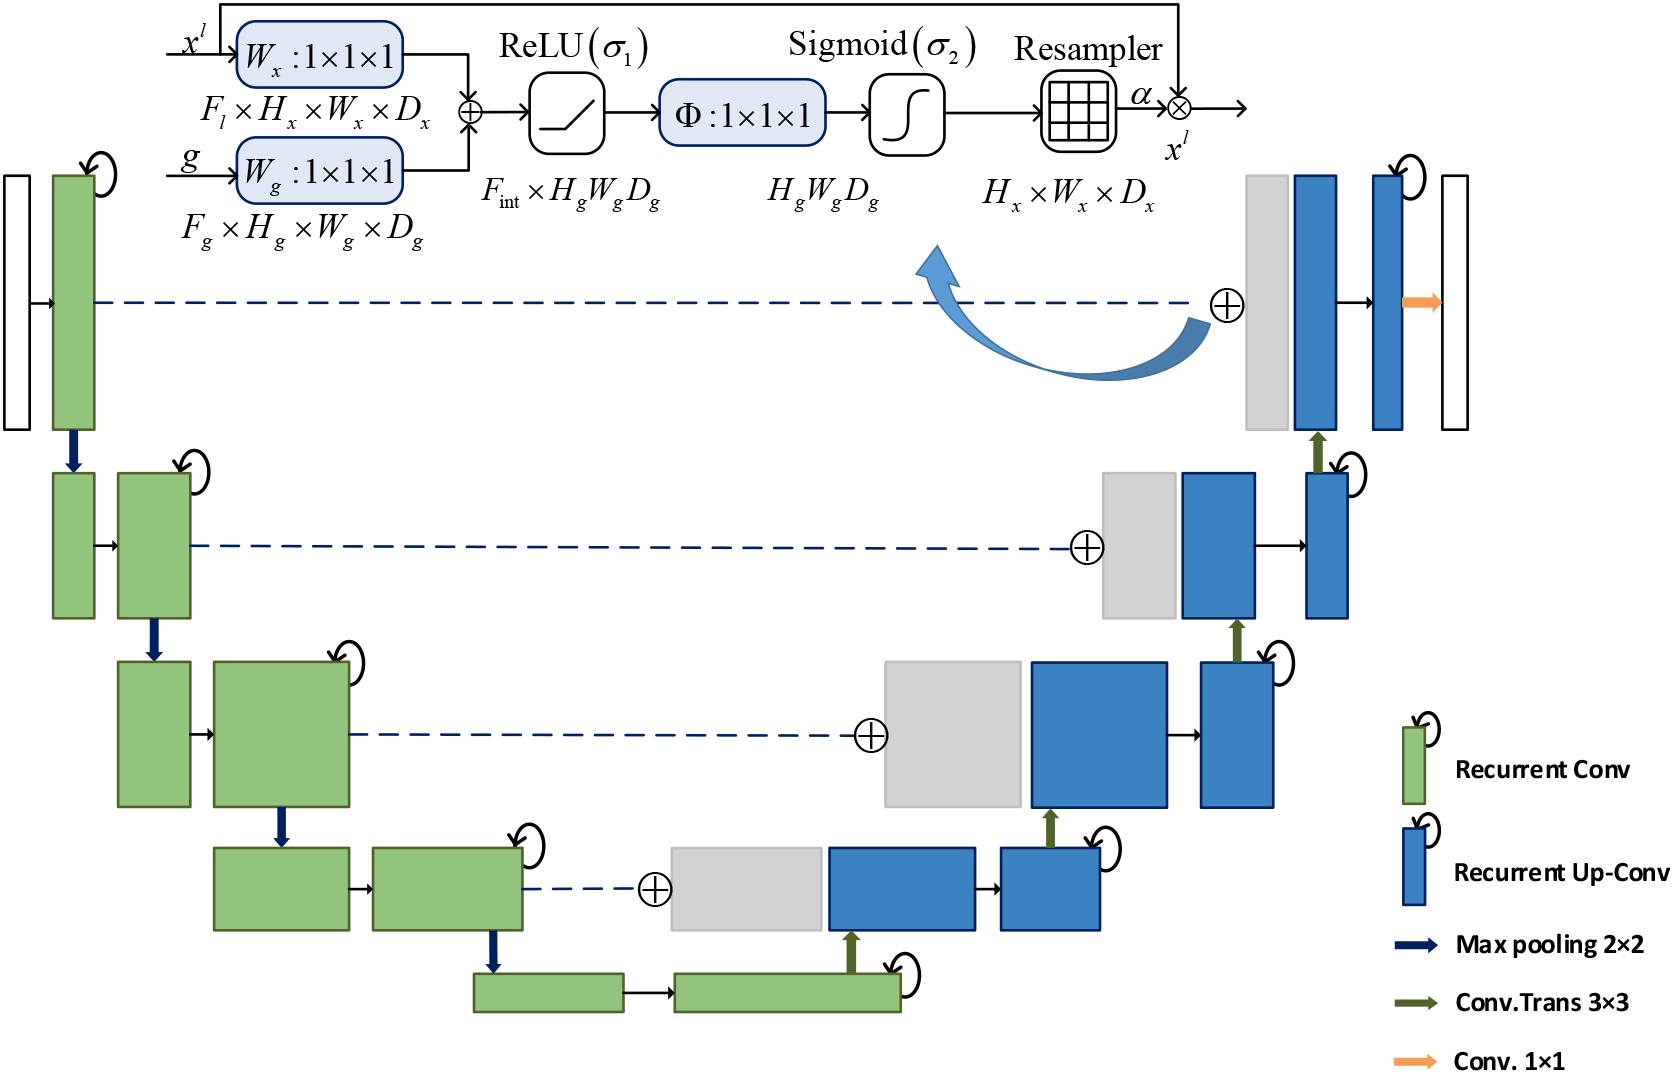
The segmentation model was implemented using Python 3.7 and PyTorch 1.8, and it ran on a Tesla V100 PCIe 16 GB system with 12 GB of memory. The model underwent iterative experiments for hyperparameter tuning on our dataset. Optimization utilized the Adam optimizer, starting with an initial learning rate of 1e-3, which then decreased to 1e-4 after the 60th epoch. A total of 200 epochs were trained with a batch size of 8.
We evaluated the performance of the segmentation model using six quantitative metrics, with the dice coefficient serving as our primary evaluation metric. The dice coefficient is a commonly used statistical measure to assess the similarity between two sets of data. Widely adopted in medical image segmentation, it gauges the accuracy of a segmentation model. The other metrics include Jaccard, accuracy, sensitivity, specificity, and precision, defined as follows:
The dice coefficient ranges from 0 to 1, with 1 indicating a perfect overlap between the ground truth and predicted segmentation masks. In Eqs (1) and (2), where
In Eqs (3)–(6), TP represents the part of the kidney that is correctly predicted, FP represents that the background is predicted as the kidney, FN represents that the kidney is predicted as the background, and TN represents the background that is correctly predicted as the background. The accuracy measures the proportion of correctly classified pixels in the predicted segmentation mask. The sensitivity measures the proportion of true positive pixels that are correctly classified as positive, while the specificity measures the proportion of true negative pixels that are correctly classified as negative. The precision measures the proportion of true positive pixels in the predicted segmentation mask. Overall, these metrics provide a comprehensive evaluation of the performance of the proposed and compared methods.
Statistical analysis was performed using the scipy library in Python. The quantitative segmentation results were presented as mean
Results
Results of kidney localization
We employed the trained YOLO model, which using the stochastic gradient descent optimization algorithm with a fixed learning rate of 0.01, and training was stopped at 400 epochs once the model had converged. To assess the detection performance, we compared the results to the ground truth and calculated the mean Average Precision (mAP). The accuracy of object detection is typically determined by the Intersection over Union (IoU) threshold used in mAP calculation.
The detection results for kidneys are presented in Fig. 6, and the model achieved a high mAP score of 0.9953 with an IoU threshold of 0.5, indicating its effectiveness in accurately detecting objects. In addition, we analyzed the mAP of the model for various IoU thresholds ranging from 0.5 to 0.95, with a step size of 0.05. The average value of the model’s mAP remained high across all thresholds, indicating its robustness and ability to perform well under different conditions.
Results of kidney and tumor segmentation
Table 2 presents a comparison between the results obtained in our study and those from other research works focusing on kidney and kidney tumor segmentation. In order to compare the consistency of the studies, we selected studies that also used the same data set.
The results of comparison between our proposed method and state-of-the-art methods
The results of comparison between our proposed method and state-of-the-art methods
For the training process, (a) and (b) show the trends of precision and recall, respectively, both of which reach 0.98 and 0.97. (c) shows the value of mAP at an IoU threshold of 0.5, and (d) shows the average value of the model’s mAP as the IoU threshold varies from 0.5 to 0.95 with step size of 0.05.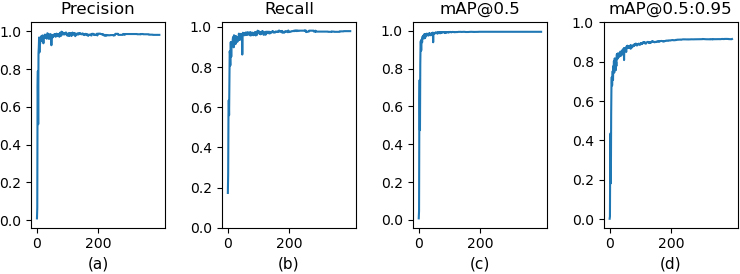
Figure 7 shows the original images and masks used in our model, as well as the results of kidney and tumor segmentation. It can be seen that for the segmentation of tumors with blurred boundaries, our model can generally segment them completely with small errors at the edges, as shown in the second row of the example.
To evaluate the effectiveness of the proposed method, ablation experiments were conducted using the same dataset and evaluation metrics as in previous experiments to maintain consistency. Firstly, segmentation experiments were performed separately using the U-Net and R2AU-Net. Subsequently, the trained YOLO model for kidney localization was integrated with both U-Net and R2AU-Net segmentation networks, resulting in the U-Net-YOLO and R2AU-YOLO methods. Figure 8 displays the overlay of the segmentation results of the proposed R2AU-YOLO method onto the original images, contrasting with the results of the other three methods.
Quantitative results of kidney segmentation using our method and other methods
Quantitative results of kidney segmentation using our method and other methods
All values are described as means
Kidney and tumor segmentation results. (a) CT images, (b) ground truth, (c) result of localization, (d) result of segmentation, (e) visualization of segmentation results.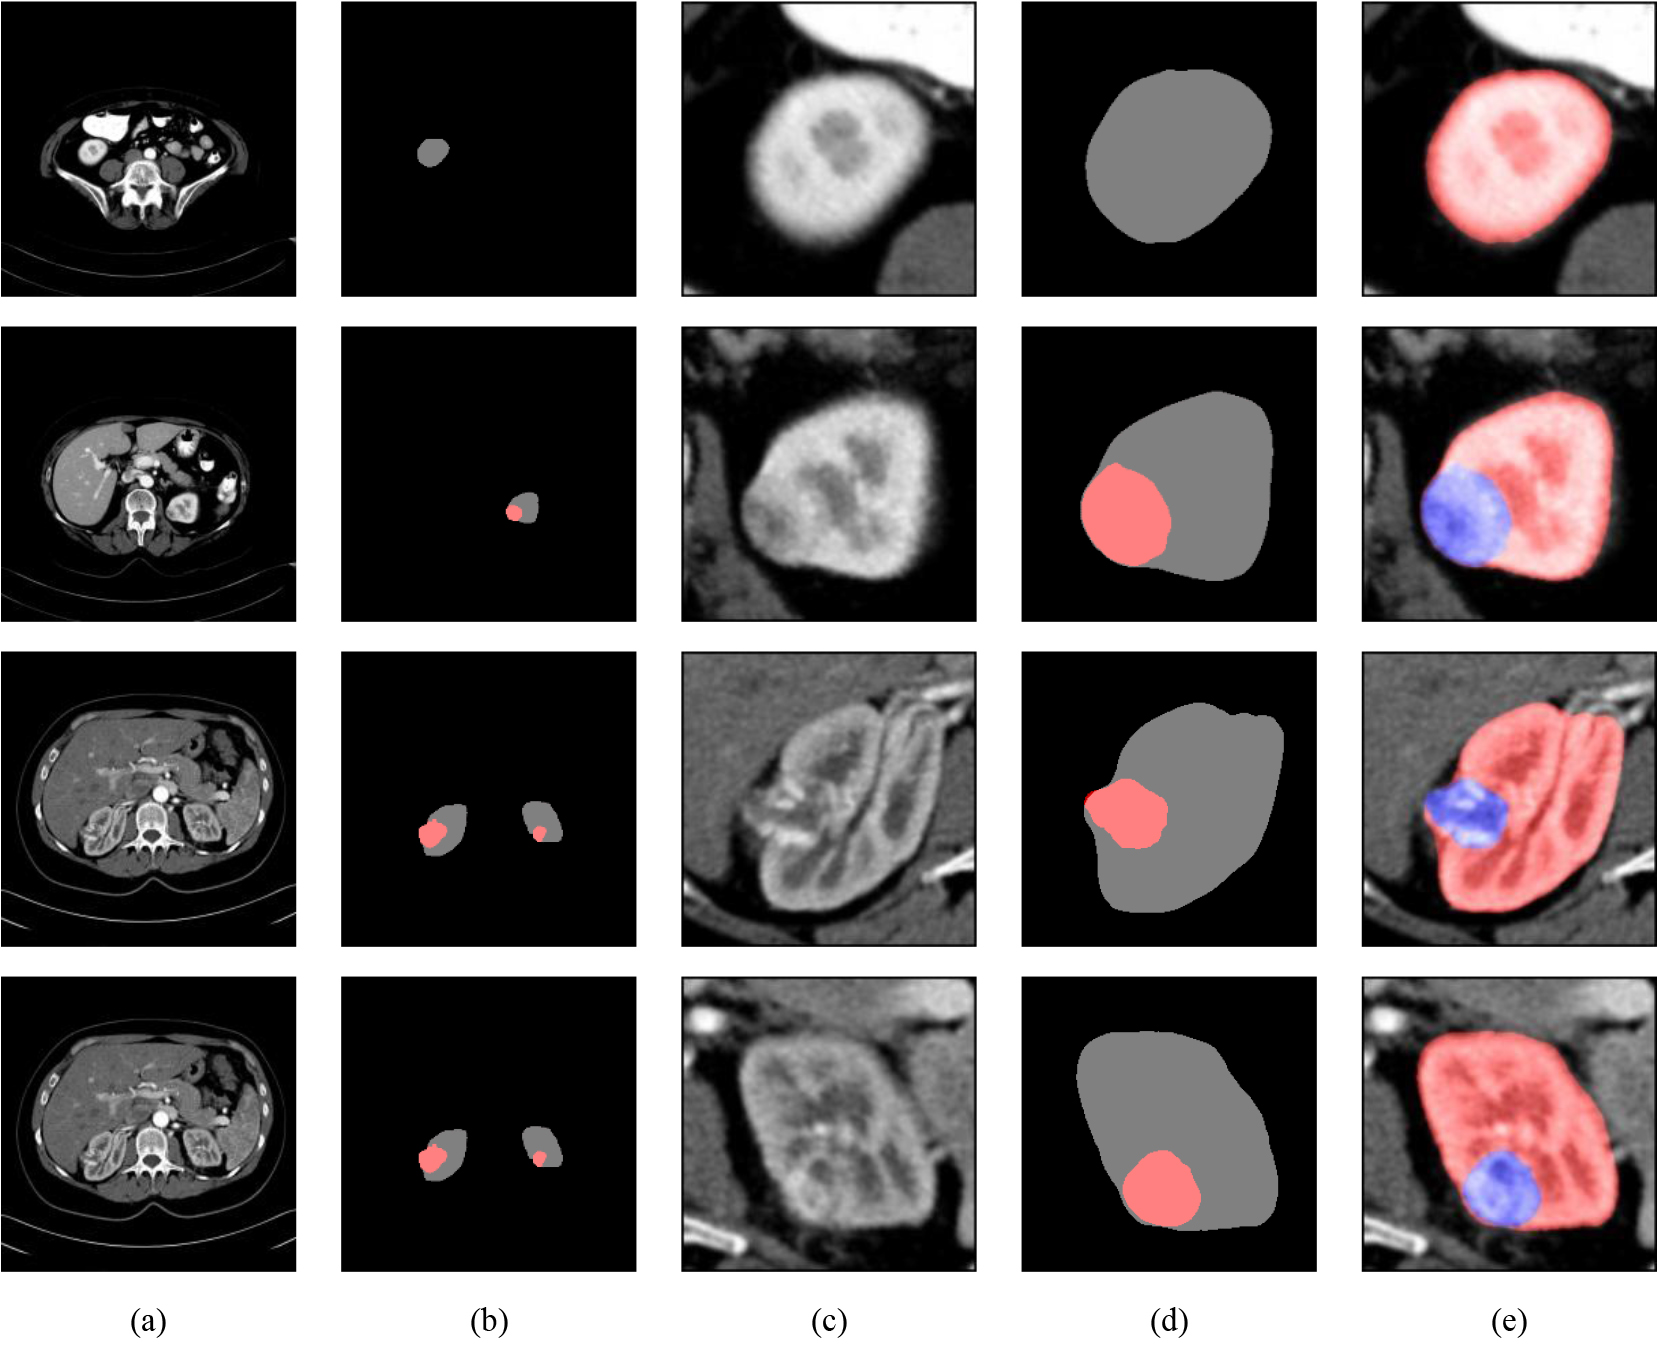
Quantitative results of kidney tumor segmentation using our method and other methods
All values are described as means
The segmentation results of different models. Origin: Original images. GT: The ground truth of the images.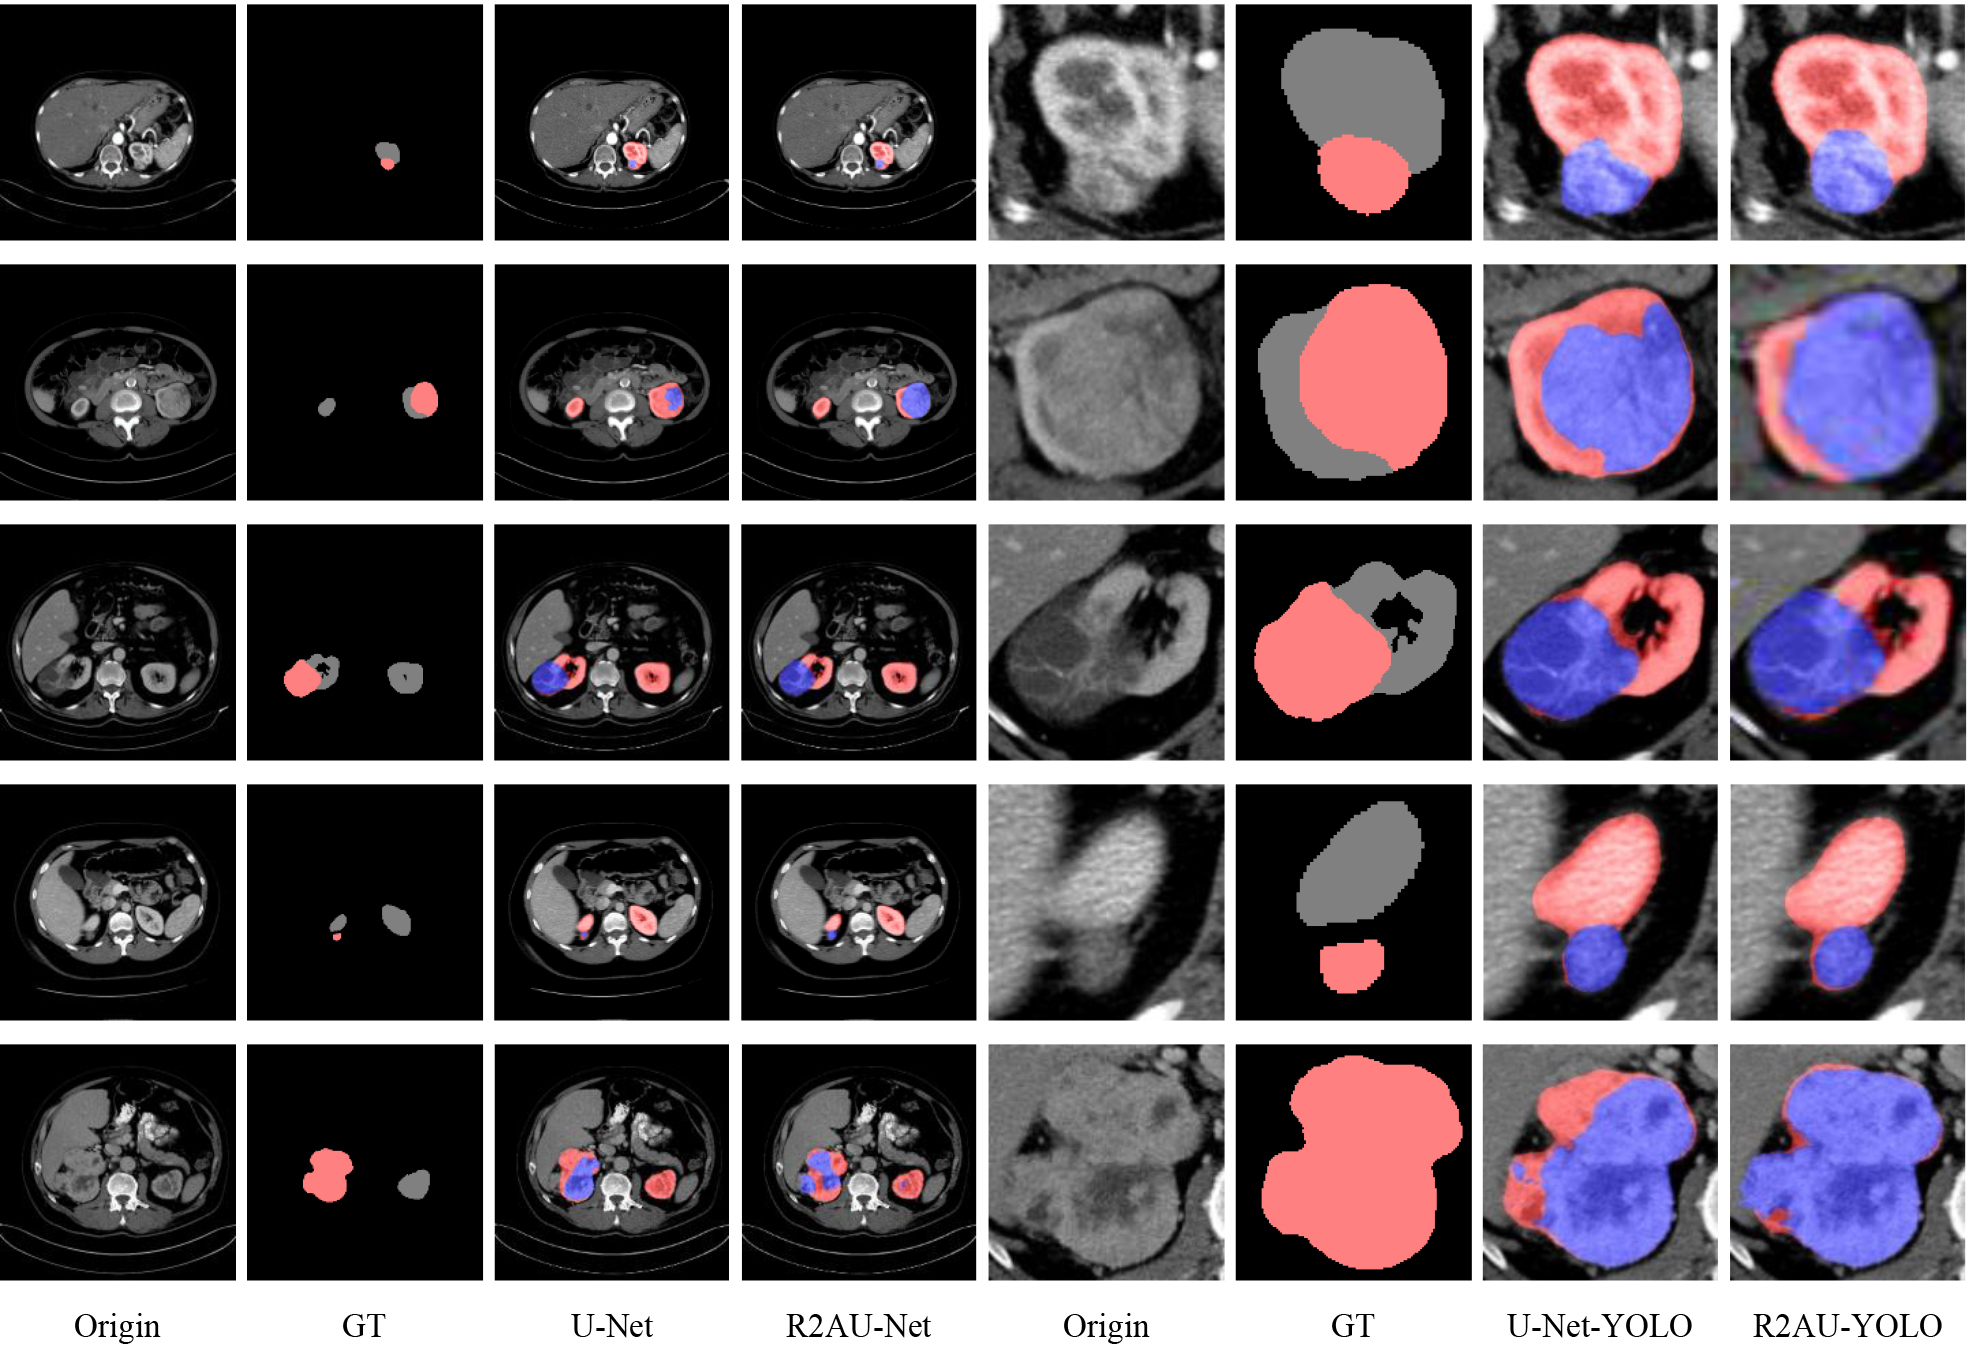
Additionally, we present the quantitative results of above methods in Tables 3 and 4. For kidney segmentation tasks, the R2AU-YOLO method achieved a dice coefficient of 0.951
The dice coefficient of R2AU-YOLO for segmenting kidney tumors is 0.895
Segmentation of kidney tumors poses a significant challenge, primarily due to their small size relative to the surrounding background. Our experimental results indicate that incorporating YOLO for kidney localization is more effective than training segmentation networks independently. By separating the kidney region from the rest of the image, our proposed method allows the segmentation network to focus on kidney and tumor relevant features, leading to more accurate segmentation results.
Significance test of dice coefficients for segmentation between R2AU-YOLO and other methods
Comparison of computational efficiency metrics for several methods
We conducted a detailed analysis of the computational efficiency between two-stage and one-stage methods, encompassing metrics such as average inference time per image, FLOPs (floating-point operations), and parameter counts as shown in Table 6. The traditional U-Net method exhibited an inference time of approximately 6.05 ms, with around 16.38 G FLOPs and roughly 34.53 M parameters. In contrast, the R2AU-Net method showed a noticeable increase in inference time to about 26.78 ms, with FLOPs rising to around 49.41 G and parameters slightly increasing to approximately 39.44 M. On the other hand, the YOLO method demonstrated lower inference time during kidney detection, along with relatively lower FLOPs and parameter counts. In summary, the serial time of two-stage methods exceeded that of one-stage methods by approximately 7.88 ms. Although the R2AU-YOLO method adds some computational costs to the inference process, in practical applications, the inference time delay introduced by this small computational cost increase may have little impact on the user experience, especially considering the efficiency and speed advantages of the R2AU-YOLO method over the manual segmentation method.
Many researchers have attempted to use CNN for kidney and kidney tumor segmentation [26, 27, 28], due to its superior performance over traditional computer vision techniques and alternative models. Mehedi et al. [29] employed UNet and SegNet for automated kidney segmentation, achieving dice coefficients of 0.54 and 0.32, respectively. However, during the preprocessing stage, manual annotation of kidney boundaries was required. Kittipongdaja et al. [30] used 2.5D ResUNet and 2.5D DenseUNet to segment kidneys and achieved high mean dice scores of at least 0.95 on a public dataset. They also tested their models on CT images of four Thai patients, achieving a best mean dice score of 0.876. Efremova et al. [31] employed the LinkNet-34 deep learning model and a transfer learning strategy to enhance accuracy and reliability. Ruan et al. [32] primarily concentrate on the feature map located at the bottom of the network. It helps to improve the network’s performance by extracting and combining multi-scale information. Shan et al. [33] used a fully convolutional generator network combining multi-scale feature extraction, to segment kidney on the KiTS19 dataset, and finally achieved 0.9228 dice score. The above studies have attempted to segment kidneys and kidney tumors directly from CT images.
Our experimental results indicate that R2AU-YOLO exhibits the highest dice, Jaccard, and precision in kidney segmentation when compared to other methods, aligning with its performance in kidney tumor segmentation. This suggests a consistent and stable performance across both tasks. However, its lower accuracy and specificity indicate potential misclassification of non-target regions, resulting in instances of over-segmentation. This phenomenon is further evidenced in the visualization results, where areas incorrectly labeled as target regions contribute to this excessive segmentation. Conversely, U-Net and R2AU-Net demonstrate the highest accuracy and specificity in segmentation tasks. This reflects their proficiency in accurately identifying non-target regions and ensuring correct segmentation of background areas in the results. However, upon visual inspection of the segmentation results, it becomes evident that both methods occasionally fail to fully capture the boundaries of target regions. This results in some regions being incorrectly classified as background, leading to instances of under-segmentation and consequently contributing to the overall lower dice coefficient.
In our approach, kidney localization precedes the segmentation of kidneys and tumors in CT images, addressing the challenge of imbalanced foreground/background segmentation. When comparing our findings with other kidney segmentation studies utilizing the KiTS19 dataset, it is noticeable that the tumor dice coefficients are notably lower than those for kidneys. This discrepancy can be attributed to the irregular shape and indistinct boundaries of tumors, posing challenges for accurate segmentation. Nonetheless, our approach demonstrates success in identifying kidney tumors, highlighting their potential clinical relevance.
One significant advantage of our method lies in the automation of the segmentation process. By harnessing CNNs, researchers can attain precise and dependable segmentation outcomes without extensive manual annotation. This automation not only reduces the time and labor required for segmentation tasks but also streamlines the workflow for radiologists and clinicians. Furthermore, discussing the real-world applicability of these segmentation techniques is crucial for assessing their translational potential. Although research studies often showcase promising results in controlled environments, their effectiveness in real-world clinical settings may vary. Various factors, including variability in imaging protocols, patient demographics, and disease characteristics, can influence the performance of segmentation models in practical scenarios. Hence, future research endeavors should prioritize validating these models across diverse clinical settings and populations to ensure their robustness and generalizability.
Conclusion
In this study, we present an automated method for the segmentation of kidneys and kidney tumors, which greatly reduces the need for manual intervention in the phrases of ROI selection, post-processing and segmentation. Experimental results show the high accuracy and robustness of our proposed method in handling kidney and tumor segmentation tasks. Moving forward, we believe that our work can lay the foundation for the development of more advanced AI-driven diagnostic strategies in the field of kidney diseases. These strategies could have a significant impact on patient outcomes and overall healthcare. Our future work aims to validate and optimize our proposed method and explore its applicability in clinical practice.
Footnotes
Conflict of interest
The authors declare that there is no conflict of interest.
Funding
This study received support from the National Natural Science Foundation of China (Grant numbers: 62106233, 62303427, and 82370513), the Henan Science and Technology Development Plan (Grant numbers: 232102210010, 232102210062, and 222102210219), the Young Teacher Foundation of Henan Province (Grant number: 2021GGJS093), and the Doctor Natural Science Foundation of Zhengzhou University of Light Industry (Grant number: 2022BSJJZK13).