



Abstract
BACKGROUND:
The left ventricle segmentation (LVS) is crucial to the assessment of cardiac function. Globally, cardiovascular disease accounts for the majority of deaths, posing a significant health threat. In recent years, LVS has gained important attention due to its ability to measure vital parameters such as myocardial mass, end-diastolic volume, and ejection fraction. Medical professionals realize that manually segmenting data to evaluate these processes takes a lot of time, effort when diagnosing heart diseases. Yet, manually segmenting these images is labour-intensive and may reduce diagnostic accuracy.
OBJECTIVE/METHODS:
This paper, propose a combination of different deep neural networks for semantic segmentation of the left ventricle based on Tri-Convolutional Networks (Tri-ConvNets) to obtain highly accurate segmentation. CMRI images are initially pre-processed to remove noise artefacts and enhance image quality, then ROI-based extraction is done in three stages to accurately identify the LV. The extracted features are given as input to three different deep learning structures for segmenting the LV in an efficient way. The contour edges are processed in the standard ConvNet, the contour points are processed using Fully ConvNet and finally the noise free images are converted into patches to perform pixel-wise operations in ConvNets.
RESULTS/CONCLUSIONS:
The proposed Tri-ConvNets model achieves the Jaccard indices of 0.9491
Introduction
The heart serves as the powerhouse for the human circulatory system and stands as a crucial organ within the human body. Heart disease significantly impacts human well-being and longevity, with coronary heart disease (CHD) ranking among the foremost global causes of mortality [1]. Consequently, comprehending the operational mechanisms and attributes of the heart becomes pivotal in advancing the prevention and action of heart ailments. Medical scanners have advanced rapidly in recent years. For example, multi-slice cardiac CT, cardiac magnetic resonance imaging (MRI), and three-dimensional ultrasound scans and single-dimensional heart scans in cardiac image analysis [2, 3].
Cardiac ultrasound images play a crucial role in evaluating physiological indicators of the heart and diagnosing conditions utilizing deep learning [4]. The ease of operation, reliability, and practicality of cardiac ultrasound technology make it a potent non-invasive method for conducting comprehensive assessments of cardiac function. The systemic blood supply is managed by the left ventricle. Acquiring measurements such as left ventricular end-diastolic volume, left ventricular end-systolic volume, left ventricular ejection fractions, and stroke volume aids in comprehending alterations in the left ventricle [5, 6]. This process supports the establishment of a measurable approach to prevent and address heart ailments, thereby mitigating the risks and mortality associated with cardiovascular ailments. The pivotal point of the heart is the left ventricle, and signs associated with it play a crucial role in diagnosing heart disease [7]. Therefore, obtaining precise information is essential for subsequent prognosis. However, the morphology of the left ventricle varies across these views, necessitating the classification of these views and subsequent left ventricle detection. This detection process significantly reduces the time doctors spend searching for pertinent information within extensive echocardiographic data [8, 9]. Manual description is a time-consuming process and susceptible to both individual observers and between different observers. Depending on the LV segments using short-axis MRI scans, left ventricular medical variables are commonly gathered [10]. Medical professionals find that manually segmenting data to evaluate these functions takes a lot of time and effort when diagnosing heart diseases. Nevertheless, segmenting these images repeatedly by hand reduce the reliability of the diagnosis [11]. For this reason, a fully computerized method is needed to help clinicians perform more effectively. In this paper, we propose a combination of different deep neural networks for semantic LV segmentation based on Tri Convolutional Networks (ConvNets) to obtain highly accurate segmentation. By employing advanced DL models such as CNN [12], LSTM [13], YOLO [14] and so on contribute to detecting different types of diseases. The key contribution of the proposed model is as follows.
Initially, the CMRI images are pre-processed to remove the sound artefacts and enhance the image quality. The RoI based extraction is carried out in three different stages to accurately identify the LV in noise free CMRI. The initial phase is to generate a bounding box on LV, then cover up the contour edges of LV with canny edge detector and finally the contour points are marked with the mask thresholding. Then, the extracted features are given as an input to the three different deep learning structures for segmenting the LV in the efficient way. Although a Transformer is utilized for extracting broad features from cardiac MR images, Tri-ConvNets gather fine-grained details and coarse-grained semantics from entire levels. Afterwards, the contour edges are processed in the standard ConvNet, the contour points are processed using Fully ConvNet and finally the noise free images are converted into patches to perform the pixel-wise operation in ConvNets. Finally, the three ConvNets performs different operations to give different segmentation results and these results concatenate to calculate the circular similarity for attaining better LV segmentation output.
The remaining portion of the study is planned in the subsequent way: The relevant literature is thoroughly reviewed in Chapter 2, the Tri-ConvNets that are suggested for LV segmentation are explained in depth in Chapter 3, and the trial results and comments are presented in Chapter 4 and discussed in Chapter 5. The work is concluded in Chapter 6, which also suggests directions for further study.
Literature survey
Diagnosing coronary artery disease requires examining operational heart parameters such as regional indexes, ejection function, and end-systolic volume sector. Recently, there has been a lot of interest in the segmentation of the left ventricle using cardiac magnetic resonance imaging as an initial phase towards this goal. To determine the exact position of the LV, a number of computer vision techniques based on artificial intelligence have been widely employed.
In 2019 Hsu et al. [15] presented quicker active shape model and region-based convolutional neural network for automatically identify, track, and segment the LV in cardiac illustration patterns. An enhanced adaptive anisotropic diffusion filter to efficiently strengthen image outlines and lower noise. An LV detection rate of 0.88% is achieved during the segmentation process.
In 2019 Hu et al. [16] suggested robust algorithm to increase the coronary MRI’s automated LV segmentation speed. The key techniques are developed in this segmentation algorithm are CNN coarse segmentation of LV images and ROI extraction. Using the SegNet method, the Jaccard indexes and epicardial contours are 0.80 and 0.76. The diverse sources of image variability can hinder analysis, making the assessment of extreme slice images challenging due to unexpected variances.
In 2020 Amer et al. [17] recommended dL framework ResDUnet, a U-net-based system with the dilated convolution united, is utilized. To address the issue of variation in LV dimensions and forms, incorporate a map of features produced by cascaded dilation into U-net’s data synthesis procedure. The proposed model shows a dice similarity at 0.951% for the LV segmentation.
In 2020 Yang et al., [18] recommended using RetinaNet for Multiview echocardiography to recognize A2C, A3C, and A4C visuals and locate the LV. The LV recognition efficiency is measured and the mIOU metrics for A2C, A3C, and A4C are 0.858, 0.794, and 0.838, correspondingly. The feature pyramid network (FPN), is utilized for the classification task.
In 2020 Wu et al. [19] established the CNN to find the ROI and the U-net networks for splitting the LV. using the cardiac MRI data from the MICCAI 2009 LV segment model testing and training. The measurements include Hausdorff distance (HD), volumetric overlap error (VOE), and dice metric (DM), with values of 3.641, 0.053, and 0.951, respectively.
In 2020 Leclerc et al., [20] planned LU-Net to enhance 2D echocardiogram segmentation. The CAMUS dataset is used in the study, and the images are hand chosen ROIs centered on the segmentation masks of guidance. The related images were trimmed from these ROIs to generate fresh data that were analyzed using the standard U-Net structure. Additionally, the technique analyses the left ventricular end-diastolic and end-systolic amounts, resulting in a mean correlation of 0.96 and a mean absolute error of 7.6 ml.
In 2020 Abdeltawab et al. [21] offered a deep learning method for the automatic measurement and segmentation of the left ventricle from cardiac cine magnetic resonance data. FCN design is used for the LV blood pool centre-point’s dependable localization. The LV cavity and myocardium are then segmented using a ROI. The framework was validated using the ACDC-2017 dataset, yielding improved recognition and precise estimate of cardiac factors. The proposed model shows a dice similarity at 98.13% for the LV segmentation.
Schematic illustration of the proposed Tri-ConvNets model.
In 2021 Amer et al. [22] proposed a fully computerized approach for LV segmentation that manages the LV margins and form variations while accurately delineating the ventricle boundaries. ResDUnet, has been developed using the U-net architecture. By integrating cascaded dilated convolution, the characteristic extraction at various scales is identified. ResDUnet achieves a Dice consistency improvement of 0.95%.
In 2023 Irshad et al. [23] introduced the Light U-Net model, a sophisticated histogram-based image-enhancing method for LV segmentation. Following improvement, the images are sent into U-Net’s encoder-decoder architecture via a brand-new lightweight process paradigm. The MICCAI 2009 dataset yielded a dice factor value of 97.7% and was utilized as a validation tool for the suggested approach.
In 2023 Li et al., [24] created the multi-task neural EchoEFNet for the purpose of classifying and segmenting LVs. The core used for gathering high-dimensional information while preserving spatial characteristics is the ResNet50 model. The biplane Simpson’s approach was used to seamlessly and precisely estimate the LVEF. The suggested technique was evaluated using the CAMUS and CMUEcho datasets, which yielded dice coefficient values of 0.936% and 0.936%, correspondingly.
The study mentioned suggests that DL methods are a basic building block of many modern methods utilized in segment LV patching. It’s less useful for real-time segmentation despite being expensive, difficult in terms of time, and requiring an extended training phase. This process and MRI imaging’s limited capacity to adjust to different conditions are other hindrances. This paper presents a novel Tri-ConvNets approach to address the aforementioned problems.
In this paper, we propose a combination of different deep neural networks for semantic segmentation of left ventricle based on Tri Convolutional Networks (ConvNets) to obtain highly accurate segmentation. Initially, the CMRI images are pre-processed to remove the noise artefacts and enhance the image quality.
The RoI based extraction is carried out in three different stages to accurately identify the LV in noise free CMRI. The first stage is to create a bounding box on LV, then cover up the contour edges of LV with canny edge detector and finally the contour points are marked with the mask thresholding. These features are given as an input to the three different deep learning structures for segmenting the LV in the efficient way. Tri-ConvNets have the ability to gather both smooth and coarse-grained semantic information from entire levels. The contour edges are processed in the standard ConvNet, the contour points are processed using Fully ConvNet and finally the noise free images are converted into patches to perform the pixel-wise operation in ConvNets. These three ConvNets performs different operations to give different segmentation results and these results concatenate to calculate the circular similarity for attaining better LV segmentation output. Figure 1 depicts the illustration of proposed Tri-ConvNets model.
Adaptive bilateral histogram equalization filter (ABIHE)
In this part, adaptive bilateral (AB) and histogram equalization filters are utilized to pre-process the input images to minimize noise distortion and improve image quality. HE is applied after the AB filter has smoothed the image to improve its quality and eliminate additional noise. The pre-processing of the left ventricle is exposed in Fig. 2.
Schematic illustration of Pre-processing process for left ventricle.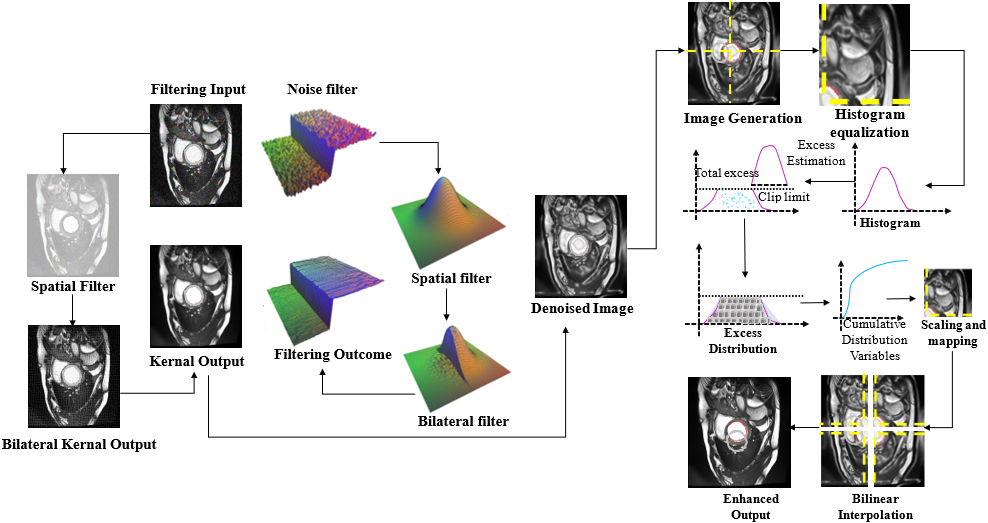
The bilateral filter effectively minimizes noise in images while preserving edge features by selectively allowing pixels to contribute to the scaled average. Its application results in smoother images, and various filters within this category can also identify object boundaries in images. Smooth images with preserved essential data are achieved through the use of the bilateral filter, as illustrated in Fig. 2. The bilateral filter yields optimal results, and pixels on one side of the boundary influence the altered pixel value due to bilateral effects. This process maintains the noise in the image, and the pixel value of the input image is mathematically defined in Eq. (1).
Let
The bilateral filter serves as a nonlinear filter for reducing noise. Filtering and pixel-level considerations impact the outcomes. Equation (4) is employed to calculate the range of filter pixels, taking into account their distance from the point of origin.
From the above equation,
From the equation,
Pre-processing is conducted on gathered images to safeguard crucial information in the LV. The output pixel value is generated by linearly combining the pixel factors of the input through linear filters. The acquired images undergo initial processing utilizing an ABIHE filter, aiming to enhance image quality while preserving vital information. ABIHE filters prove to be efficient in refining and improving snapshots, particularly when confronted with images exhibiting poor contrast, noise, and variable local characteristics. This preprocessing involves tasks such as noise reduction, picture denoising, and scaling. The objective of these operations is to enhance the overall quality of the final product. Such techniques are crafted to elevate the quality of the end result and ready the image for subsequent processing.
Histogram Equalization is a critical technique in image processing, particularly valuable in improving the contrast of images. Its significance lies in its ability to redistribute the intensity distribution of an image, making the details in darker and lighter regions more visible and distinguishable. This is particularly important in medical imaging, where the clarity and contrast of images directly impact the accuracy of diagnosis and analysis. The segmentation of the left ventricle from CMRI images as discussed in the proposed model, Histogram Equalization can play a pivotal role. By enhancing the contrast, Histogram Equalization make the boundaries between different regions of the heart more defined, which is crucial for accurate edge detection and segmentation.
The ABIHE filtering operates on pixels located in the immediate vicinity of each pixel in the image. The ABIHE filter assigns weights to assess the impact of neighboring pixels on the processed pixel, and these weights are employed to calculate the weighted average of pixel values within the neighbourhood. Image processing employs histogram equalization as a method to enhance contrast by redistributing pixel intensities. Although beneficial in certain image analysis scenarios, it’s not universally required. The Histogram Equalization Module individually equalized each sub-histogram using specific equations. The ultimate output image results from the summation of all generated sub-images.
The pixel intensity values
In this phase, a RoI extraction technique is employed to detect left ventricle segmentation. The RoI extraction method is utilized to segment the LV, as progressive heart diseases resulting from cardiovascular injury. Subsequently, features are extracted from raw pixel intensities through a three different deep learning approaches. Following feature extraction, test images are segments. The ROI refers to an area within an image that proves useful for specific objectives. ROI extraction is crucial for reducing computation time and costs while enhancing accuracy. In the context of CMRI imaging, the region surrounding and encompassing the disc is identified as the ROI of a LV image. R-CNN represented a significant leap forward in the realm of object detection, playing a crucial role in advancing the field. It stood out as one of the pioneering models that demonstrated the capabilities of deep learning in handling object detection tasks. The R-CNN architecture consists of three key stages: the backbone, Region Proposal Network (RPN), and RoI. Convolutional techniques are employed on input images to extract the relevant conceptual information. During the initial stage, the RPN generates suggestions that may encompass foreground elements, while in the subsequent step, the RoI network refines the proposal results and performs segmentation. Both the RPN and RoI networks leverage the convolutional feature maps as their foundational components for these processes.
Left ventricle segmentation in noise-free CMRI involves a three-stage RoI-based extraction process to achieve accurate identification. Initially, a bounding box is created around the LV in the first stage, followed by the application of a Canny edge detector to mask the contour edges of the LV. Subsequently, contour points are identified through mask thresholding. These extracted features serve as input for three distinct deep learning structures, collectively referred to as Tri-ConvNets, aimed at efficiently segmenting the LV. Following the rectification of the image region by the RoI network stage, RoI Align was utilized to obtain improved feature maps. These enhanced feature maps were then inputted into the mask layer for image segmentation. Equations (7) and (8) represent the RPN layer and the RoI layer, respectively, and these layers contribute significantly to the complexity in the loss variation within the RCNN. The loss value of the RPN is formed by adding the regression and region-segmented losses.
The RoI layer’s loss rate has been split up into three components: segmentation loss
Bilinear interpolation will be performed by the RoI procedure to transform a feature map with different scales into one scale. The segmentation level is also in charge of segmenting the region of interest. To achieve extremely high accuracy in ROI recognition on the datasets implemented.
In medical image analysis, the extraction of the LV is a vital phase for various applications, such as quantitative analysis and clinical diagnosis. Bounding box pattern in left ventricle extraction refers to the use of bounding boxes to define and extract the ROI comprising the left ventricle from medical images. Before extracting the left ventricle, preprocessing steps applied to enhance the quality of the images. Once the approximate location is identified, a bounding box is defined around the region of interest in left ventricle. A bounding box is a rectangular area that encloses the target object. The coordinates of the bounding box
Extraction of contour edges through ROI
The contour of an object in an image refers to the outline or boundary that separates it from the background. The contour edge pattern involves the analysis of the patterns formed by the edges of the object. The Canny edge detector is an algorithm used in image processing for edge detection. It is employed in the extraction of the LV from cardiac images. Sensitivity to image noise is a notable characteristic of edge detection. Essentially, the blur is less visible for the smallest kernel. Converting the input image to grayscale by adjusting contrast and brightness is necessary to blur the image and eliminate noise. To make edge location and detection effective, a filter is utilized to remove noise in the main image. The Gaussian filter is commonly used for this purpose and is expressed as follows.
From the above equation,
The Canny edge detection operator identifies both the edges and their directional intensities. The points in the direction of the most intensity variation is represented by the gradient, which is normalized as a unit vector. Initially, the vertical and horizontal components of the gradient are determined, followed by the computation of the gradient’s magnitude and orientation. The calculations for gradient magnitude (
From the above equation,
In this part, the contour points are detected after detecting contour edges. Contour points play a crucial role in extracting and delineating the outer border region of the left ventricle images. In the context of left ventricle image extraction, these points represent the boundary of the left ventricle within the image. These points are usually obtained through image processing techniques that identify edges and contours within the image. Various image processing techniques extract contour points and outline the left ventricle. These identified points form a closed curve representing the ventricle’s boundary. Crucial for image extraction, contour points define the ventricle’s boundaries, essential for quantitative analysis and diagnoses in cardiac imaging. Boundary boxes, contour edges, and contour points are extracted using a RoI extraction model, and these features are fed into three deep learning networks for LV segmentation.
Tri-convolutional networks (ConvNets)
In this phase, the extracted features are fed input to the three different deep learning structures for segmenting the LV in the efficient way. Generalized characteristics are extracted from cardiac MRI images using a Transformer, and coarse-grained semantics and fine-grained features are extracted from complete scales using Tri-ConvNets. It resolves the issue of poor segmentation accuracy brought on by hazy LV edge data. The contour edges are processed in the standard ConvNet, the contour points are processed using Fully ConvNet and finally the noise free images are converted into patches to perform the pixel-wise operation in ConvNets. These three ConvNets performs different operations to give different segmentation results and these results concatenate to calculate the circular similarity for attaining better LV segmentation output. The logic behind using the Tri-ConvNets for the semantic segmentation of the left ventricle lies in leveraging the complementary strengths of diverse network architectures to address the multifaceted challenges of medical image segmentation. Each component of the Tri-ConvNets is tailored to a specific aspect of the segmentation process: standard ConvNets excel at identifying and enhancing contour edges, capturing the boundary details essential for accurate shape delineation; Fully Convolutional Networks (Fully ConvNets) are applied for processing contour points, providing precise mappings of the ventricle’s contours by efficiently handling spatial data; and ConvNets designed for pixel-wise operations on segmented patches allow for detailed analysis at the pixel level, ensuring high-resolution segmentation outcomes. This multifaceted approach enables a more robust and nuanced analysis of cardiac magnetic resonance imaging (CMRI) images, significantly improving the accuracy and efficiency of left ventricle segmentation.
Standard ConvNets
Contour edge segmentation using Standard CNN involves the extraction of boundaries and edges from an input image. A standard CNN architecture for this task typically consists of several layers. The convolutional layers play a vital part in capturing local patterns and features. Forecasts using feature learning are aided by fully linked layers at the final stage of the structure. Architecture of Standard Convolutional Network shown in Fig. 3.
Architecture of standard convolutional network.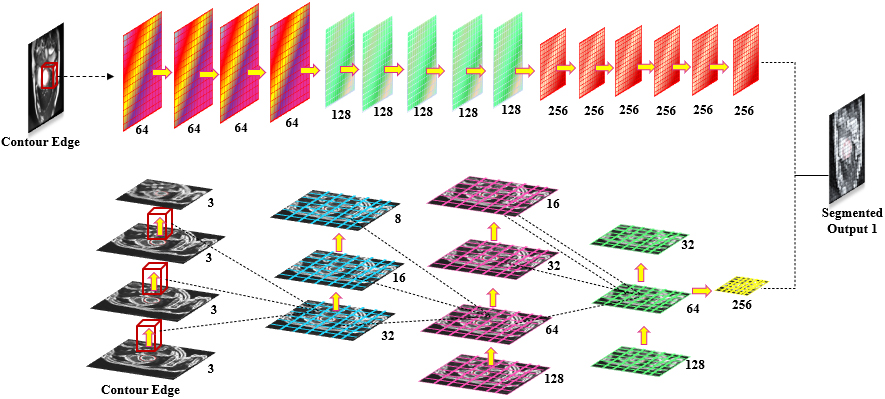
Let
For contour edge segmentation, the final layers of the network are designed to produce a binary segmentation map indicating the presence or absence of edges. The output can be obtained using a sigmoid activation function.
From the above expression,
An FCN for contour points segmentation is a deep learning architecture designed to address pixel-wise segmentation tasks. FCNs are particularly well-suited for such tasks as they preserve spatial information through the use of convolutional layers. The key innovation of FCNs is their ability to handle input images of arbitrary sizes and produce output segmentation maps with the same spatial dimensions as the input. Architecture of Fully ConvNet shown in Fig. 4.
Let,
For training purposes, a cross-entropy loss rate generally utilized., which measures the dissimilarity between the predicted segmentation map
From the above evaluation,
Hyperparameter of proposed Tri-ConvNets
Architecture of fully ConvNet.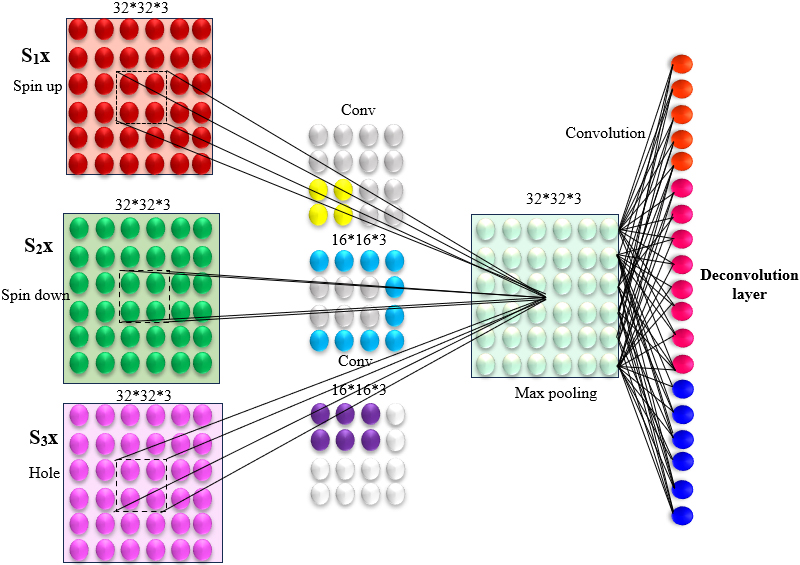
Pixelwise CNN are a class of DL models designed for image segmentation tasks, such as contest patches segmentation. These networks are particularly effective in capturing local dependencies within images, making them suitable for tasks where the relationship between neighboring pixels is crucial. In the context of contest patches segmentation, the goal is to classify each pixel into distinct classes, indicating the presence or absence of specific features in the image. The architecture of a Pixel CNN involves stacking multiple convolutional layers to progressively learn hierarchical representations of the input image. Architecture of Pixel wise Convolutional Network shown in Fig. 5.
Architecture of pixel wise convolutional network.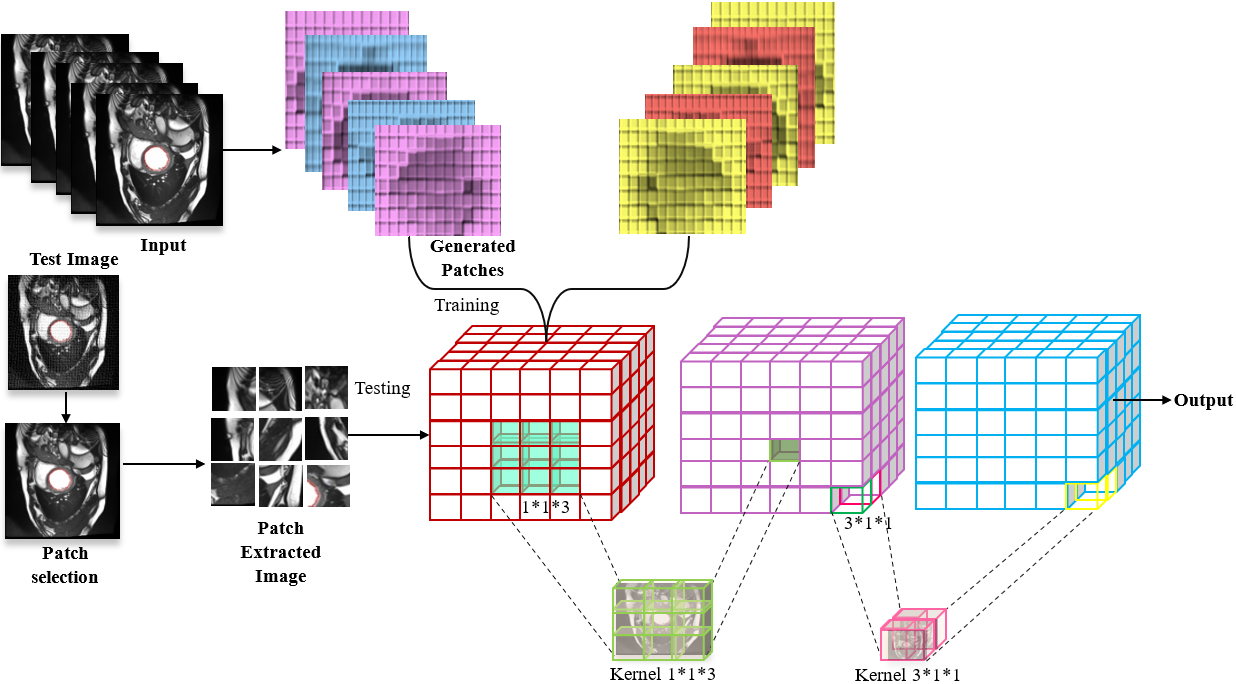
Each convolutional layer employs a receptive field that captures information from a local neighbourhood of pixels. The output of a pixelwise convolutional layer can be expressed in Eq. (16).
From the above equation,
The segmentation task for pixelwise classification problem, and the cross-entropy loss is commonly utilized to evaluate the dissimilarity among predicted and ground truth probability distributions and is expressed in Eq. (17).
From the above equation,
The Table 1 lists various hyperparameters along with their respective ranges, which are crucial for tuning the performance of neural network models. The learning rate, which influences how much the model’s weights are adjusted during training, varies from 0.0001 to 0.1, indicating a spectrum from very fine to more significant updates. The number of epochs (10, 50, 100) refers to the entire dataset is passed through the network, influencing the extent of training. Activation functions such as, ReLU, Sigmoid, Tanh are affecting how neural signals are transformed, with each option having distinct characteristics suited for different tasks. Finally, the dropout rate range from 0.0 to 0.5 defines the proportion of neurons randomly ignored during training, helping to prevent overfitting by promoting generalization.
In this work, Sunnybrook and York dataset is implemented for the segmentation of LV. The Sunnybrook Cardiac Data is a dataset used in medical imaging research, particularly in the field of cardiac image analysis. It is widely employed for tasks such as LV segmentation and motion estimation in cardiac MRI scans. Cardiovascular disorders can be diagnosed non-invasively using cardiovascular magnetic resonance imaging (CMRI). CMRI is frequently used to evaluate the left and right ventricles’ functional integrity in order to spot structural alterations in the heart. CMRI scans are frequently used to obtain clinical parameters of the left ventricle (LV), such as ejection fraction and LV volumes. Tables 5 and 6 listed the segmentation accuracy from Sunnybrook dataset. The Tables 2 and 3 listed the segmentation accuracy from York dataset.
The study’s experimental setup utilized Spyder, an Anaconda navigator running on a Windows 10 operating system. The PC employed an Intel i5 core processor with a speed of 2.10 GHz and a 16 GB RAM system.
Sample segmentation results (a) Sunnybrook dataset and (b) York dataset.
Experimental result of the proposed model.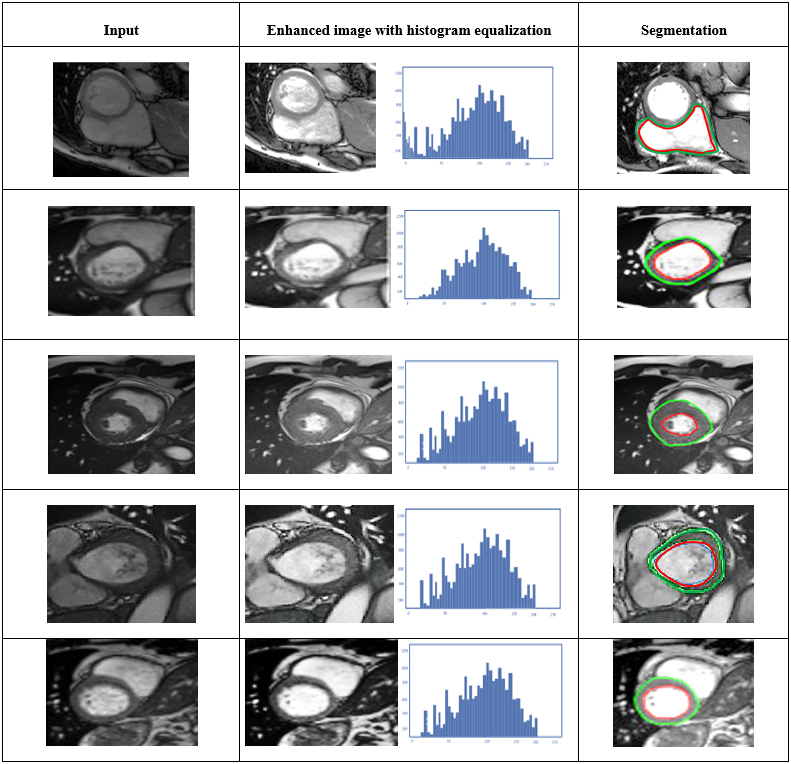
Figure 6 display the segmentation results for the proposed Tri-ConvNets models. The images are pre-processed and taken as input to the planned network. These inputs are processed in each convolutional layer. The convolutional layers are utilized for the LV segmentation, which is shown in above figure. The Fig. 6(a) demonstrates the segmentation result from the sunny brook dataset and Fig. 6(b) shows the segmentation result of LV from York dataset, respectively.
The trial outcomes of the proposed model is expressed in Fig. 7. The input image (column 1) is pre-processed to remove noise artefacts and enhance image quality using ABIHE filter (column 2). Then ROI-based extraction is done in three stages to accurately identify and segment the LV and segmented results are in column 3.
Analysing various characteristics, such as accuracy, PSNR, MSE, DI and JI the results of the research demonstrate the dependability of the LV segmentation. Standard parameters such as True Positive (
The DI is a common metric to evaluate the reliability of image segmentation algorithms, used for macular edema segmentation. It measures the overlap between the segmented region in the image, providing high quality of image with better segmentation accuracy. The statistical method used to evaluate the range and consistency in data sources is the JI.
True positives and negatives of the sample images are denoted by
Analysis of the classic denoising filters performance comparisons
Analysis of the classic denoising filters performance comparisons
In this table, several DL based filters are compared with traditional approaches with specific metrics include PSNR, MSE, and MAE, respectively. Table 2 depicts the comparison between denoising models. A minimal quantity of error rates was obtained by the proposed ABIHE filter. On the other hand, PSNR values are obtained higher than the other values. Comparing the ABIHE filter to different denoising strategies, the analysis found that it offers the least MSE. According to this conclusion, the ABIHE filters have the lowest MSE values, and when compared to other denoising filters, the suggested Tri-ConvNets exhibits low error rates for various noise ratios. Figure 8 Visualizes the comparison of denoising filters.
Segmentation accuracy of York dataset with MR images
The suggested Tri-ConvNets segmentation approach perform better than the other segmentation techniques, according to the performance metrics. The superior LV segmentation performance from the Tri-ConvNets approach is indicated by a higher PPV of 0.9880 and greater Jaccard index of 0.9497.
York dataset segmentation validation with Dice and Jaccard indices
York dataset segmentation validation with Dice and Jaccard indices
The evaluation metrics used in medical image segmentation play a crucial role in assessing the performance of algorithms. The Sensitivity and Specificity are commonly used in this context. Sensitivity measures the proportion of actual positive cases correctly identified by the algorithm. In medical imaging, high sensitivity is essential because missing a true positive could have serious consequences for patient care. Specificity quantifies the ability of the algorithm to correctly identify negative cases. High specificity ensures that true negatives are not misclassified as positive. The Sensitivity emphasizes minimizing false negatives, while Specificity focuses on minimizing false positives. Achieving a balance between these two metrics is crucial for accurate and reliable medical image segmentation.
Figure 9 illustrates the higher similarity between the automated and the manual segmentation on York dataset MR images. Figure 6 depicts sample segmentation results of short axis MR images from all four datasets.
Performance comparison of existing techniques with proposed model
Comparison of classic denoising filters.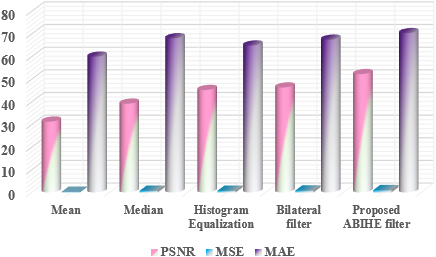
Comparison of segmentation accuracy with MR images from Sunnybrook dataset
The segmentation metrics computed of the LV images from the York dataset are quantified in Table 5. The performance measurements’ variance and average values are shown. According to the experimental results, the suggested Tri-ConvNets segmentation method outperforms the other models in terms of accuracy. With a higher PPV of 0.9582 and a higher Jaccard index of 0.9477, the Tri-ConvNets approach provides sensitive and effective LV segmentation.
The suggested Tri-ConvNets approach has the ability to segment the LV regions more effectively than the other techniques, according to its effectiveness criteria. The increased Jaccard index of 0.9491 and enhanced PPV of 0.9861 demonstrate the Tri-ConvNets technique’s noteworthy LV segmentation ability.
Sunnybrook dataset segmentation estimation with dice and Jaccard indices
Sunnybrook dataset segmentation estimation with dice and Jaccard indices
Linear regression plot depicting the automatic-segmentation volumes against manually obtained volumes with MR images from York dataset.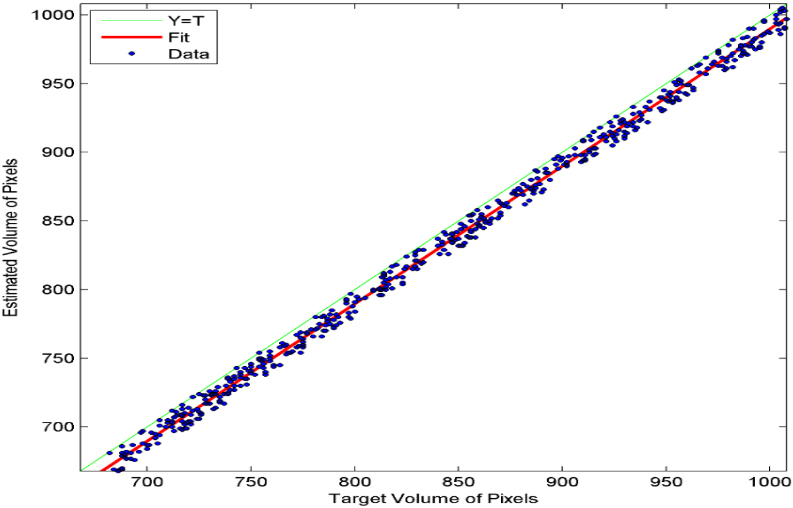
Performance comparison of existing techniques with proposed model
Linear regression plot depicting the automatic-segmentation volumes against manually obtained volumes with MR images from Sunnybrook dataset.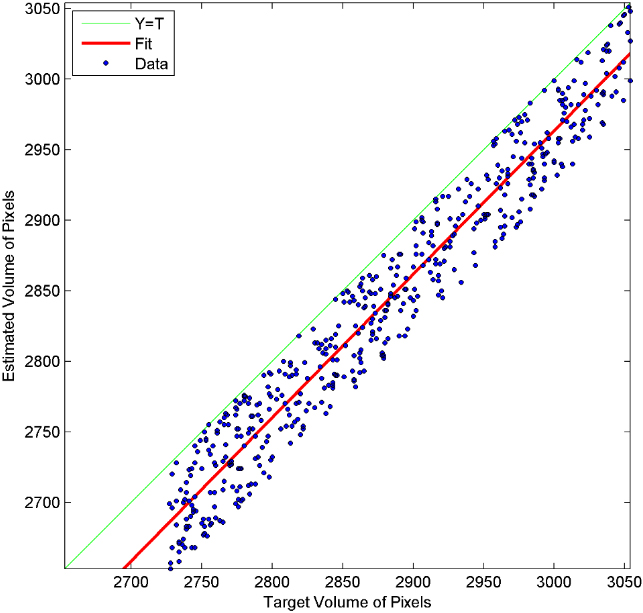
Tables 5 and 6 listed the segmentation accuracy from Sunnybrook dataset. Figure 10 illustrates the higher similarity between the automated and the manual segmentation on Sunnybrook dataset MR images.
The segmentation outcomes calculated from the LV images from the York dataset are quantified in Table 8. The performance measurements’ variance and average values are shown. According to the experimental results, the suggested Tri-ConvNets segmentation method outperforms the other models in terms of accuracy. With a higher PPV of 0.9582 and a higher Jaccard index of 0.9477, the Tri-ConvNets approach provides sensitive and effective LV segmentation.
Table 2 depicts the comparison between denoising models. The several DL based filters are compared with traditional approaches with specific metrics include PSNR, MSE, and MAE, respectively. A minimal quantity of error rates was obtained by the proposed ABIHE filter. On the other hand, PSNR values are obtained higher than the other values. Comparing the ABIHE filter to different denoising strategies, the analysis found that it offers the least MSE. According to this conclusion, the ABIHE filters have the lowest MSE values, and when compared to other denoising filters, the suggested Tri-ConvNets exhibits low error rates for various noise ratios.
Table 3 presents the segmentation accuracy of different algorithms on the York dataset with CMRI images, focusing on several key metrics. Tri-ConvNets exhibit the highest sensitivity (0.9792), specificity (0.9936), with PPV (0.9880) and NPV (0.9992) scores reflecting high reliability in segmentation predictions, respectively. Comparatively, CNN
Table 4 presents the segmentation validation results of different algorithms on the York Dataset, using the Dice and Jaccard indices as metrics for evaluating segmentation accuracy. The Tri-ConvNets algorithm shows the highest performance with a Dice Index of 0.9403 and a Jaccard Index of 0.9497, indicating superior segmentation precision and overlap between the predicted and ground truth segmentations of the dataset. MA-Shape, DLDP, Omega-Net, CNN
The segmentation metrics computed of the LV pictures from the York dataset are quantified in Table 5. The performance measurements’ variance and average values are shown. According to the experimental results, the suggested Tri-ConvNets segmentation method outperforms the other models in terms of accuracy. With a higher PPV of 0.9582 and a higher Jaccard index of 0.9477, the Tri-ConvNets approach provides sensitive and effective LV segmentation.
Table 6 presents a comparison of segmentation accuracy metrics for the left ventricle on MR images from the Sunnybrook Dataset across various algorithms. Tri-ConvNets, the proposed method, achieves high sensitivity (0.9832
Table 7 presents the segmentation performance of various algorithms on the Sunnybrook Dataset, as evaluated by the Dice and Jaccard indices, which are common metrics for assessing the accuracy of semantic segmentation in medical imaging. The Tri-ConvNets approach achieves the highest Dice Index score of 0.9389 with a standard deviation of
The segmentation outcomes calculated from the LV images from the York dataset are quantified in Table 8. The performance measurements’ variance and average values are shown. According to the experimental results, the suggested Tri-ConvNets segmentation method outperforms the other models in terms of accuracy. With a higher PPV of 0.9582 and a higher Jaccard index of 0.9477, the Tri-ConvNets approach provides sensitive and effective LV segmentation.
Conclusion
In this paper, a combination of different deep neural networks for semantic segmentation of the left ventricle based on Tri-ConvNets to obtain accurate segmentation is proposed. CMRI images are initially pre-processed to remove noise artefacts and enhance image quality, then ROI-based extraction is done in three stages to accurately identify the LV. The extracted features are given as input to three different DL structures for segmenting the LV in an efficient way. The contour edges are processed in the standard ConvNet, the contour points are processed using Fully ConvNet and finally the noise free images are converted into patches to perform pixel-wise operations in ConvNets. These three ConvNets perform different operations to give different segmentation results and these results concatenate to calculate circular similarity for attaining better LV segmentation output. The proposed Tri-ConvNets model achieves the Jaccard indices of 0.9491
Ethical approval
My research guide reviewed and ethically approved this manuscript for publishing in this Journal.
Human and animal rights
This article does not contain any studies with human or animal subjects performed by any of the authors.
Funding
None.
Availability of data and material
Data sharing is not applicable to this article as no new data were created or analyzed in this Research.
Informed consent
I certify that I have explained the nature and purpose of this study to the above-named individual, and I have discussed the potential benefits of this study participation. The questions the individual had about this study have been answered, and we will always be available to address future questions.
Footnotes
Acknowledgments
The author would like to express his heartfelt gratitude to the supervisor for his guidance and unwavering support during this research for his guidance and support.
Conflict of interest
This paper has no conflict of interest for publishing.