



Abstract
BACKGROUND:
Osteoarthritis (OA) and osteoporosis (OS) are the most common orthopedic diseases.
OBJECTIVE:
To identify important genes as biomarkers for the pathogenesis of OA and OS.
METHODS:
Microarray data for OA and OS were downloaded from the Gene Expression Omnibus database. Differentially expressed genes (DEGs) between the OA and healthy control groups and between the OS and healthy control groups were identified using the Limma software package. Overlapping hub DEGs were selected using MCC, MNC, DEGREE, and EPC. Weighted gene co-expression network analysis (WGCNA) was used to mine OA- and OS-related modules. Shared hub DEGs were identified, human microRNA disease database was used to screen microRNAs associated with OA and OS, and an miRNA-target gene network was constructed. Finally, the expression of shared hub DEGs was evaluated.
RESULTS:
A total of 104 overlapping DEGs were identified in both the OA and OS groups, which were mainly related to inflammatory biological processes, such as the Akt and TNF signaling pathways Forty-six hub DEGs were identified using MCC, MNC, DEGREE, and EPC modules using different algorithms. Seven modules with 392 genes that highly correlated with disease were identified in the WGCNA. Furthermore, 10 shared hub DEGs were identified between the OA and OS groups, including OGN, FAP, COL6A3, THBS4, IGFBP2, LRRC15, DDR2, RND3, EFNB2, and CD48. A network consisting of 8 shared hub DEGs and 55 miRNAs was constructed. Furthermore, CD48 was significantly upregulated in the OA and OS groups, whereas EFNB2, DR2, COL6A3, and RND3 were significantly downregulated in OA and OS. Other hub DEGs were significantly upregulated in OA and downregulated in OS.
CONCLUSIONS:
The ten genes may be promising biomarkers for modulating the development of both OA and OS.
Introduction
Osteoarthritis (OA) and osteoporosis (OS) are the most common skeletal disorders associated with aging. OA, a prevalent degenerative joint disorder, manifests as joint pain, stiffness, and restricted mobility [1]. It stands as a leading contributor to global disability, impacting over half a billion individuals [2]. Recent years have witnessed some progress in the treatment of OA, yet these treatments invariably lead to complications such as fractures during and after surgery, loss of correction, and nonunion [3]. OS, a systemic skeletal disease frequently occurring in the population, is associated with aging and is typified by reduced bone strength, degradation of bone tissue microstructure, and an increased likelihood of fractures [4]. More than 8. 9 million bone fractures occur annually, and the morbidity continues to rise [5]. The primary strategies for OS prevention and treatment involve essential bone health supplementation and pharmacological interventions, both of which incur substantial costs, thereby exacerbating the economic strain on families and society at large due to OS and related fractures [6, 7]. Although OA and OS are the two most common skeletal disorders, the relationship between them remains controversial.
The genetic backgrounds of OA and OS are complex, and genetic variants have been demonstrated to be responsible for a small proportion of bone diseases Recently, the role of epigenetics in OA and OS has attracted considerable attention [8]. Visconti et al. showed that DNA methylation, one of the most important epigenetic mechanisms for modulating gene expression, is strongly associated with the pathogenesis of aging-related bone diseases, including OA and OS [9]. Pertusa et al. reported that miR-122-5p, miR-125b-5p, and miR-21-5p are valuable biomarkers for modulating bone pathologies [10]. Osteopontin, a vital molecule in bone homeostasis, is associated with OA and OS progression [11]. Although some biomarkers associated with OA and OS development have been identified, more molecules or pathological factors need to be explored to improve the treatment strategies for OA and OS.
Thus, four profiles, each of OA and OS, were used to explore the molecules involved in both OA and OS. Differentially expressed genes (DEGs) in OA vs. healthy controls and OS vs. healthy controls were screened using the limma package. The overlapping genes of hub DEGs were selected using MCC, MNC, DEGREE, and EPC, and genes involved in the modules were selected as important genes in OA and OS, and their expression levels were also displayed. Finally, ten genes were identified as promising candidates for OA and OS development.
Materials and methods
Gene expression omnibus (GEO) datasets
OA and OS expression profiles of were downloaded from the NCBI GEO database [12] (
Four OS profiles were downloaded: GSE56814 [16, 17, 18], GSE62402, GSE7158, and GSE13850. A total of 73 blood samples from 31 OS patients and 42 healthy controls were included in GSE56814, and 10 blood samples from five OS patients and five healthy controls were included in GSE62402. Both profiles were sequenced using the [HuEx-1_0-st] Affymetrix Human Exon 1. 0 ST Array. A total of 26 blood samples from 12 OS patients and 14 healthy controls were included in GSE7158, based on the [HG-U133_Plus_2] Affymetrix Human Genome U133 Plus 2. 0 Array Forty blood samples from 20 OS patients and 20 healthy controls were included in GSE13850, based on the [HG-U133A] Affymetrix Human Genome U133A Array.
GSE55457, GSE55235, and GSE12021 were used as training datasets for OA, and GSE56814, GSE62402, and GSE7158 were used as training datasets for OS. SVA (
Screening of DEGs
DEGs between the OA and healthy control groups and the OS and healthy control groups were screened using the limma package (version 3.34.7) of R4.3.1 in the OA and OS training datasets, respectively [20]. FDR values less than 0. 05 and
Overlapping DEGs between the OS and OA groups were retained as significant DEGs related to both diseases. DAVID (version 6.8) [22, 23, 24] was used to annotate the GO function and Kyoto Encyclopedia of Genes and Genomes (KEGG) signaling pathway enrichment analysis, and a p-value less than 0.05 was selected as the threshold for enrichment significance.
Construction of PPI network and selection of hub DEGs
The interaction relationships between the protein products of overlapping DEGs were constructed using STRING (version 11.0) [25] and visualized using Cytoscape (version 3.9.0) [26]. Subsequently, hub DEGs were selected based on four topology analysis algorithms, MCC, MNC, DEGREE, and EPC, using the cytoHubba module recognition plugin (version 0.1) [27] in Cytoscape 3.9.0. The important genes screened by each of the four algorithms were compared and the overlapping parts were retained as hub DEGs.
Selection of modules associated with disease status using weighted gene co-expression network analysis (WGCNA) algorithm
WGCNA [28] is a bioinformatics algorithm used for constructing co-expression networks that are used to identify modules associated with diseases and screen important pathogenic mechanisms or potential therapeutic targets. Based on the expression levels of all genes in the merged OA- and OS-related dataset samples, we used the WGCNA package (version 1.61) [29] in R4.3.1 to screen modules significantly correlated with the disease status of the sample.
The threshold for module-partitioning screening was set as follows: the module set should contain at least 200 genes and cutHeight was set to 0.995. Subsequently, disease-related modules were selected from the OA- and OS-related datasets and the gene sets of each module were compared. The overlapping parts were selected as genes significantly associated with both the diseases, and hub DEGs were identified in the interaction network to obtain the shared hub DEGs related to both diseases.
Construction of miRNA regulation network
miRNAs related to all diseases were downloaded from the human microRNA disease database (HMDD) (version 3.2) [30], and miRNAs related to both OA and OS were selected for further analysis. Genes targeted by the selected miRNAs were screened using miRWalk 3.0 [31]. The intersection of targeted genes and shared hub DEGs was retained, and an miRNA-targeted gene network was constructed and visualized using Cytoscape (version 3.9.0) [26].
Analysis of expression levels of hub DEGs in training and validation datasets
The expression levels of hub DEGs in the combined OA and OS training datasets were selected. The expression levels of hub DEGs in the validation datasets (GSE82107 and GSE13850) were also extracted.
Results
A total of 104 overlapping DEGs in OS and OA were identified
Three profiles of OA, GSE55457, GSE55235, and GSE12021 were combined as a training dataset, and the batch effect was removed using SVA. Similarly, the three OS profiles (GSE56814, GSE62402, and GSE7158) are used as a training dataset and SVA was used to remove the batch effect. After SVA, the samples in the OA and OS combined training datasets showed similar levels (Fig. 1A and B).
Sample distribution map. A. Sample distribution map of OA before and after removing batch effects using SVA. B. Sample distribution map of OS before and after removing batch effects using SVA.
A total of 578 and 287 DEGs were identified between the OA and healthy control groups and the OS and healthy control groups, respectively. The volcano map and bidirectional hierarchical clustering of DEGs in the OA and OS groups are shown in Fig. 2A and B, respectively. The results showed that the levels of upregulated DEGs differed from those of downregulated DEGs. A total of 104 overlapping DEGs were identified between the OA and OS groups (Fig. 2C).
A total of 104 overlapping differentially expressed genes (DEGs) in osteoporosis (OS) and osteoarthritis (OA) were identified. A: Volcano plot and heatmap of DEGs in OA; B: Volcano plot and heatmap of DEGs in OA. Left: Effect size (log2FC)-log10 (FDR) volcano plot. Red and blue dots represent significantly upregulated and downregulated DEGs, respectively. The horizontal dashed line indicates a false discovery rate (FDR) 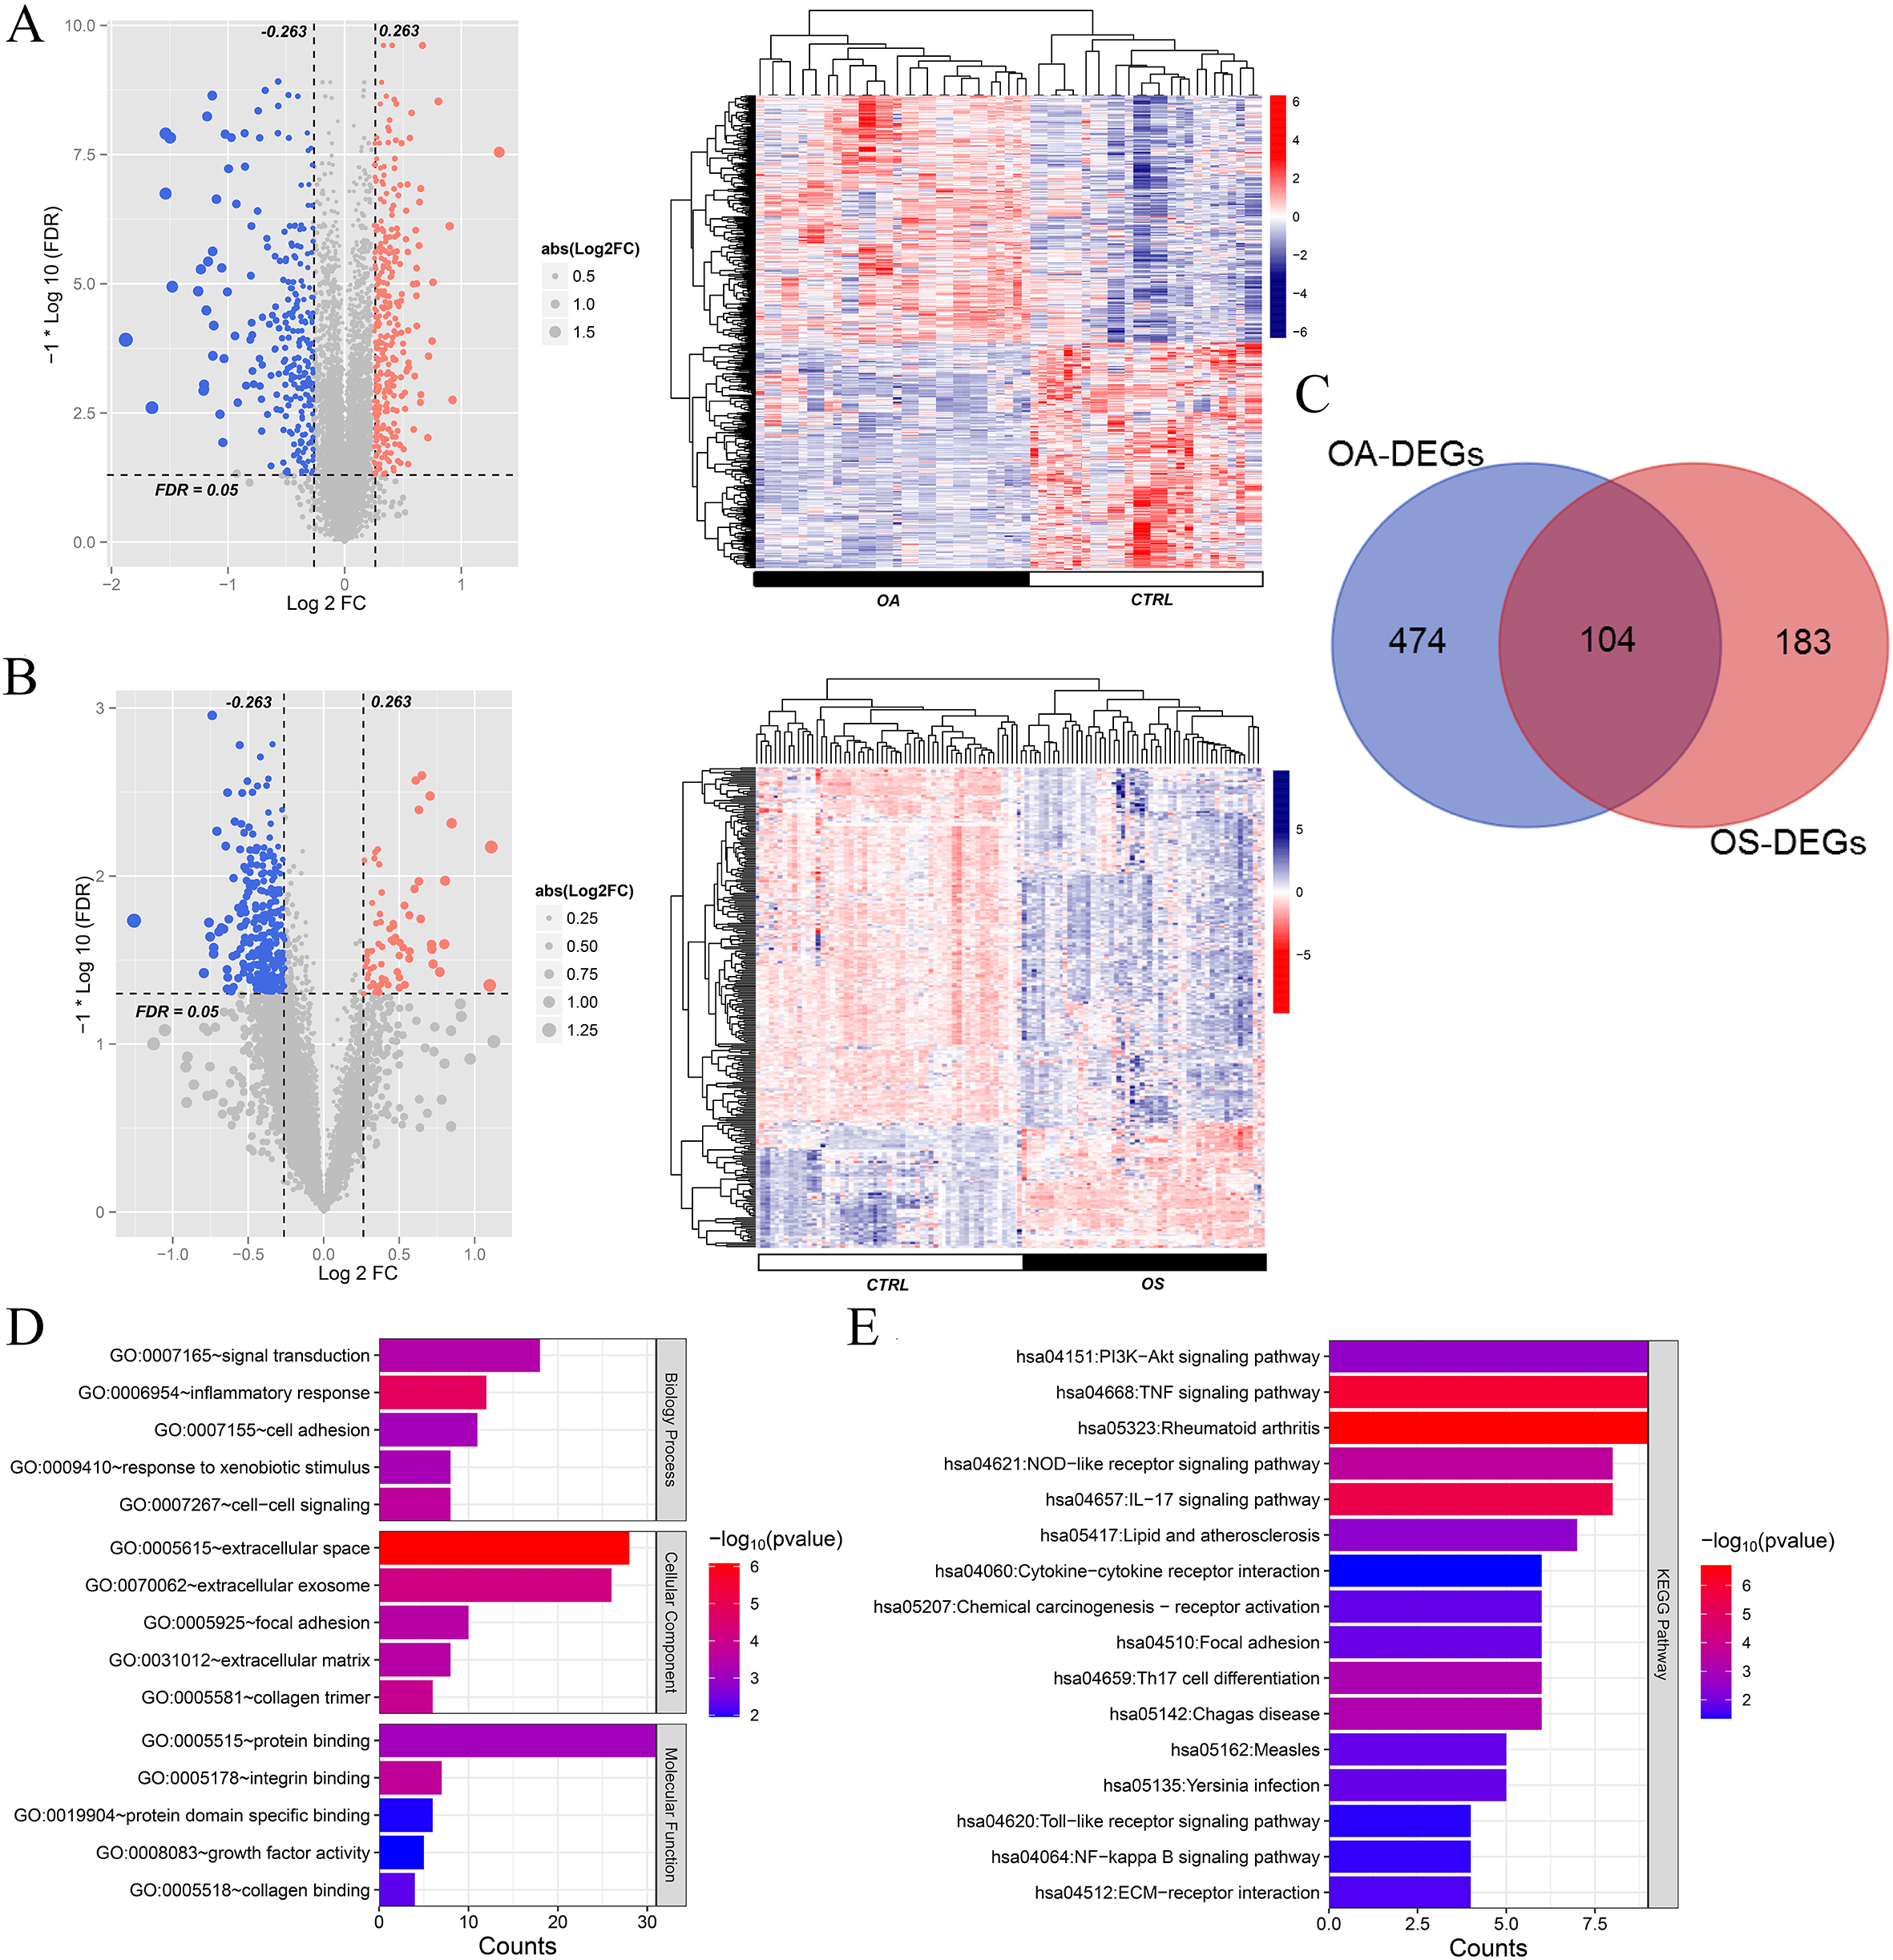
Functional analysis of these 104 overlapping genes revealed that they were significantly enriched in 84 GO items, including 58 biological processes such as signal transduction and inflammation, 13 cellular components such as extracellular space and extracellular exosomes, and 13 molecular functions such as protein binding and integrin binding (Fig. 2D). Moreover, 16 KEGG pathways were enriched in the overlapping genes, including the Akt signaling pathway, TNF signaling pathway, and rheumatoid arthritis (Fig. 2E).
Using the STRING database, interactions among the proteins encoded by 104 overlapping DEGs were identified and interactions with scores higher than 0.4 were selected A total of 984 pairs of interactions were obtained and a PPI network was constructed based on these pairs (Fig. 3A). Hub DEGs in both the OA and OS groups were screened using four topology analysis algorithms: MCC, MNC, DEGREE, and EPC. The top 50 genes in the four topology analysis algorithms were selected, and 46 overlapping genes were identified as hub DEGs in the OA and OS groups, including PFKFB3, MMP14, HSP90AB1, LRRC15, DDR2, EGR1, FOS, BTG2, CD48, and HSPA5 (Fig. 3B).
Protein-protein interaction (PPI) network and Venn map for selecting hub differentially expressed genes (DEGs). A: PPI network, and nodes of different colors represent genes with different differences; B: Venn map for hub DEGs, selected using MCC, MNC, DEGREE, and EPC.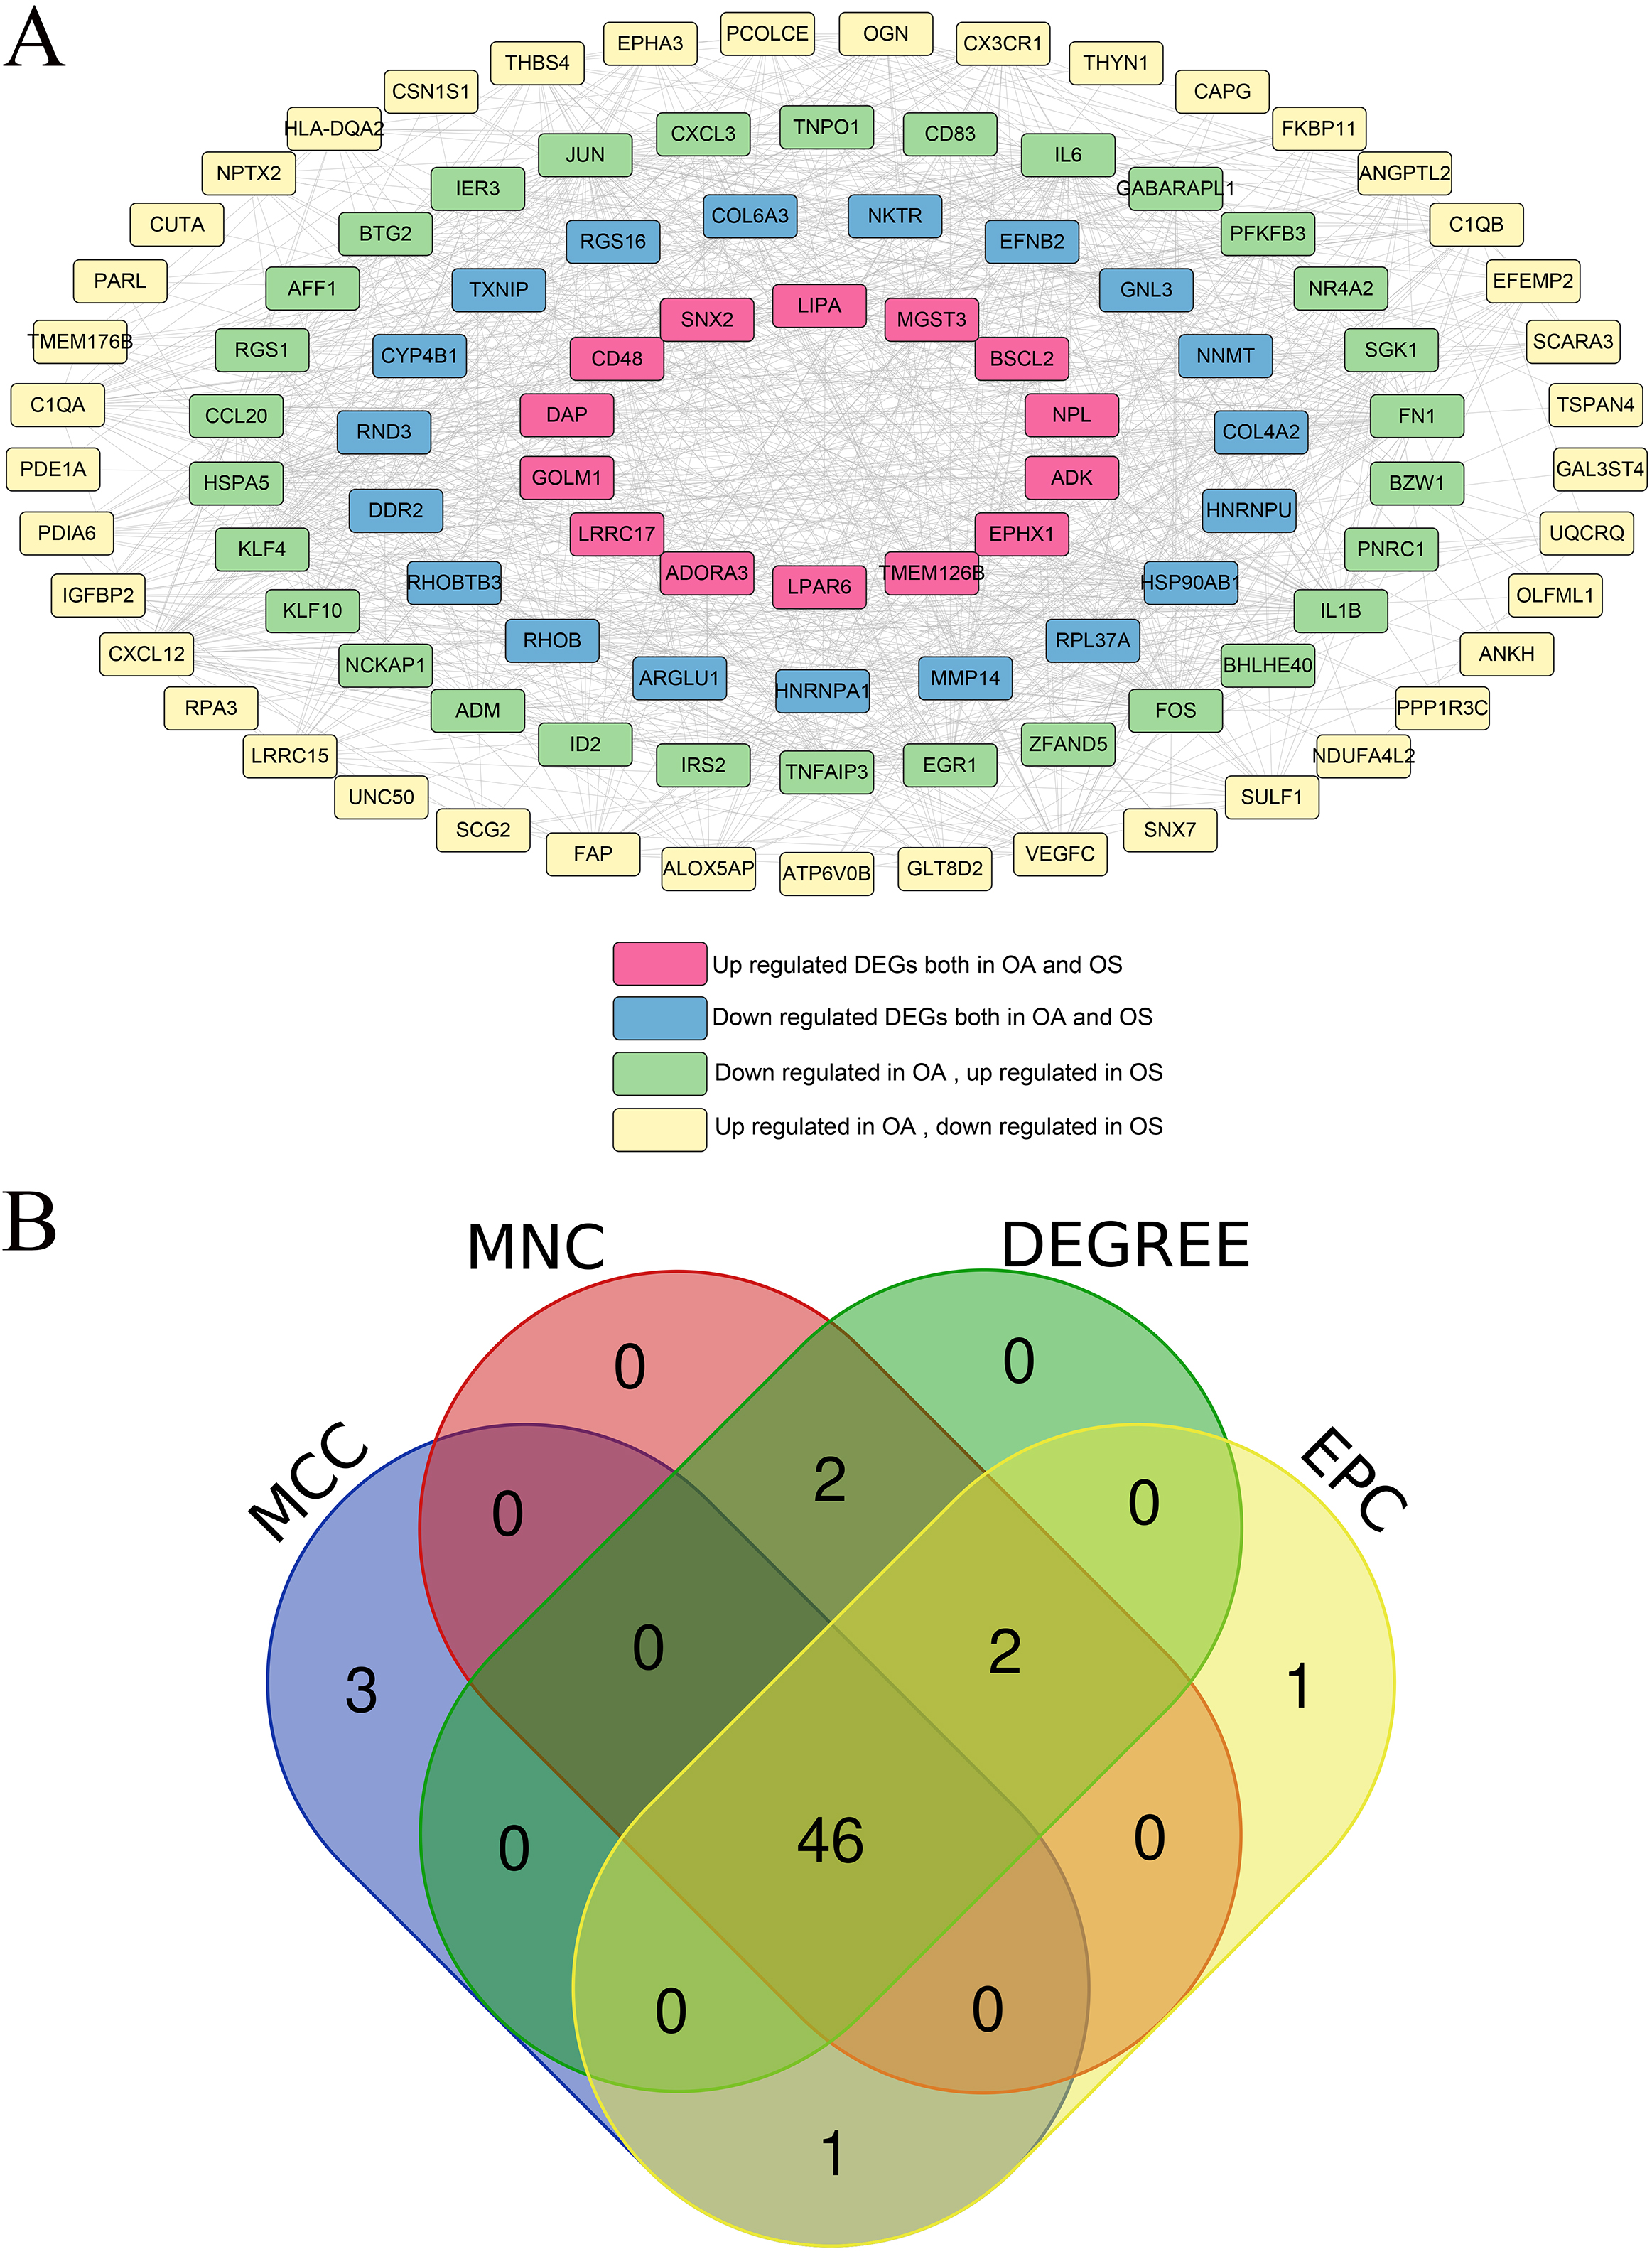
When the power was 7 or 18, the signed R2 was 0.9. The mean connectivity was 1, which is consistent with the nature of small-world networks (Fig. 4A and B). The coefficient of dissimilarity between gene points was then calculated, and a systematic clustering tree was obtained When we set the minimum number of genes in each module to 200 and cutHeight
Ten genes were selected as valuable genes in the osteoporosis (OS) and osteoarthritis (OA) groups. A: Left: Adjacency matrix weight parameter power selection chart for OA. The horizontal axis represents the weight parameter power and the vertical axis represents the square of the correlation coefficients between log (k) and log (p (k)) in the corresponding network. The red line represents the standard line, where the square value of the correlation coefficient reaches 0.9. Right figure: Schematic diagram of average gene connectivity under different power parameters of OA. The red line represents the value of average network node connectivity under the weight parameter power of the adjacency matrix in the left figure (1); B: Module partition tree diagram with each color representing different modules in OA; C: Module-trait correlation heatmap in OA; D: Left: Adjacency matrix weight parameter power selection chart for OS. The horizontal axis represents the weight parameter power and the vertical axis represents the square of the correlation coefficients between log (k) and log (p (k)) in the corresponding network. The red line represents the standard line, where the square value of the correlation coefficient reaches 0.9. Right figure: Schematic diagram of average gene connectivity under different power parameters of OS. The red line represents the value of average network node connectivity under the weight parameter power of the adjacency matrix in the left figure (1); E: Module partition tree diagram with each color representing different modules in OS; F: Module-trait correlation heatmap in OS; G: Comparison chart of gene sets involved in five OA-related modules and two OS-related modules; H: Venn map of hub differentially expressed genes (DEGs) and genes selected by WGCNA. 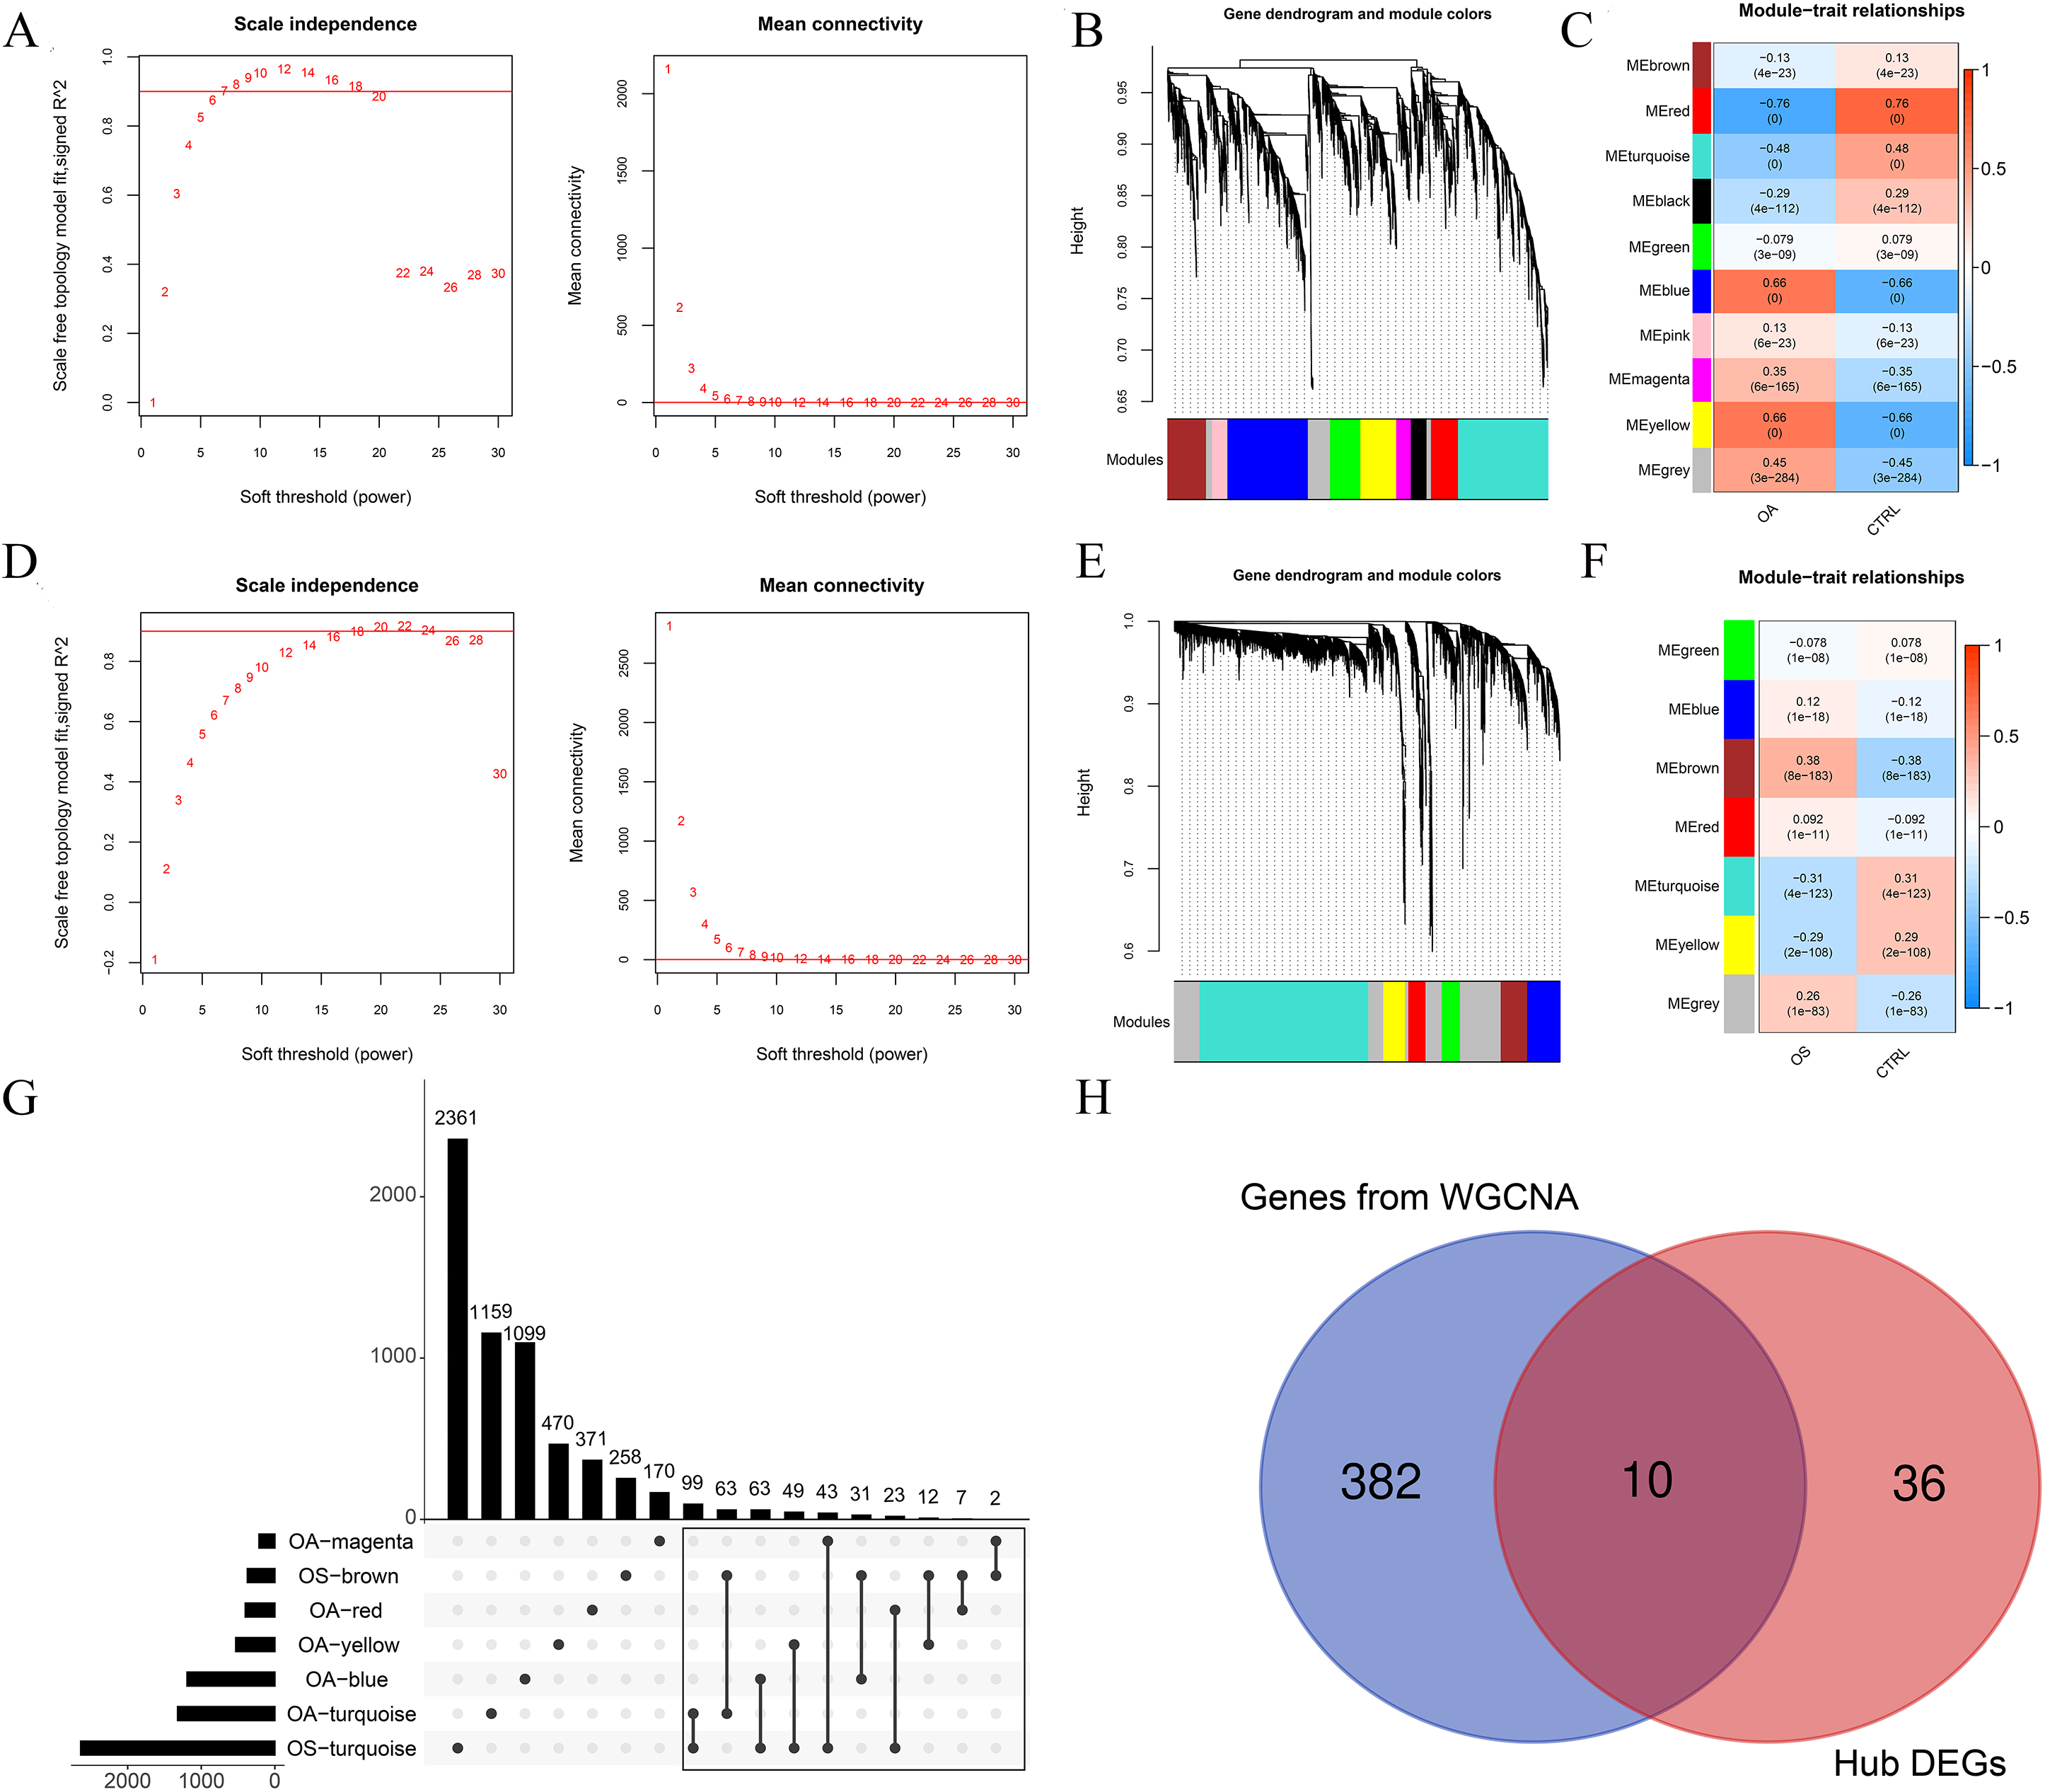
Among these modules, 392 genes were associated with both OA and OS (Fig. 4G). These 392 genes and 46 hub DEGs were compared, and 10 shared hub DEGs were identified between the OA and OS groups, including OGN, FAP, COL6A3, THBS4, IGFBP2, LRRC15, DDR2, RND3, EFNB2, and CD48 (Fig. 4H).
A total of 211 miRNAs associated with OA and 230 miRNAs associated with OS were screened using the HMDD (v3.2). Among them, 114 miRNAs were associated swith both OA and OS.
The genes targeting 114 miRNAs associated with both OA and OS were analyzed using miRWalk. Subsequently, ten shared hub DEGs in the OA and OS groups were mapped to these target genes, resulting in 140 connection pairs (Fig. 5), including eight shared hub DEGs: OGN, COL6A3, IGFBP2, LRRC15, DDR2, RND3, EFNB2, and CD48.
miRNA-target gene network in osteoporosis (OS) and osteoarthritis (OA).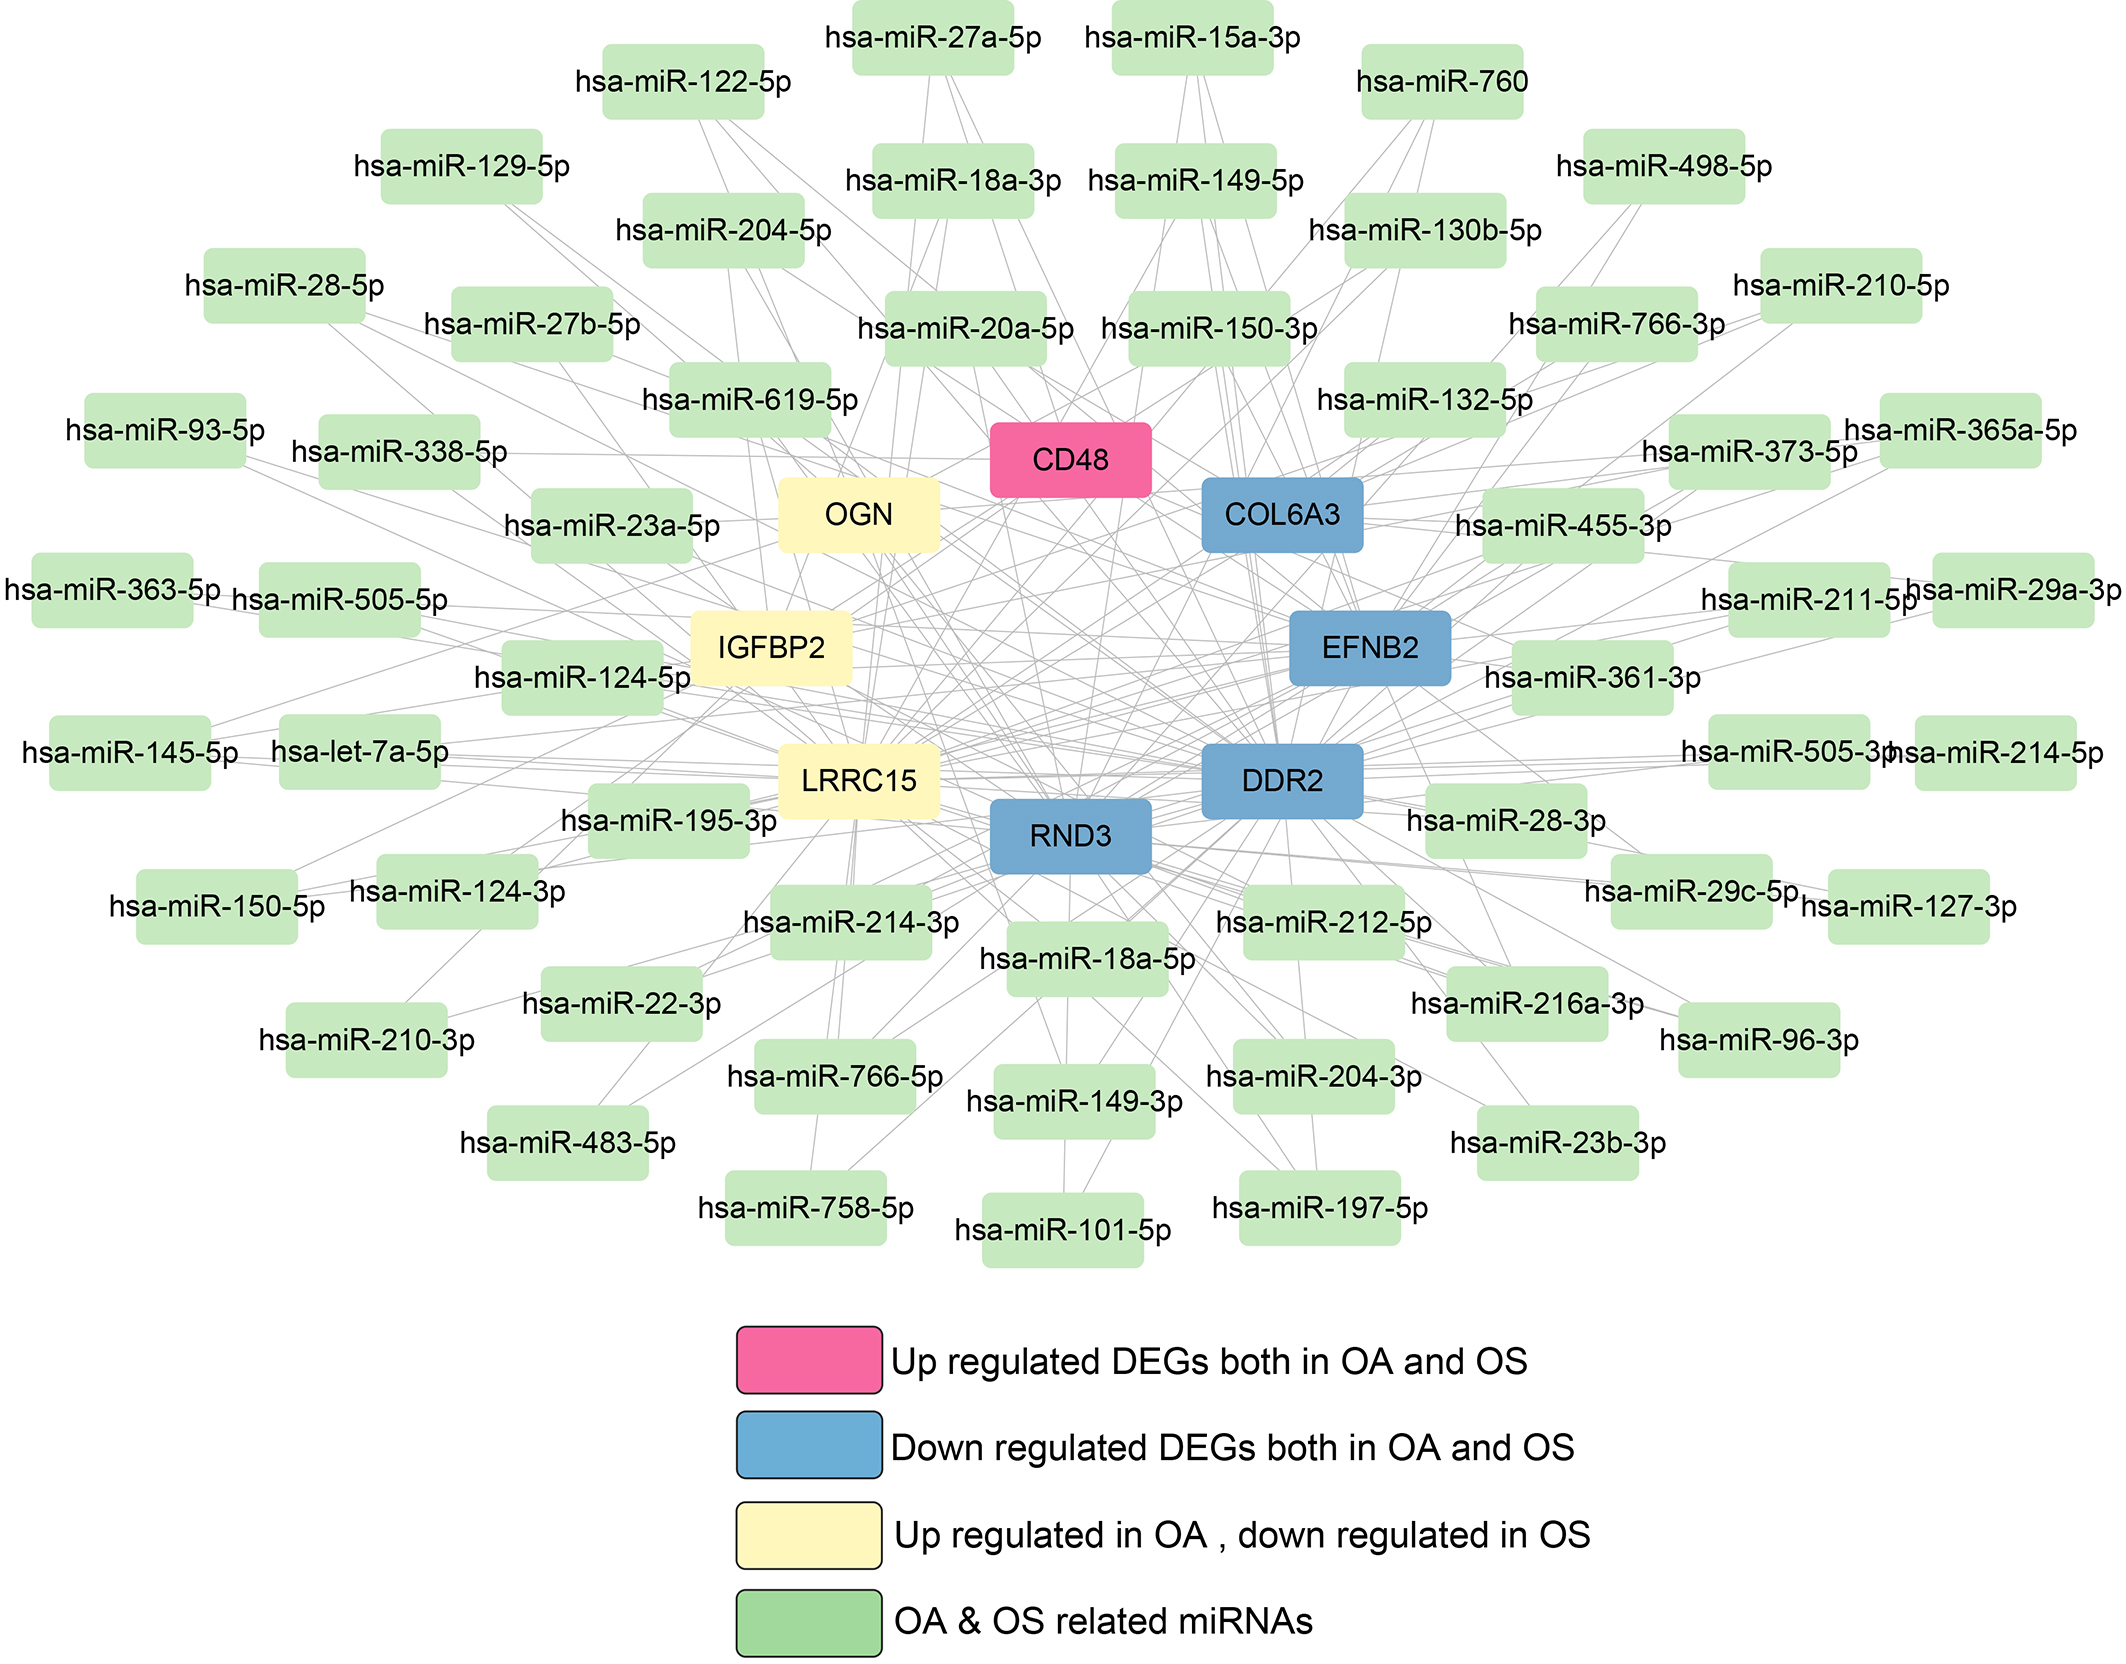
Two KEGG pathways were significantly enriched in these eight shared hub DEGs, including ECM-receptor interaction and focal adhesion.
The expression levels of the 10 shared hub DEGs in the OA and OS groups are shown in Fig. 6. Figure 6A shows that the levels of 10 shared hub DEGs in the OA training dataset were consistent with those in GSE82107. Similarly, the levels of 10 shared hub DEGs in the OS training dataset align with those in GSE13850 (Fig. 6B). Furthermore, we observed that CD48 was significantly upregulated in the OA and OS groups and that four genes, EFNB2, DR2, COL6A3, and RND3, were significantly downregulated. The other five genes, THBS4, LRRC15, OGN, FAP, and IGFBP2, were significantly upregulated in the OA group and downregulated in the OS group.
Expression levels of ten important genes in the osteoporosis (OS) and osteoarthritis (OA) groups. A: Expression levels of ten important genes in the OA training and validation datasets of GSE82107; B: Expression levels of ten important genes in the OS training and validation datasets of GSE13850.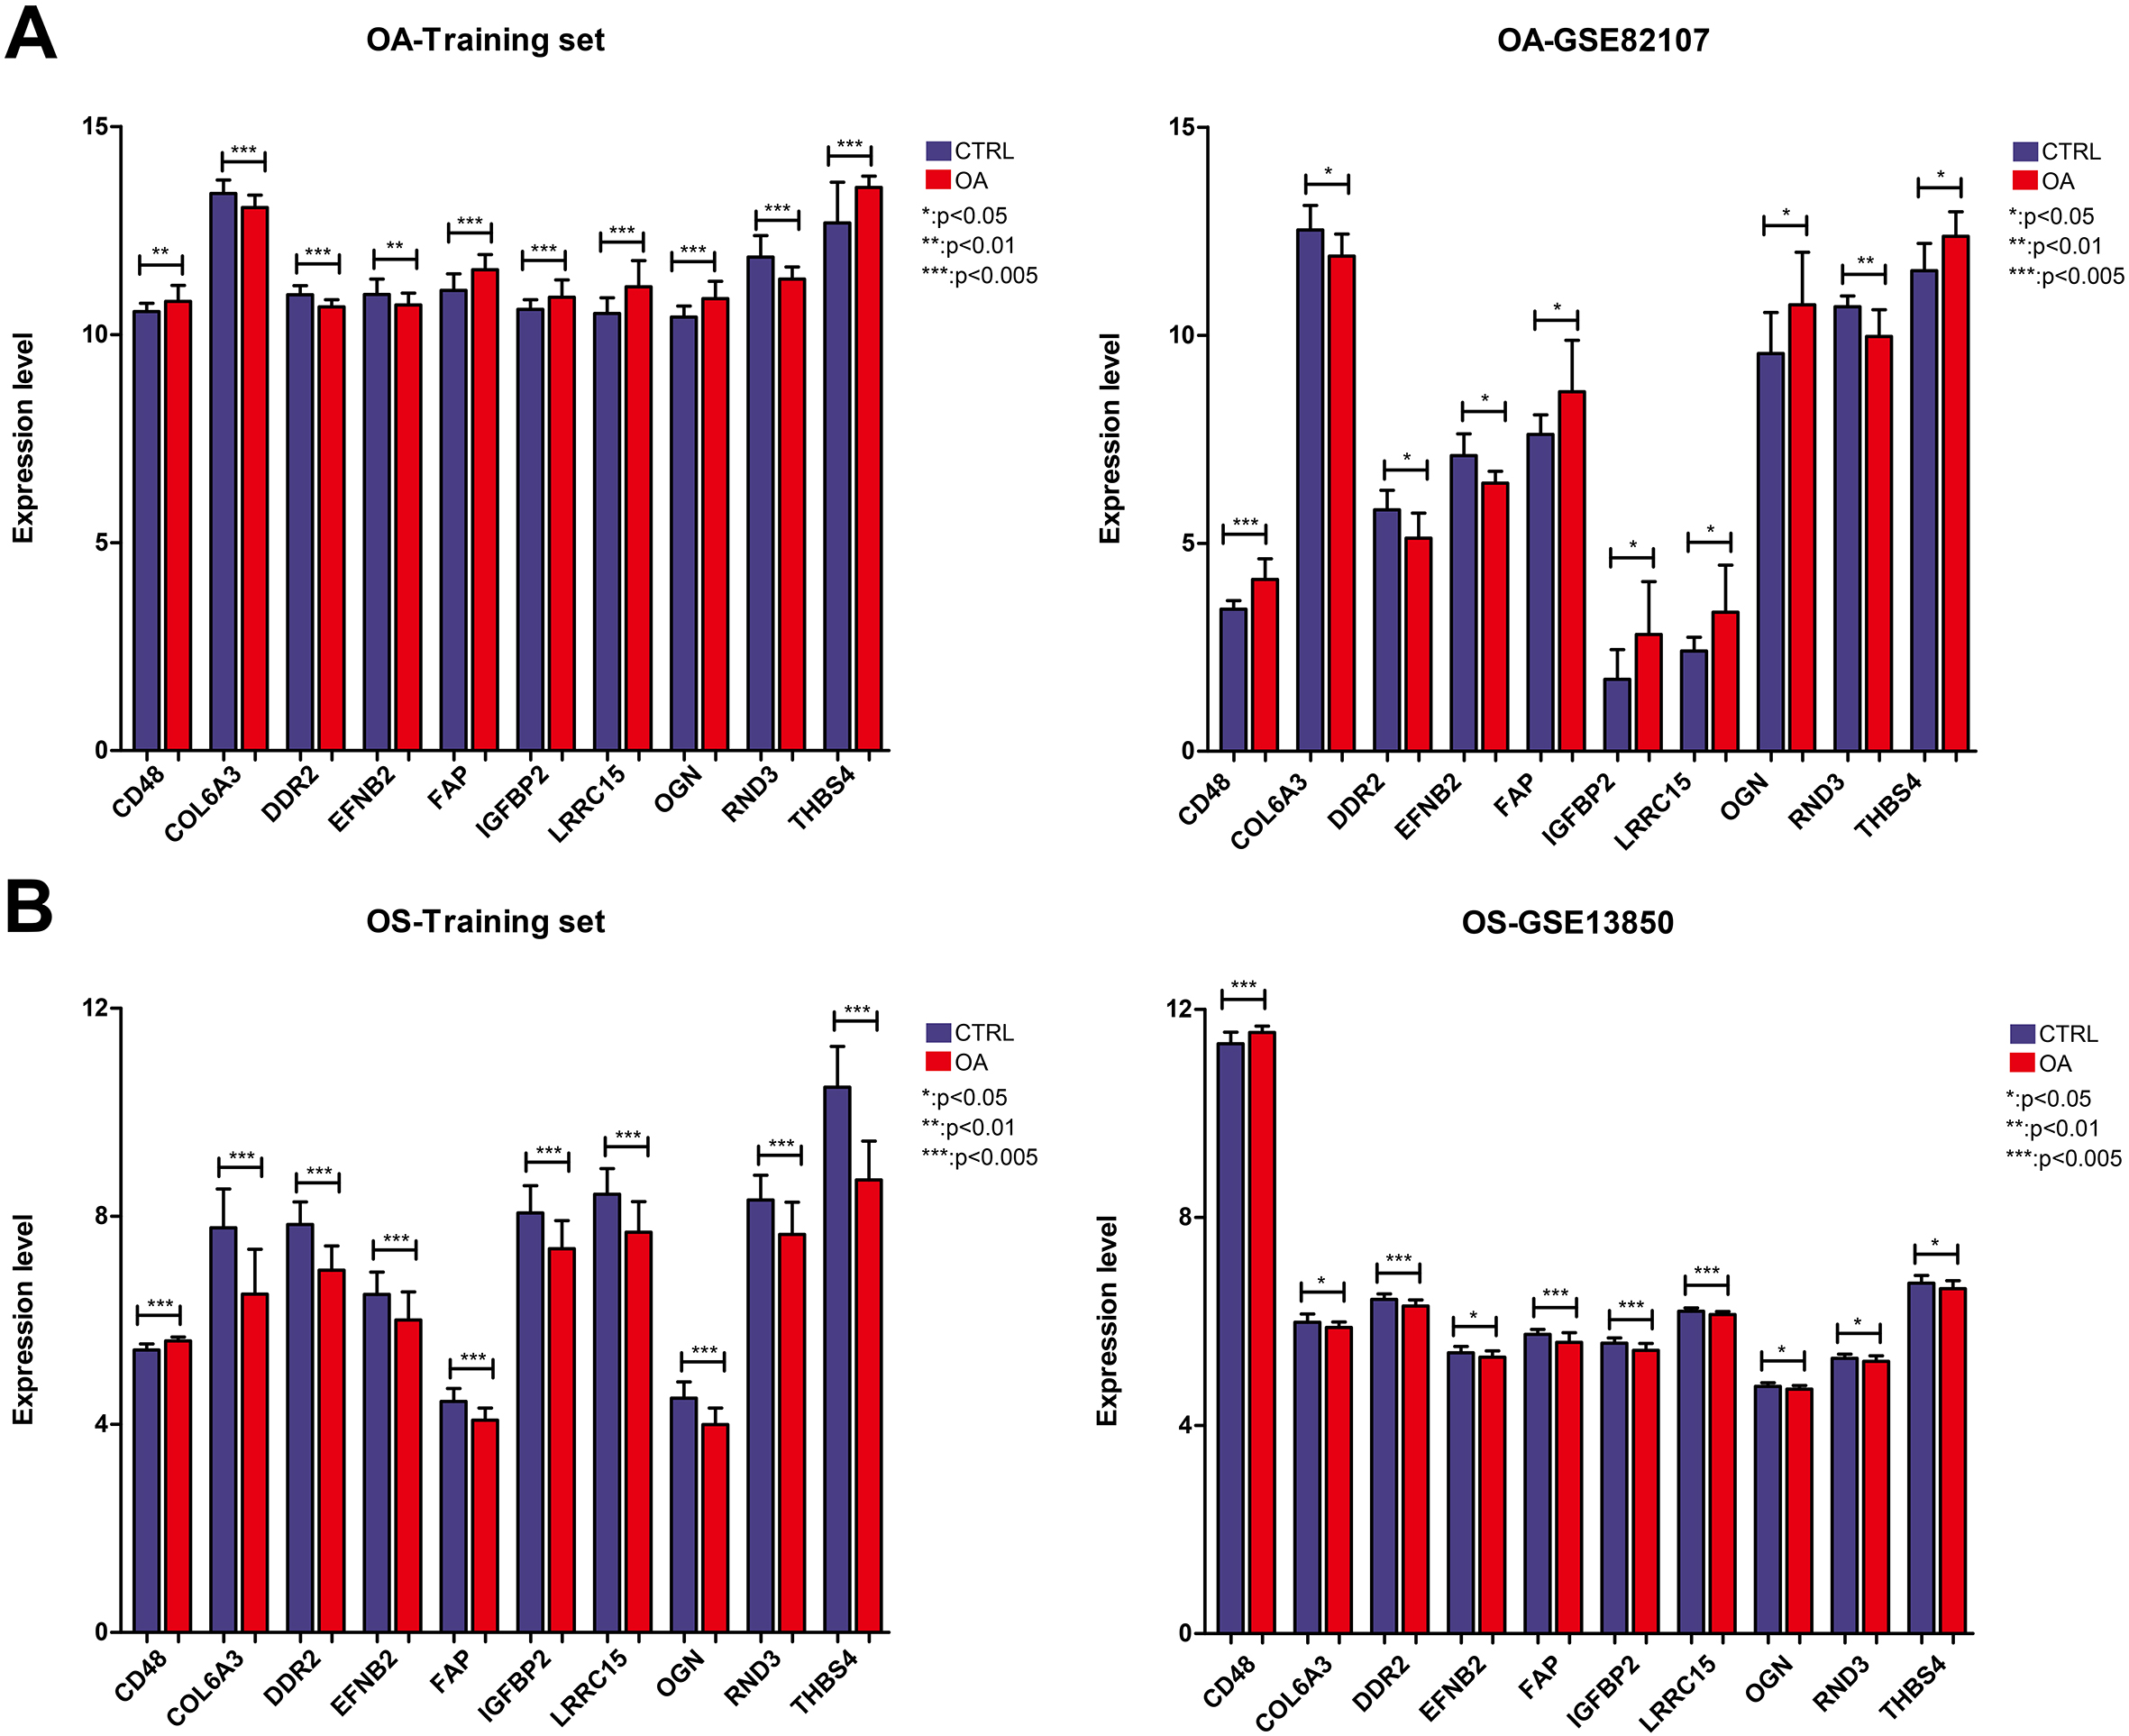
OA and OS are chronic diseases with prevalence rates that escalate with advancing age, both capable of inflicting pain and functional impairment, thereby diminishing patient quality of life [32, 33]. The relationship between OA and OS – whether they are positively correlated [34] or inversely correlated [35] – has been a point of contention. Emerging research has provided new insights into convergent and divergent risk factors for OA and OS, leading to revised understandings of the roles of bone mineral density, body mass index, falls, genetics, and epigenetics in the pathophysiology of these diseases and their associated increased fracture risks [36]. In recent years, a plethora of bioinformatics approaches has been extensively applied to the analysis of potential biomarkers related to OA and OS, leading to the discovery of numerous genes associated with the incidence and prognosis of these conditions. For instance, Wang et al. discovered an upregulation of CRIP1 in synovial, blood, and cartilage samples through the analysis of the GEO dataset, suggesting its potential as a diagnostic biomarker for OA [37]. Zhou et al. recognized ten pivotal genes associated with OA via gene expression microarray data, potentially aiding in the elucidation of molecular mechanisms of OA [38]. Yu et al. ascertained eight key genes through bioinformatics analysis conducive to the construction of an early diagnostic model for OS [39]. Chen et al. developed a diagnostic model based on nine key genes that reliably distinguished OS patients from healthy subjects, providing new insights into the diagnosis of OS [40]. Although the application of bioinformatics in OA and OS has been extensively documented, there is a paucity of research exploring the common mechanisms between OA and OS at the gene level. Hence, we conducted a bioinformatics analysis aimed at investigating the shared molecular mechanisms between OS and OA. In the present analysis, 104 overlapping DEGs were identified in the OA and OS groups, which were mainly related to inflammatory biological processes, such as the Akt and TNF signaling pathways Furthermore, 10 important genes were identified in the OA and OS groups. Among them, CD48 was significantly upregulated in the OA and OS groups, whereas four genes, EFNB2, DR2, COL6A3, and RND3, were significantly downregulated. The other five genes, THBS4, LRRC15, OGN, FAP, and IGFBP2, were significantly upregulated in the OA group and downregulated in the OS group Overall, ten shared hub DEGs were closely associated with the pathogenic mechanism of both OA and OS.
Multiple convergent and divergent factors, including genetics, mechanical load, and inflammation, have been reported in OS and OA patients. Both these diseases are polygenic. In the present analysis, 104 overlapping genes of 578 DEGs in the OA group and 287 DEGs in the OS group were mainly related to inflammatory biological processes, such as the Akt and TNF signaling pathways The PI3K/AKT and TNF signaling pathways are essential for normal metabolism of bone tissues, such as bone metabolism and immune responses. TNF-
Among the ten shared hub DEGs, OGN, FAP, COL6A3, THBS4, IGFBP2, LRRC15, DDR2, RND3, EFNB2, and CD48, the roles of some genes in the bone mechanism have been well demonstrated Previous evidence suggests that the progression of OA and OS is related to multiple factors such as nutritional factors, physical activity, and genetic factors. Increased subchondral bone loss is a characteristic feature of early stages of OA and OS [44]. CD48 is an important component of T cell activation pathways, and the activation of T cells is related to bone fragility and destruction [45]. Enhancement of the EFNB2-EphB4 signaling cascade inhibits osteoclastogenesis, thereby preventing bone loss in ovariectomized rats, whereas ablation of EFNB2 expression reverses the inhibitory effects on osteoclasts [46]. Furthermore, modulating the balance of the EphB4-EFNB2 axis may ameliorate the pathological profile of OS [46, 47]. Some genes are involved in the differentiation of bone marrow-derived stem cells, which may provide novel therapeutic strategies for OA and OS. For example, COL6A3 enhances osteogenic and adipogenic lineage differentiation by modulating mitochondrial health maintenance and promoting mitophagy [48]. Rnd3/RhoE are well known key regulators of the actin cytoskeleton in various cell types [49]. LRRC15, an evolutionarily conserved leucine-rich transmembrane protein, is highly expressed in human OA cartilage and osteoclasts derived from patients with rheumatoid arthritis [50, 51]. Moreover, differential methylation and LRRC15 expression in OA cartilage are associated with cellular stress responses and dysregulated extracellular matrix remodeling [52]. OGN is associated with bone formation, with elevated OGN levels found in both synovial fluid and damaged cartilage in OA patients [53, 54]. A series of studies have revealed the role of OGN in OA, suggesting that high expression of OGN may promote ossification and repair of the articular cartilage [55, 56]. In bone marrow stromal cells, FAP is significantly upregulated, and functions of the gene play as an osteogenic suppressor. Moreover, THBS4 is involved in primary keratinocyte migration and is upregulated in bone marrow lesions [57]. Although the roles of other genes, including IGFBP2 and DDR2, have not been widely studied in OS and OA, it is recommended to verify their functions in both OS and OA.
This study had some limitations. First, the conclusions were based on an open-access online dataset. Meanwhile, the background information of the enrolled subjects, such as the clinical backgrounds of patients and disease subtypes, was lacking. To filter out the noise signal induced by the background information, this conclusion should be verified using a large number of samples and clinical research. Second, the potential role of the shared hub DEGs in OA and OS was confirmed by western blotting and polymerase chain reaction. Furthermore, the functions of these genes should be explored in animal models with gene silencing or overexpression Despite these limitations, four OA and OS datasets were used in this study, and the expression levels of the selected hub DEGs were similar in both the training and validation datasets.
In conclusion, we showed that ten shared hub DEGs, including OGN, FAP, COL6A3, THBS4, IGFBP2, LRRC15, DDR2, RND3, EFNB2, and CD48, may be valuable biomarkers for both OA and OS, which may improve our understanding of the molecular mechanisms underlying OA and OS.
Footnotes
Conflict of interest
The authors declare that they have no conflict of interest.
Funding
None.