



Abstract
BACKGROUND:
Fractional flow reserve (FFR) determined invasively has been globally accepted as the gold standard for determining the functional significance of coronary artery stenoses. However, despite its great importance, the invasive method has certain disadvantages, including the risk of vascular injuries, the need for vasodilation, and significant medical costs. That is why great attention was paid to the development of non-invasive methods that would enable reliable diagnosis without exposing patients to the risk of unwanted consequences.
OBJECTIVE:
This paper aimed to create and verify an alternative, less resource- and time-demanding, non-invasive solution.
METHODS:
The determination of FFR is based on the application of the fundamental laws of fluid dynamics. All energy losses in the coronary artery with stenosis were identified and analyzed in detail. A three-dimensional model of a coronary artery was generated using the corresponding angiographic images. Finally, the pressure due to stenosis was calculated and the FFR was determined.
RESULTS:
The results obtained using the proposed analytical method were compared with available experimental data for 40 patients who experienced the invasive coronary angiography. The coefficient of determination, mean difference and standard deviation values are determined to be 0.726,
CONCLUSION:
The FFR calculated by the proposed analytical method has a relatively good correlation with clinical data, which leads to the conclusion that it can provide a reliable assessment of the functional significance of coronary stenosis.
Introduction
Coronary artery disease is the most common type of cardiovascular disease. In more than 95% of cases, it is caused by arteriosclerosis that narrows the coronary arteries that supply the heart with blood and oxygen [1]. Atherosclerosis is caused by deposition of fibrous tissue, cholesterol, calcium and other substances contained in the blood, which creates an atherosclerotic plaque inside the blood vessels.
Atherosclerosis most often begins at an early age, and the intensity of its development depends both on genetic predispositions and lifestyle habits. A diet low in fibre and high in fat and cholesterol, followed by smoking, insufficient physical activity, obesity, and stress are the main risk factors for the onset and development of coronary artery disease.
Since the heart muscle uses efficiently oxygen from the blood, coronary disease often develops significantly before its first symptoms appear. Blood vessels can be blocked by more than 70% (sometimes up to 90%) without any warning signs appearing. In the case of a sudden blockage of the coronary arteries, a heart attack occurs (myocardial infarction).
Early diagnosis and adequate treatment of this disease are crucial because it can prevent complications in patients [2]. It is estimated that at least 80% of premature deaths caused by cardiovascular diseases could be prevented by timely diagnosis and treatment, as well as by controlling the main risk factors [3]. Elevated levels of triglycerides and LDL cholesterol have also been identified as reliable markers of cardiovascular disease risks [4]. In pediatric cardiology, an uncharacteristic heart murmur can be a sign of congenital heart defects. Begic et al. [5] developed an organic murmurs classifier based on machine learning algorithms.
Many methods and procedures, both invasive and non-invasive, are used for diagnosing and monitoring coronary artery disease [6]. Some of them, such as electrocardiography (ECG) or echocardiography, can indicate certain irregularities in the work of the heart muscle, but, in general, they cannot give a reliable assessment of the functional severity of coronary stenosis. However, there are diagnostic methods (invasive and non-invasive), that allow for a much more reliable description of the coronary circulation system and allow precise localization of stenosis in the coronary arteries. These methods include coronary catheter angiography, scintigraphy, magnetic resonance imaging and computed tomography coronary angiography (CTCA) [7].
For years, invasive coronary angiography (ICA) was considered the gold standard for the diagnosis of coronary artery disease. Invasive coronary angiography uses X-rays to make image of blood vessels [8]. For the blood vessels to become visible and, thus, to diagnose possible blockages (stenosis), it is necessary to inject a contrast agent (liquid dye) into the coronary artery.
Since the application of the invasive method is inconvenient for patients (including the risk of blood vessel injuries), and also requires additional time and costs, efforts were made to develop alternative (non-invasive) methods that would be sufficiently reliable at the same time. Research has shown that CTCA can be a non-invasive and relatively inexpensive diagnostic tool to identify the presence of coronary stenosis [9]. CTCA is used to visualize the coronary arteries in order to determine if there are any restrictions on blood flow to the heart. It uses state-of-the-art CT scanners and allows for 2D and 3D visualization of the coronary arteries.
Although visual assessment of stenosis based on images provides information about its existence and severity, coronary angiography cannot provide the most accurate assessment of the functional significance of stenosis [10]. It might underestimate or overestimate the narrowing of a coronary artery. Also, according to Patel [11], during ICA angina pectoris is not visible in nearly 40% of patients. Therefore, decisions regarding the treatment of coronary artery disease (drugs, percutaneous coronary intervention or surgical revascularization) should be based on a physiological and not on an anatomical assessment of the significance of coronary lesions.
Fractional flow reserve (FFR)
To overcome the aforementioned shortcomings, additional algorithms have been developed. Among the parameters that have been established to assess the state of the coronary artery, FFR, first proposed by Pijls [12], stands out for both its wide use and the reliability of the assessment it provides. FFR has an advantage over other techniques used to estimate the stenosis severity. For example, these techniques cannot take into consideration the possible existence of collateral flow that may render the observed stenosis physiologically insignificant.
Originally, Pijls defined FFR as the ratio between the maximal myocardial flow through the artery containing a stenosis (
Equation (1) can be expressed in another form [12]:
where
The FFR value ranges between 0 and 1 [13]. In the case of a coronary artery without any occlusion, the FFR
Numerous studies have shown that there is certainly variability in how one and the same FFR value is reflected both in different patients and in the case of different conditions of individual coronary arteries in the same patient. The vast majority of authors generally agree that coronary stenosis is not functionally significant if FFR
There are, however, different approaches when dealing with values 0.75
The literature reports various analytical models developed to determine the pressure drop across the stenosis, which is necessary to calculate FFR. Mainly, all analytical models are based on the energy conservation law assuming incompressible fluid flow. Stenosis is considered as a local resistance to fluid flow that causes a corresponding pressure drop.
Garcia et al. [19] use the following equation to determine the pressure drop across stenosis:
where
Lyras and Lee [20] propose the following equation for calculating the pressure drop:
where
Seeley and Young [21] use the model similar to Eq. (4):
where
Itu et al. [22] tried to improve the previous model [21] and proposed to calculate the viscous resistance
where
Here,
All aforementioned models rely on certain empirical coefficients and show modest agreement with experimental data obtained using standard invasive procedure.
Huo et al. [23] aimed to improve the reliability of analytical models and introduced a method that is also based on the law of conservation of energy but does not contain any empirical parameters. In addition, they analysed in more detail the total pressure drop at the stenosis and took into account the following pressure losses:
where
Research has been conducted in vitro using inflatable cuffs to simulate different intensities of stenosis, while research aimed at verifying the proposed method was performed in vivo on pigs by simulating coronary artery narrowing also by inserting appropriate cuffs. A quite solid agreement of the results was observed.
Zhang et al. [24] proposed an analytical method that relies only on CTCA images. Using these images, a 3D model of the coronary artery is generated, on the basis of which all the necessary anatomical characteristics that define the hemodynamics of coronary arteries with stenosis are determined (minimum cross-section of stenosis, length of stenosis, angles of its narrowing and widening, lumen surface) [25]. The pressure drop
Corresponding pressure drops,
where
They reported a satisfactory correlation between the results obtained using this analytical method and the results obtained by the standard invasive method.
Milovanovic et al. [26] combined the models proposed by Huo et al. and Zhang et al. They used CTCA images to generate a 3D model of a coronary artery with stenosis, while to calculate the pressure drops they used the approach presented by Huo et al. [23]. Verification of the results was carried out by comparing them with clinical results.
Determination of FFR based on CT coronary angiography and computational fluid dynamic (CFD) technique certainly represents a great progress in efforts to assess the importance of coronary stenosis using a non-invasive approach to this problem. As already mentioned, this kind of procedure is very resource- and time-consuming (one analysis takes up to several hours), which is why the conditions for its widespread application in clinical practice have not yet been created [27]. This is the main reason to continue conducting research in order to find simpler, more efficient alternative solutions that could provide satisfactory diagnostic accuracy.
The FFR is calculated using the following formula [23]:
where
The overall pressure drop is the sum of the following component pressure drops:
where
Stenoses of various lengths (
Here,
Illustration of (a) thin stenosis; (b) short stenosis, and (c) long stenosis.
It should be noted that, instead of the value
The dimensionless radius
The drop of pressure due to convection can be calculated as [29]:
where
In case of uniform flow in front of the stenosis (this occurs when the stenosis is located close to the aorta, so there is no space to establish a fully developed flow), the pressure loss due to a sudden narrowing of the coronary artery can be calculated according to the formula [30]:
where
In case the length proximal to the stenosis is sufficient to establish a fully developed flow (with a parabolic velocity profile), the pressure drop can be calculated by the formula [31]:
where
The loss of pressure due to diffusion here means the sum of pressure drops that occur due to friction and acceleration of the flow [23]. When on the entire length of the stenosis (
However, when at some length from the entrance to the stenosis (
In this case, the pressure drop due to acceleration (13) is added to the corresponding pressure loss due to friction on the part of the stenosis with fully developed flow, which is calculated according to the Poisei formula [32]. At the same time, the value
Since aortic pressure appears in the expression for FFR, for its correct determination it is necessary to take into account (in addition to the pressure drop at the stenosis) the pressure drop due to friction in the healthy part of the artery proximal to the stenosis, to the aorta itself. This part of the pressure drop is also calculated according to the Poisei formula, so the total pressure drop due to diffusion that occurs in the observed part of the artery with stenosis is:
a) for
b) for
where
According to the shape of the velocity profile at the exit from the stenosis, several cases are distinguished. In case the velocity at the exit from the stenosis is uniform across the cross-section (Fig. 1a), the pressure loss due to sudden expansion is calculated according to the Borda-Carnot formula [33]:
In case of the paraboloid velocity profile (Fig. 1c), to calculate the pressure drop due to sudden expansion, Oliveira and Pinho [34] proposed the following formula:
In case the velocity profile is insufficiently developed (blunt profile) at the exit from the stenosis (Fig. 1b), the pressure loss due to sudden expansion is obtained by interpolation, as follows:
that is, taking into account expressions (21) and (22) valid for the previous two velocity profiles:
The pressure drop at the stenosis is the sum of the pressure losses due to diffusion and expansion. In case
In case
Total drop in pressure in the coronary artery with stenosis is determined using Eq. (15).
In case
In case
The necessary geometrical inputs (the length of stenosis, minimal cross-section of the stenosis, the cross-sections of coronary artery proximal and distal to the stenosis, the length of the artery proximal to the stenosis) are obtained on the basis of angiographic images (by which a 3D model of the coronary artery is generated using comercial software such as Materialise Mimics 10.01 and Geomagic Studio 10). A Siemens Somatom Dual Source 256 scanner was used to obtain 2D CT scans.
Blood was considered as an incompressible Newtonian fluid with a dynamic viscosity of
Flowchart for determination of FFR in a coronary artery with stenosis.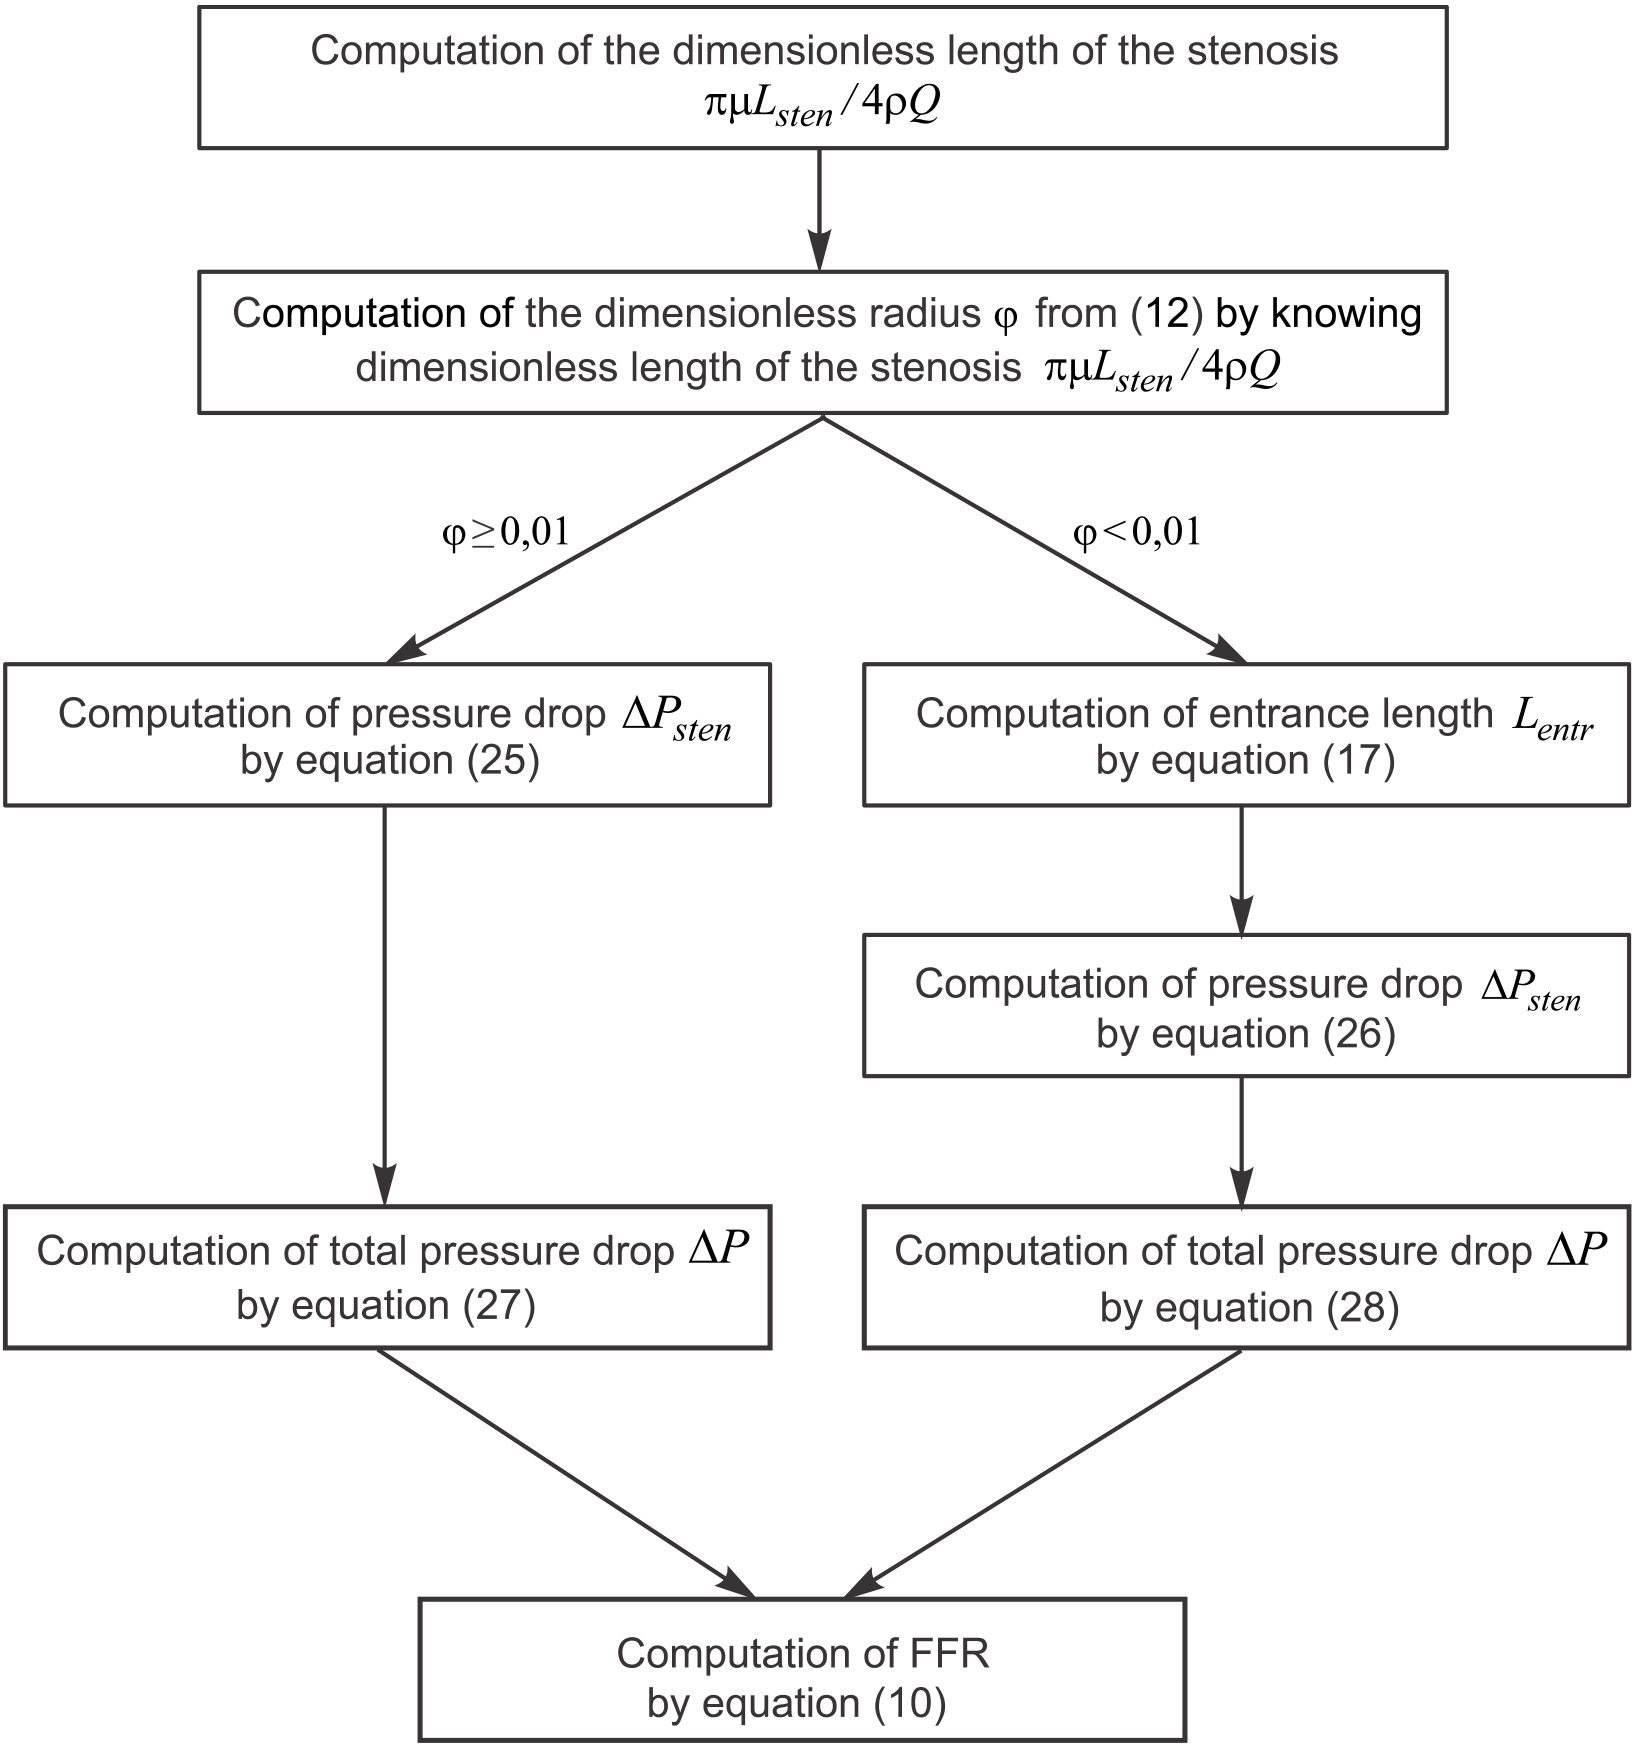
The algorithm for determining the pressure drop in a coronary artery with stenosis, needed to calculate the FFR, is shown in Fig. 2.
Using the proposed analytical model, aFFR values were calculated for 40 patients whose angiographic images and corresponding invasively measured FFR (mFFR) data were available. The length of stenoses varied from 3.2 mm to 21.8 mm, while the minimum diameter ranged from 0.9 mm to 2.4 mm.
The results obtained using the proposed analytical method were compared with available invasively measured values. The pressure was measured using the corresponding pressure wire (Pressure Wire; RadiMedical Systems Inc., Uppsala, Sweden). To prevent vasospasm of the coronary artery and induce maximal hyperemia, before advancing the pressure wire, intravenous administration of adenosine at a dose of 140
Invasively measured values for FFR indicated that (out of a total of 40 patients) the stenosis was not functionally (physiologically) significant (FFR
The analytical model indicated that the coronary stenosis was insignificant in 17 patients, that the values were in the “gray zone” in 7 patients, while functionally significant stenosis (requiring coronary artery revascularization) was identified in 16 patients. However, four patients are overlapped in the “grey zone” both invasively and analytically.
When FFR values
A linear regression analysis between invasively measured (mFFR) and analytically computed (aFFR) fractional flow reserve is shown in Fig. 3. A fairly good correlation between two data sets was observed. A least squares fit led to the rellation mFFR
A linear regression analysis between invasively measured (mFFR) and analyticaly computed (aFFR) fractional flow reserve.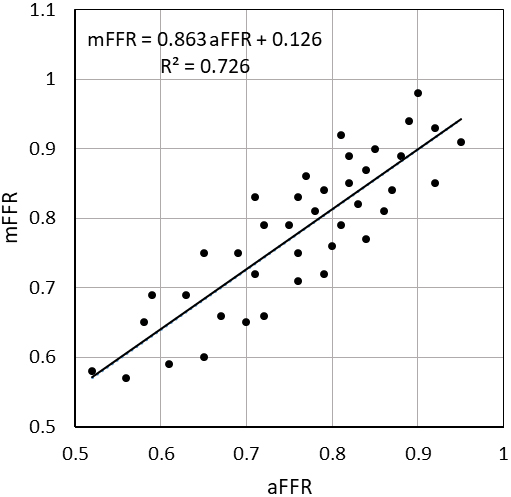
Figure 4 shows Bland-Altman plot of invasively measured (mFFR) versus analytically computed (aFFR) fractional flow reserve, where mean FFR difference and standard deviation are
Bland-Altman plot of invasively measured (mFFR) versus analytically computed (aFFR) fractional flow reserve.
It was shown that the diffuse energy loss that occurs in the entry region of the stenosis contributes the most to the total pressure drop in coronary stenosis. This loss is primarily caused by energy loss due to friction and accelerates the flow in the inlet region. With the increase of the boundary layer, starting from the entrance to the stenosis, the velocity profile changes too. Depending on the length of the stenosis at its end, a parabolic profile (fully developed flow) or a blunted velocity profile is achieved. This was especially pronounced in the case of longer stenoses, where diffuse loss comes to the fore. The obtained results show that in that case, energy loss due to diffusion is responsible for at least half of the total pressure drop. The models that did not properly take this effect into account [21] resulted in a significantly lower pressure drop than that shown by experimental data.
It was observed that the FFR value does not have to be proportional to the narrowing of the coronary artery cross-section due to stenosis. The pressure drop, and thus the FFR, is significantly affected by the length of the stenosis. Due to the diffusion losses, a moderate degree of stenosis combined with its relatively long length (
The main clinical benefit of the analytical model is the very short time required to obtain the final results. The computation time using a single CPU was about 2 min, which is significantly less than in the case of invasive or numerical methods. This significantly shortens the time needed to assess the functional severity of the stenosis, and thus the time necessary to undertake the appropriate treatment of patients (surgical revascularization, percutaneous coronary intervention or just drug treatment), which is often a decisive factor for their recovery.
On the other hand, the lack of analytical methods is its lower accuracy when compared to CFD techniques. This applies especially to stenoses with a higher degree of occlusion. However, in the case of such severe stenoses, no further tests are necessary, but a decision on the need for revascularization can be made based on a visual examination of the angiographic image. Additionally, the limitation of the proposed analytical model is that it can only be applied in case of a single stenosis in the coronary artery. In the case of multiple, serial stenoses due to mutual interaction, the current picture in the proximal and distal stenosis changes to a certain extent, depending on their severity and mutual distance. This would lead to a significant error in the result.
Fast and reliable diagnosis of myocardial ischemia is crucial for the treatment of heart patients. Invasive coronary angiography, which has been accepted as a reference standard, has, however, some disadvantages, such as the risk of vascular injuries, the need for vasodilation, and significant medical costs.
On the other hand, determining FFR based on the CFD technique, despite its significant advance in pursuing a non-invasive approach to diagnosing myocardial ischemia, is very resource- and time-consuming. Although with less accuracy, the analytical methods have appeared as an alternative solution, especially when a fast assessment of the stenosis severity is required.
The FFR calculated by the analytical method proposed in this paper shows a good correlation with the available clinical data, implying it can provide a reliable assessment of the coronary stenosis functional significance (severity). Also, the results obtained have similar accuracy as the two referent analytical models [23, 24].
Finally, it should be noted that for a more reliable verification of the proposed analytical method, a larger sample is needed, which will definitely be the subject of further research.
Footnotes
Acknowledgments
This research was funded by the Ministry of Science, Technological Development and Inovation of the Republic of Serbia (contract number: 451-03-65/2024-03/200107; Faculty of Engineering, University of Kragujevac).
Conflict of interest
The authors declare that they have no conflict of interest.