
Abstract
BACKGROUND:
Several different video Head Impulse Test (vHIT) systems exist. The function of each individual semicircular canal (SCC) may be determined by performing this test. All vHIT systems provide information about the function of the vestibular ocular reflex by means of two modalities: SACCADES and GAIN. However, different gain calculation methods exist.
OBJECTIVE:
Primary endpoint:
Is instantaneous gain or regression gain the most reproducible and reliable gain value when performing vHIT with testing of the lateral SCCs?
Secondary endpoints:
Comparison of each of the instantaneous gain values at 40, 60, and 80ms with the regression gain. Examination of any intra- and inter examiner variability. Mean instantaneous gain values, and at different velocities, compared with regression gain values of the lateral SCCs.
METHODS:
60 subjects between 18–65 years were included. All patients filled out the Dizziness Handicap Inventory (DHI) questionnaire and underwent four separate vHIT tests, two by an experienced neurotologist and two by an inexperienced examiner.
RESULTS/CONCLUSIONS:
240 datasets were obtained, displaying both regression and instantaneous gain values. Regression gain was more reproducible than instantaneous gain. The experienced examiner provided the most reproducible results.
When comparing instantaneous gain, we found the gain at 40 ms to be the least reproducible. There was no significant difference between 60 ms and 80 ms.For both examiners no significant intra examiner variability was found.
Keywords
Introduction
During the last three decades, the video Head Im-pulse Test (vHIT) has gone from a laboratory modality, using scleral search coils, to a well incorporated vestibular testing tool in the clinical setting [3, 6]. vHIT is based upon the principles of the Head Impulse Test (HIT) but is a more precise and sophisticated analysis that enables assessment of the peripheral vestibular system by means of examination of the Vestibular Ocular Reflex (VOR). The VOR ensures the ability to maintain visual focus on a target while the head is in motion e.g. when the head is turned in one direction the eye will make a corrective movement in the opposite direction. If the VOR is compromised by a loss or a hypofunction within the peripheral vestibular system (e.g. by vestibular neuritis), the eyes will not be able to maintain focus on a target during head motion, but will instead make a compensatory delayed catch up movement termed a SACCADE. If the compensatory eye movement occurs after the head turn has stopped, this is termed an OVERT saccade. This type of saccade is also visible to the experienced clinician when performing the bedside HIT. On the contrary, the COVERT saccades, where the compensatory eye movements occur during the head movement, cannot be detected by the naked eye. The function of each individual semicircular canal may be determined by performing vHIT testing of all six semicircular canals (SCCs) for which one of the systems has been validated against the scleral search coils –the gold standard of VOR testing [11, 13]. The vHIT elucidates the occurrence of saccades as well as the function of the VOR by calculation of the GAIN value (the ratio between eye and head velocities) [6, 13].
Several different vHIT systems have been deve-loped during the past decade. However, the contemporary vHIT systems use different methods for calculation of the gain values. While regarding the scleral search coil systems as the “gold standard” for tracking eye movement in three dimensions [2, 3], no such standard has been agreed upon in calculation of the gain value by the different vHIT systems. The individual vHIT systems use different algorithms for calculation of gain values as well as different criteria for automatic data selection of the individual head impulses applied [4]. The vHIT system used in this study calculates the gain values in two different ways: 1) Instantaneous gain that represents the gain value at a specific latency (40 ms, 60 ms, and 80 ms) after the initiation of the head impulse. 2) Regression gain that represents a regression analysis of all measured head velocities and their coherent gain values, using a best fitted line through these data plots. Other vHIT systems use gain calculation methods such as the “area under the curve” (AUC) gain calculation method which measures an average of the eye-over-head velocity during the entire impulse, and some vHIT systems use the positional gain calculation method, which is a variant of the AUC [8, 9]. Even though several studies have compared different gain calculation methods and possible factors known to alter these gain values, it is difficult to compare gain values obtained by separate vHIT systems since the calculation of the gain value differs between vHIT systems. One study has shown that individual vHIT systems achieve the same mean gain values as long as the same gain calculation method is applied [4].
Objective
Primary endpoint
To investigate and compare whether
Secondary endpoints
Comparison of each of the instantaneous gain values at 40 ms, 60 ms, and 80 ms with the regression gain values of the lateral SCCs. Furthermore, we examined if there was any significant intra- or inter examiner variability when comparing gain values between an inexperienced examiner (medical student) and an experienced examiner (neuro-otologist with several years of experience with vHIT testing). Mean instantaneous gain values at different head velocities were also compared to regression gain values of the lateral SCCs.
Materials and methods
Study design
Prospective cross-sectional study.
Materials
The vHIT system EyeSeeCam® from Interacoustics©, Denmark (software version 1.2.0.001) was used to perform all vHIT tests [8]. The video Frenzel goggles VF 405® from Interacoustics, Denmark was used to rule out any nystagmus or eye muscle disorders prior to testing [7].
Study population
Subjects between 18–65 years, without any known vestibular disorders, were assessed for eligibility. For population characteristics please refer to Table 1. Participants recruited for this study included patients with a scheduled appointment at the Department of Otolaryngology, Head & Neck Surgery and Audiology and staff. Prior to enrollment, all subjects were tested with video Frenzel goggles to rule out any spontaneous or gaze induced nystagmus (with and without fixation) as well as eye mobility disorders. Emergence of any of these pathological findings, following the eye examination, led to exclusion. Finally, all subjects filled out the Dizziness Handicap Inventory questionnaire (DHI) prior to examination, excluding those with a score of 15 or above. For a complete list of exclusion criteria please refer to Fig. 1.
Background Characteristics and Mean Gains
Background Characteristics and Mean Gains
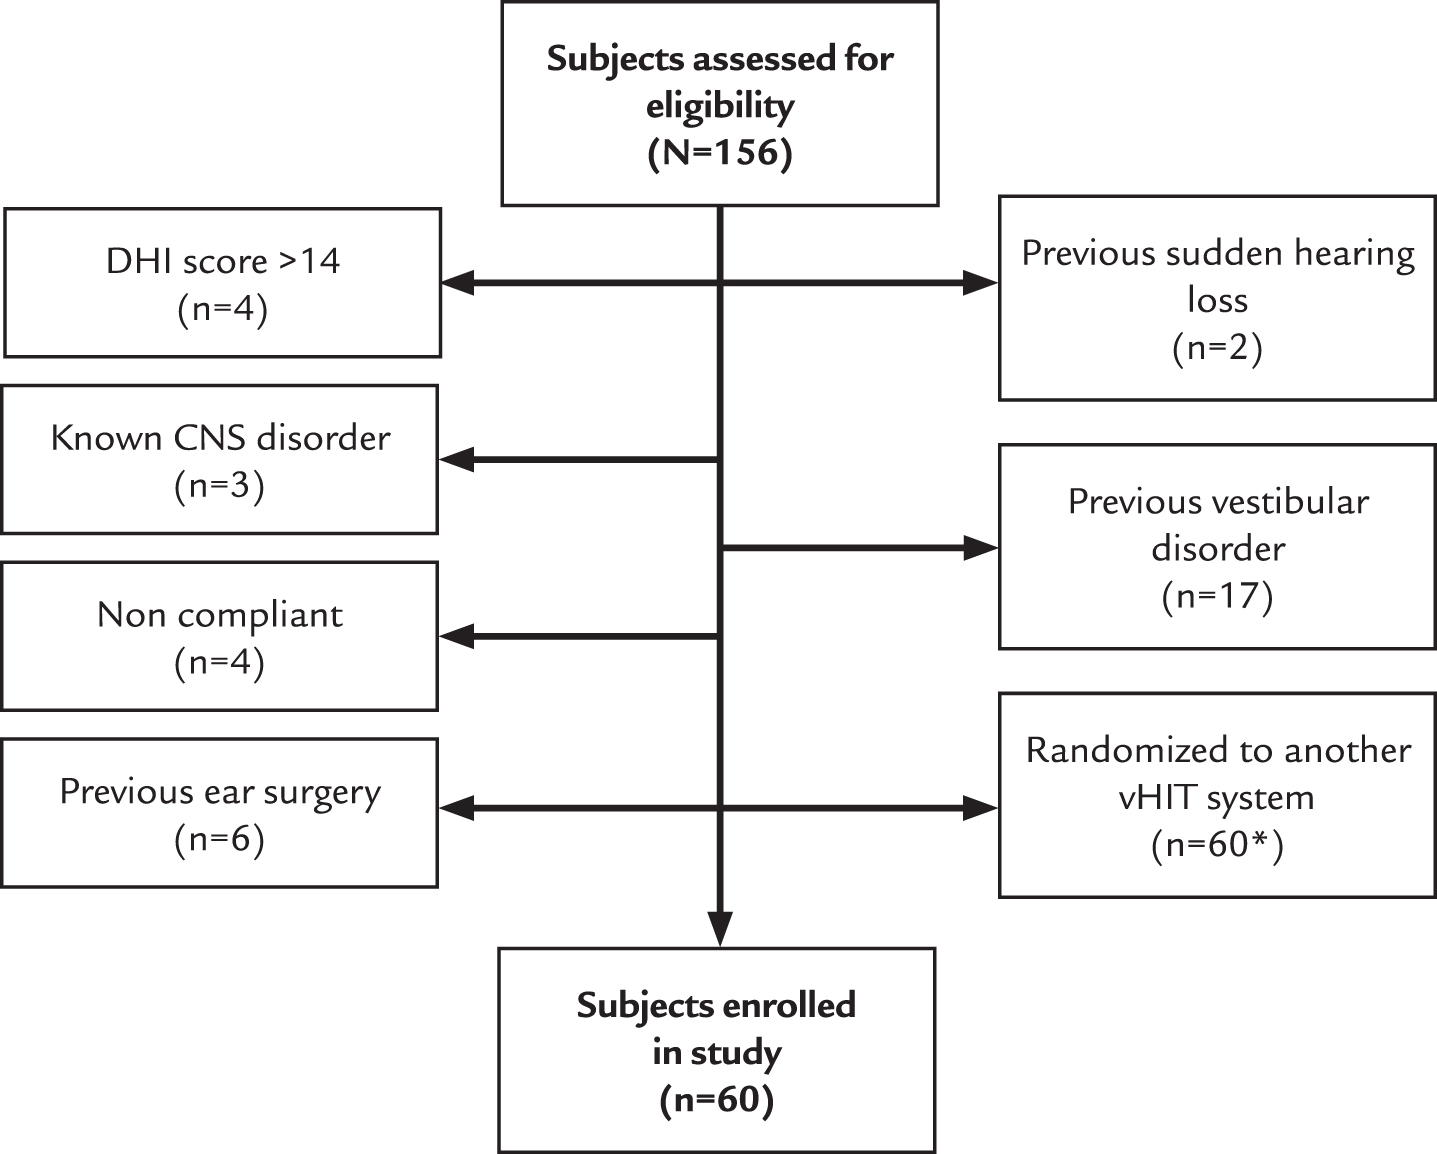
Trial Profile *[1].
Procedure
Both an experienced and an inexperienced examiner performed all the vHIT tests. The experienced examiner was an ENT specialist with more than five years of clinical practice with neuro-otology and vestibular research as well as a lot of hands on experience following completion of several hundred vHIT tests with the vHIT system used. The inexperienced examiner was a medical student with only one hour of training with the system prior to testing.
The experiment was performed in a well-lit room ensuring the optimal light conditions for pupil tracking (miotic pupils).
The subjects were placed in a sturdy chair at a distance of 1.5 meters from the wall. Markings on the floor ensured correct and similar placement of the chair during all tests. Three markings were put on the wall at different heights for eye fixation during the test, ensuring that the fixation point was at the optimal eye level for the individual subject [6]
All sixty subjects underwent four separate vHIT tests, two by each examiner including assessments of both lateral SCCs with each test. A randomization of initial examiner preceded each subject's individual vHIT testing and the order of SCC testing was random for all four vHIT tests carried out with every subject. Calibration was done according to the manufacturer’s recommendations before each test [8]. Both examiners performed 15 head impulses to each side to ensure a minimum of ten head impulses, taking into account that the EyeSeeCam® software would reject some head impulses following completion of each test. For each individual SCC being tested, we aimed for a minimum of ten head impulses following automatic and manual data selection. Following each test, the experienced examiner reviewed the data set and head impulses with too much interference or obvious artefacts were removed to secure the most valid gain calculation. For the mean number of head impulses for both examiners refer to Table 2.
Number of head impulses following automatic and manual data selection
Number of head impulses following automatic and manual data selection
RL = Right Lateral SCC, LL = Left Lateral SCC, M = Mean, SD = Standard Deviation. In total between 1.0 and 3.3 head impulses were removed following automatic and manual data selection.
From a neutral head position, unpredictable and abrupt horizontal head impulses were delivered at a 20-degree angle to the left and right sides. These head impulses were randomly administered at different head velocities between 150–300 degrees/second [17]. Both examiners were placed behind the subject during the test. When delivering the head impulses, the hand placement was on the chin along the jaw line carefully avoiding touching the goggle strap. Both examiners were right-handed. The camera attached to the goggle was placed over the right eye as standard.
Gain values between 0.8 –1.2 were considered within the normal range [13]. All test reports were meticulously reviewed removing any artifacts or noise by the experienced examiner. The appearance of saccades (overt or covert) were registered and the following criteria were set for defining a pathological saccade: Must appear within 100 ms after onset of the head movement, but no later than 100 ms after head movement stops. Must be present in at least half of the impulses. Must have an amplitude of at least half the velocity of the head movement. Must be in the opposite direction of the head movement [1].
An example of a normal vHIT report from the EyeSeeCam, showing both the instantaneous gain and the regression gain can be seen in Fig. 2 an enhanced section of the regression gain and the data plots used for the analysis can be seen in Fig. 2a.

EyeSeeCam report for the lateral SCCs. Upper left: An example of a complete examination of the lateral SCCs done with the EyeSeeCam. Head- and eye velocities and the number of accepted head impulses are shown in the colored boxes. Upper right: Regression gain. Buttom left: Instantaneous gain values (at three different head velocities). Bottom right: Gain values depicted according to concomitant head velocities.
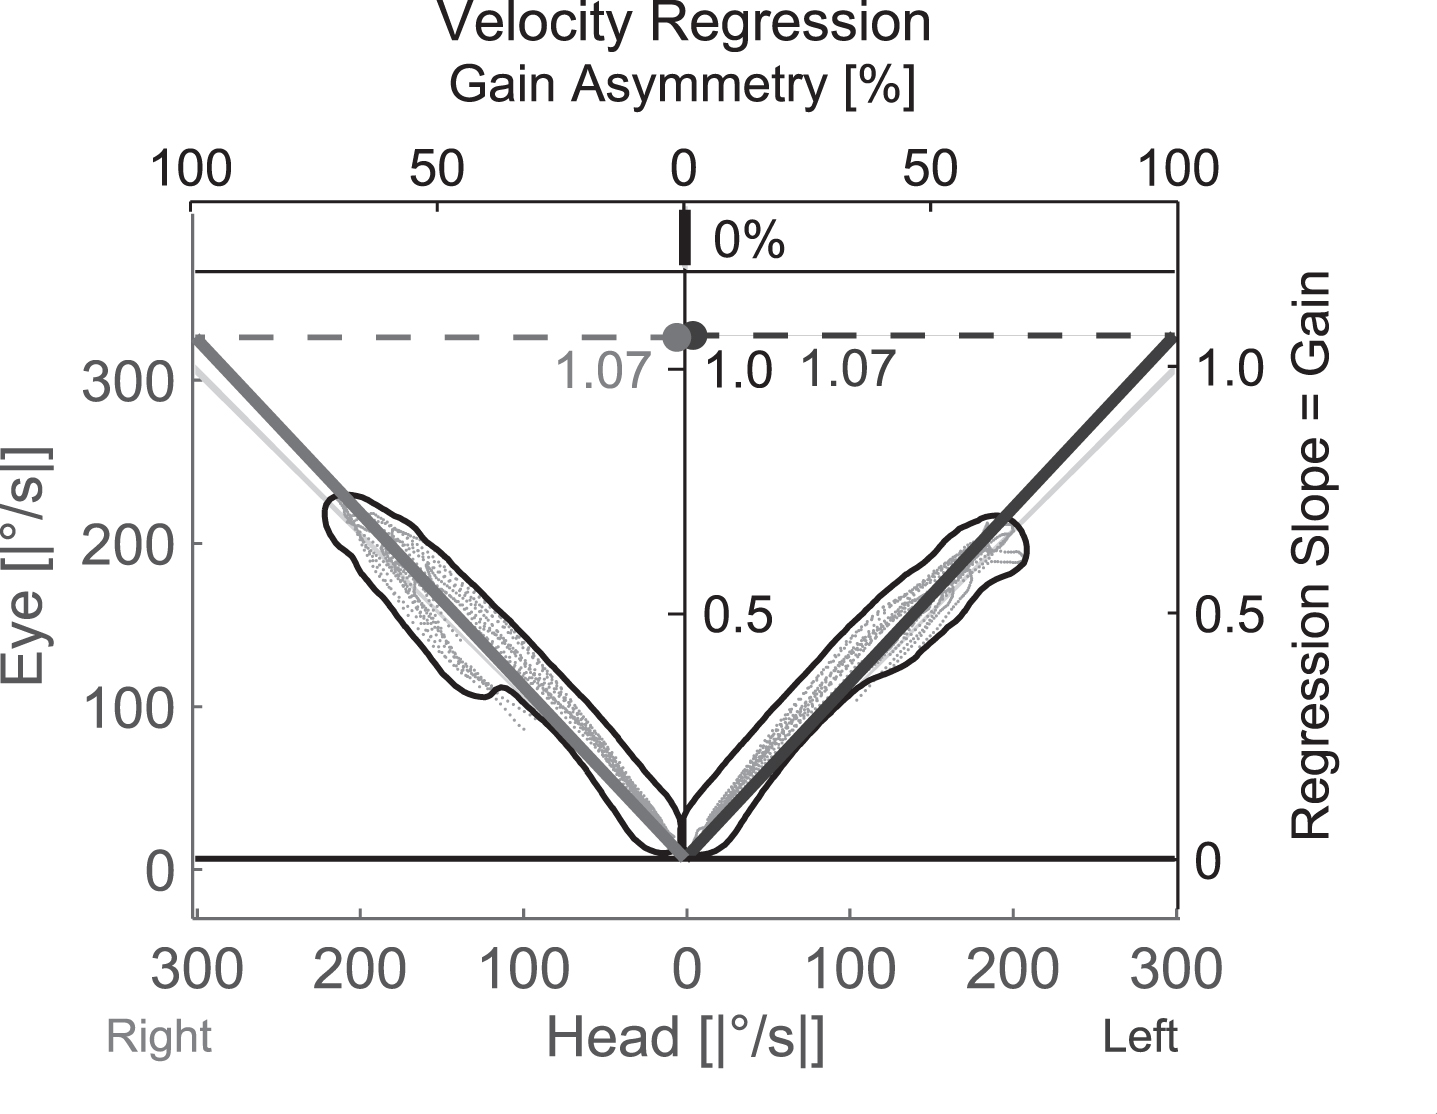
Regression Gain. Enlarged section of the EyeSeeCam report showing the datasets used to calculate the regression gain by a best fitted line through these plots. Gain = Regression slope.
Standard deviations of repeated measurements of gain values were computed within each subject for regression gain and instantaneous gains (40 ms, 60 ms, 80 ms), respectively. Linear mixed effects models were fitted to the data, with standard deviations of the gain values as outcome and the type of gain (regression /instantaneous gain) as exposure of the primary endpoint.
Models were adjusted for SCC (left lateral or right lateral). Patient ID was included as random effect. To investigate the secondary endpoint, the type of exposure was further divided into the groups: regression gain, and instantaneous gain at 40, 60 and 80 milliseconds, respectively. Models were fitted with regression gain and instantaneous gain 60 milliseconds as reference, respectively.
Interactions between SCC and standard deviations of gains were tested for all models. Inter examiner variability was tested by adding the examiner as a fixed effect in the linear mixed effects model. For this analysis, standard deviations of the gain values were computed for repeated measurements within each subject and within the two clinicians respectively. Differences between gain values as well as the average gain value within examiner were computed to describe the intra examiner variability using a Bland Altman plot. All analyses were carried out in R version 3.4.1 [21].
Results
The distribution of the standard deviation of gain values for each subject is shown in the boxplots in Figs. 2 and Fig. 3.
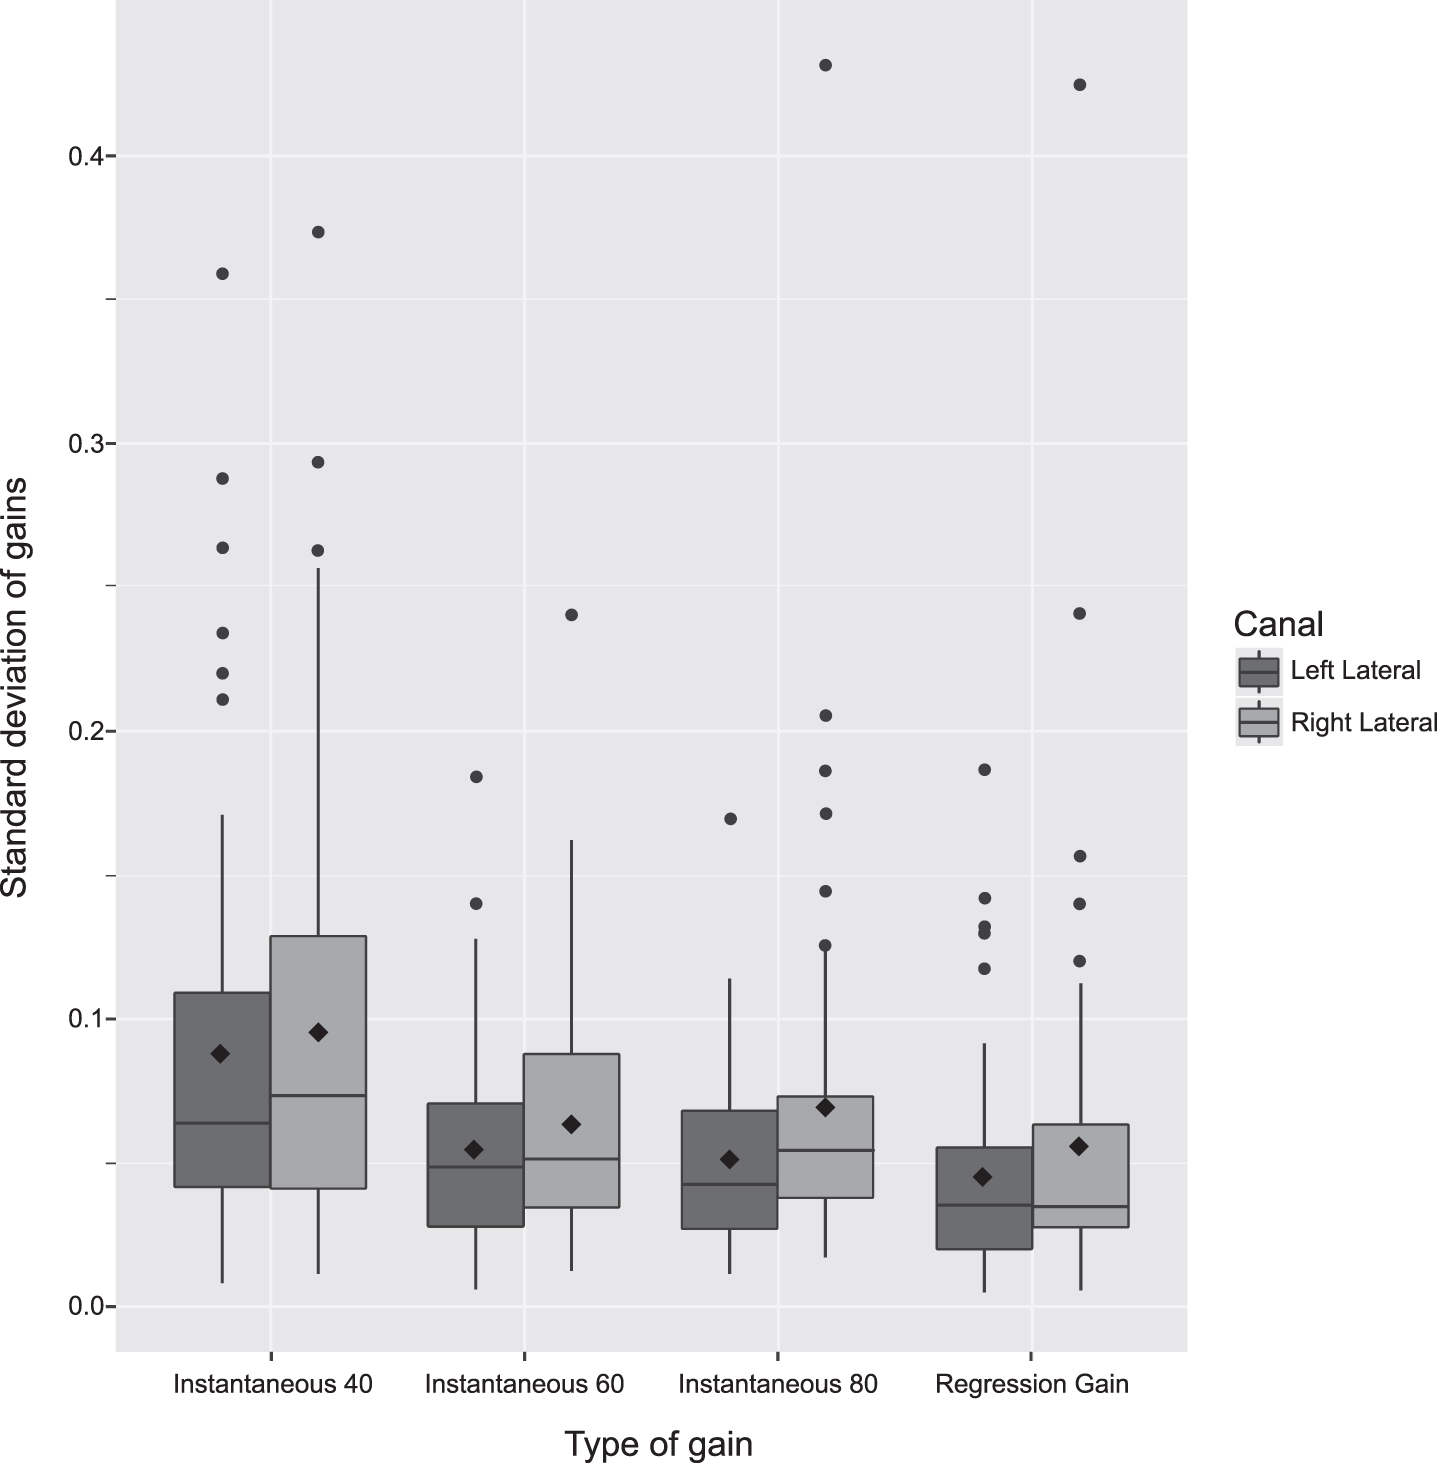
Mean standard deviation of lateral SCC gains according to different gain calculation methods. Red and blue boxes represent distribution of standard deviations. Lower edge of the box defines the value of the first 25 percent of the data. Upper edge of the box represents 75 percent of the data. The horizontal line through the box is the median, and the diamond represents the mean. Vertical lines from upper and lower part of each box marks the highest and lowest value within the 75/25 quartile times one and a half. Dots are outliers. Note: Significant deviation of the instantaneous gain at 40 ms compared to regression gain was found.
When comparing instantaneous gain with regression gain, a significant difference in standard devia-tions was found. SD difference between the mean gain values was found to be 0.02 (95% confidence interval (CI): 0.011;0.029) p-value < 0.001. When subdividing the instantaneous gain into the categories 40, 60 and 80 ms, and comparing each of them with regression gain, the instantaneous gain at 40 ms revealed a significantly higher SD than the regression gain. In this case the mean SD difference was found to be 0.041 (95% CI: 0.031;0.052) p-value < 0.001. Refer to Table 3.
Neither standard deviations of instantaneous gain at 80 ms nor regression gain were significantly different from standard deviations of instantaneous gain at 60 ms, when using instantaneous gain at 60 ms as the reference, see Table 4.
For both primary and secondary endpoints, a significant difference between the SCC was found, with the right lateral SCC having higher standard deviations than the left lateral SCC, see Tables 3 and 4. There were no significant differences for the SCCs when comparing the experienced to the inexperienced examiner.
Instantaneous gain with regression gain as reference
Gain differences (SD) when comparing the Instantaneous Gain (and subtypes) to Regression Gain. SD = Standard Deviation, CI = Confidence Interval. Significant p-values shown in italic.
Instantaneous mean gain values at 40 ms and 80 ms compared to mean gain values at 60 ms
SD = Standard Deviation, CI = Confidence Interval, Significant p-values shown in italic.
The inter examiner variability was, for the primary endpoint, estimated to be a difference in standard deviation of –0,007 (95% CI: –0.0131;–0.0002) p = 0,044 when comparing the instantaneous gain to the regression gain and including the clinician as a fixed effect. Suggesting a small but significant deviation in favour of the experienced examiner. When subdividing instantaneous gain values by different latencies (40, 60 and 80 ms) with a concomitant comparison to regression gain (clinician included as a fixed effect), a significant difference was observed at 40 ms, 0.032 (95% CI 0.0228;0.0407) p = <0.001 and at 80 ms, 0.009 (95% CI 0.0005;0.0184) p = <0.039.
Limits Of Agreement (LOA) for the intra examiner variability for both examiners can be found in the Bland Altman plot in Fig. 4 and in Table 5. Narrow LOAs were found for both examiners with the left lateral SCC for both the regression gain and the instantaneous gain at 80 ms. The widest LOAs for both examiners were seen at 40 ms.

Lateral SCC mean gain standard deviations for different gain types by examiner. Red and blue boxes represent distribution of standard deviations. Lower edge of the box defines the value of the first 25 percent of the data. Upper edge of the box represents 75 percent of the data. The horizontal line through the box is the median, and the diamond represents the mean. Vertical lines from upper and lower part of each box marks the highest and lowest value within the 75/25 quartile times one and a half. Dots are outliers.
Mean Difference and±LOA for each SCC and gain type, by examiner
LOA = Limits of agreement, SCC = Semicircular Canal. The LOAs for the experienced examiner for all right SCCs are lower compared to the inexperienced examiner, who in return has lower LOAs for two of the left SCCs suggesting that they are better at reproducing each side. The experienced examiner has the lowest mean difference for both SCC’s when comparing the regression gain between the two. Thereby achieving a larger degree of reproducibility.
It is well established that vHIT has been validated by results similar to results with scleral search coils identifying hypofunction of the VOR thereby enabling easier diagnostics of peripheral vestibular disorders [11, 13]. When comparing vHIT test results with scleral search coils results, vHIT was found to be more prone to artefacts [11]. This underlines the importance of having the potential sources of errors in mind every time the vHIT testing is carried out; no matter if these sources are environmental, iatrogenic, and/or patient related. Seeking to eliminate or minimize these artefact triggers is crucial in order to obtain the most valid test results enabling both accurate calculation of gain values and determination of occurrence of pathological saccades.
The patient should be seated in a solid chair to avoid moving or rotating the chair while performing the head impulses. The fixation dot on the wall must be at eye level to the patient and at a distance of minimum 1.5 meters according to the manufacturers’ recommendations [7]. Mossman et al. found increasing gain values at distances below 0.7 meters from the eyes of the subject to the wall [18].
The EyeSeeCam vHIT system consists of a light-weight goggle with a high-speed infrared camera mounted (with options to mount on either left or right side). The camera is connected to a laptop using a firewire connection and the software for analysing the data was OtoSuite (version 1.2.0.001). It is of paramount importance that the goggle is firmly secured around the patient’s head, as slippage of the goggle is known to induce artefacts and thereby potentially alter gain measurements. Additionally, the facial configuration of the patient should be taken into account e.g. the nasal dorsum or the zygoma could also affect goggle placement. Suh et al. showed that the appearance of artefacts increase as goggle tightness decrease, and that a very tight strap provides the most consistent gain measurements [6, 22].
Thorough patient instructions are most important to attain a noise free examination. Patients should be instructed to focus on the fixation dot, which should be at eye level, relax their muscles in the cervical region and try not to blink during the head impulses. Mossman et al showed that it is unfavourable that patients know the direction of the head impulse prior to administering, as predictive head impulses yield an abnormal high gain value [18]. On the other hand, Yilmas et al did not find that awareness of timing nor direction of the head impulses affected gain values in any way [24]. In our opinion patients should try not to aid the examiner in any way e.g. by active head movement during the head impulses or try to predict timing or direction of head impulses. Blinking of the eyes may be hard to avoid completely, but the frequency may be reduced to a minimum with the right instruction and attention given to the patient’s cooperation e.g. taking a break during the test or maybe let the patient blink between each head impulse. Blinks or “mini-blinks” will appear as a pseudo saccade on the vHIT report [14].
Nystrøm et al. found a slight but significant in-crease in VOR gain for impulses starting from a neutral, perpendicular head orientation and to either side (outward), when comparing to impulses administered from the side towards the midline. Although inward impulses may apply less strain to the neck the orientation of the head impulse will be obvious to the patient [19]. Ylmaz et al. found no influence on the VOR gain in respect to the timing or orientation of the impulse being known to the patient [24]. The optimal hand placement, either on top of the head or on the chin with fingers following the jaw line, has been debated in previous studies, with some advocating head placement over chin. Korsager et al found no significance when comparing the two types of hand placement [10] while Patterson et al. found mean gain values to be higher for head hand placement technique and mean velocity gain values to be higher for chin hand placement [20]. In this study, both right-handed examiners used hand placement on the patient’s chin carefully avoiding touching the goggle strap.
The velocities of the head impulses for the horizontal SCCs should be between 150–300 degrees/second. At lower head velocities, the contralateral side (if healthy) will partially drive the VOR. In patients with bilateral vestibular loss the impairment of the VOR will be more apparent at lower velocities but in patients with unilateral vestibular loss the healthy side will compensate thus leading to a false negative examination [5, 23]. In our experience very high head velocities (above 300 degrees/second) seem to be associated with noise and more frequent appearances of artefacts. In regards to application of the head impulse, a known artefact trigger for the novice examiner is “overshoot”. Overshooting occurs when the examiner makes a brief reversal of the direction of the head at the end of the deceleration. Instead, the examiner should strive for a turn and stop like motion, carefully avoiding the bounce at the end, as overshoot may affect the amplitude of saccades negatively, thus making interpretation of the examination more difficult [12]. Mantokoudis et al found the overshoot or “bounce” to be the most frequent artefact when analysing 1358 vHIT examinations in 26 acute vestibular patients [14]. The second most frequent artefact in the same study was trace oscillations (suspected pupil tracking loss) stressing the importance of optimizing the tracking of the pupil. It may be necessary to fixate the upper eyelid if ptosis of the upper eyelid compromises tracking of the pupil. Securing that the room be well-illuminated, for optimization of pupil contraction and that the patients refrain from wearing mascara when being tested should also aid in minimizing the problems with pupil tracking [6].
Besides optimizing the conditions of pupil tracking it is important to ensure that the impulses are delivered within the same axis as the sensor measuring the head velocity, as a divergence from this of±10 degrees has shown to give false elevated gain values [6]. It is also important to align the SCC to the plane being measured; in the case of the horizontal SCCs this is achieved by a 30 degree flexion of the head while delivering the head impulses.
We did only compare the gain values of the horizontal SCCs, as the full dataset (instantaneous gain at 40, 60 and 80 ms) for the vertical canals were not provided with this contemporary version of the EyeSeeCam®. This should be investigated further in the future.
Gain
Despite the fact that several vHIT systems are now commercially available, only one vHIT system has been validated against scleral search coils for the testing of all six SCCs. (McDougall 2013, Halmagy 17). Traditionally, the gain value provides information of the individual SCC function by means of evaluation of the VOR [5]. Gain values are calculated by dividing the eye velocity by the head velocity during the head impulse. Theoretically, in a subject with normal vestibular function, this value should be one, as the eyes move counter directional to the head movement very fast. However, in the clinical setting, this has been proven not to be the case. For the horizontal SCCs, several normative data studies of healthy subjects have shown mean gain values as low as 0.76 and as high as 1.2 [1, 18]. As previously mentioned, several factors may affect the gain values. For instance, artefacts triggered by goggle slippage by means of either a loose strap or an examiner touching the goggles may significantly alter the gain calculation. As both the high-speed camera tracking the pupil and the accelerometer are incorporated in the goggle, a movement of these will produce a false eye and head velocity, representing movement when there is none. This can be seen as a biphasic pattern on the head impulse with a lead then lag configuration [6, 22].
Despite the fact that all vHIT systems assess the function of the VOR, evaluation of the head impulses and the methods of gain calculating differ between individual vHIT systems. The ICS impulse® (Otometrics) uses an area under curve (AUC) calculation method where the average instantaneous gain during the entire head impulse is calculated. Visual Eyes® (Micromedical) uses position gain, the degrees of eye rotatation during the start of the impulse until the start of a corrective reset saccade over the total degrees of head rotation [4]. The EyeSeeCam® (Interacoustics) calculates gain values in two different ways by means of instantaneous, and regression gain [8]. Instantaneous gain describes the gain value at a specific latency (40 ms, 60 ms, and 80 ms) after the initiation of the head impulse. Regression gain describes a set of measurements within a specific time interval that starts 10 ms after the initiation of the head impulse (t = 0 ms) and ends 100 ms following initiation of the head impulse. T = 0 ms is defined as the point where the head velocity exceeds 20°/s. The area of measurement (100 ms) contains 22 datasets, as the camera's framerate is 220 Hz. These datasets are then extrapolated into 90 datasets, imitating a framerate of 1000 Hz. The 90 datasets represent the relationship between head- and eye velocities at 90 different points of the head impulse. Thus calculating gain values from 20°/s and up to the registered peak impulse velocity. E.g. if 10 impulses were completed, 900 gain values would be calculated and a best fitted line through these would then be plotted in the regression velocity diagram, see Fig. 2a.
Cleworth et al. compared two vHIT systems:EyeSeeCam® (Interacoustic) and ICS impulse® (GN Otometrics) in regards to different gain analysis techniques. They did not find significant differences between the two systems when applying the same gain calculation methods. When comparing the mean gain with area, regression techniques and average sample gain, they found the regression technique to yield greater variances compared to the two others. They recommended area calculation methods for calculation of gain. They found that the evaluation of the head impulses (the duration of the analysis) as well as the relation between the peak velocity and acceleration affected the gain values. They also found that an exclusion of the descending part of the head impulse would eliminate potential sources of errors in gain calculation like covert saccades and overshoot. [4]. Curthoys et al also suggest measurements of the total eye velocity over the head velocity curve as it seem less prone to impacts by artefacts [5]. In this study, when we compared the instantaneous gain values to the regression gain values, we found a significant difference in standard deviation (SD) at 0.02 (95% confidence interval (CI): 0.011;0.029) p-value < 0.001 suggesting that the regression gain model is more reproducible than the instantaneous gain model.
Janky et al. compared three vHIT systems –EyeSeeCam (Interacoustics) using instantaneous gain, ICS impulse (GN Otometrics) using area under curve gain, and VisualEyes (MicroMedical) using position gain. Although there were significant differences of mean gain values between these vHIT systems, the ability to distinguish normal from pathological gain values was consistent for all systems within the study. They found gain values to be significantly higher on the ipsilateral side of the camera mounted to track the pupil. This is in accordance with our findings where right lateral SCC gain values (Mean SD) showed a significant difference compared to left lateral SCC gain values (Mean SD 0.011 95% CI: 0.00;0.02) p-value 0.005), see Table 3. We also found a slightly higher mean gain score on the right side for regression gain and instantaneous gain, see Table 1. Janky et al. showed that latency may affect the accuracy of the calculated gain values suggesting that measurements done at 60 ms and 80 ms are more reliable than measurements done at 40 ms. [9].
Another reason for the significant higher deviation in the right lateral SCC gain values could be related to the fact that both clinicians were right-handed.; thus exerting more control (in regards to acceleration, velocity and overshoot) for the impulses administered to the left. Both clinicians did, however, use the same hand placement in accordance with the recommendations made by Patterson et al. with all the head impulses [20]
Matino-Soler et al., however, did find lower velocities for rightward head impulses compared to leftward head impulses amongst a group of three right-handed clinicians which further support the stated hypothesis [15].
When we compared the regression gain to the separate instantaneous gain values, we did not find any significant differences at 60 ms and 80 ms, but a significant difference at 40 ms, 0,041 (95% CI: 0.031;0.052) p-value < 0.001. This was also the case when comparing the instantaneous gains to each other 0.033 (95% CI: 0.022;0.043) p-value < 0.001.
The reason for this significant difference in SD of the instantaneous gain calculated at 40 ms may be explained by the fact that the majority of the peak head velocities do not appear within this latency. The plot of the head impulse provided by the accompanying software (x-axis: latency, y-axis: head velocity) shows a very steep curve initially that peaks and reverts around 60–100 milliseconds. This makes the accompanying head velocities obtained after 40 ms more susceptible to a greater variety than accompanying head velocities obtained after 60 and 80 ms, because the curve flattens the closer it gets to the peak head velocity. This could also be supported by Shu et al.’s study showing that a loose goggle strap induced a significant change in the gain value (in negative direction) for the instantaneous gain at 40 ms compared to 60 and 80 ms [22]. Suggesting that measurements at 40 ms are more prone to artefacts and the least reproducible of the instantaneous gain values.
Strengths and weaknesses
For a complete and thorough comparison of the gain calculation methods, the study should have included gain calculations for all SCCs. All subjects in the study underwent examination of all six SCCs. Unfortunately, the system did not provide information regarding the instantaneous gain values when testing the vertical SCCs even though the data was collected. A future software upgrade should include this information. The data set in this study was relatively large. All sixty subjects were tested twice by each examiner with a total of 240 datasets. This yielded 3600 head impulses for the lateral SCCs making this one of the largest studies to our knowledge. The subjects tested were all healthy individuals, with no prior vestibular illness. A full evaluation of the gain methods should include patients with vestibular pathologies to see if the reproducibility is affected by vestibular hypofunction.
We did not observe any significant intra-observer variations in the regression gain nor the instantaneous gain, see Bland-Altman plot in Fig. 4. It would also be fair to assume that after performing more than 1000 head impulses with this vHIT system, the inexperienced examiner is no longer a novice examiner. This could explain why we only found a slight significance in the comparison of the inter examiner variability as the inexperienced examiner improved his skills in performing the vHIT on the laterals SCC’s during the inclusion period. It should also be noted that the head impulses for the lateral SCCs are not so technically demanding to deliver correctly as opposed to the vertical SCCs that, furthermore, require a higher degree of patient compliance.
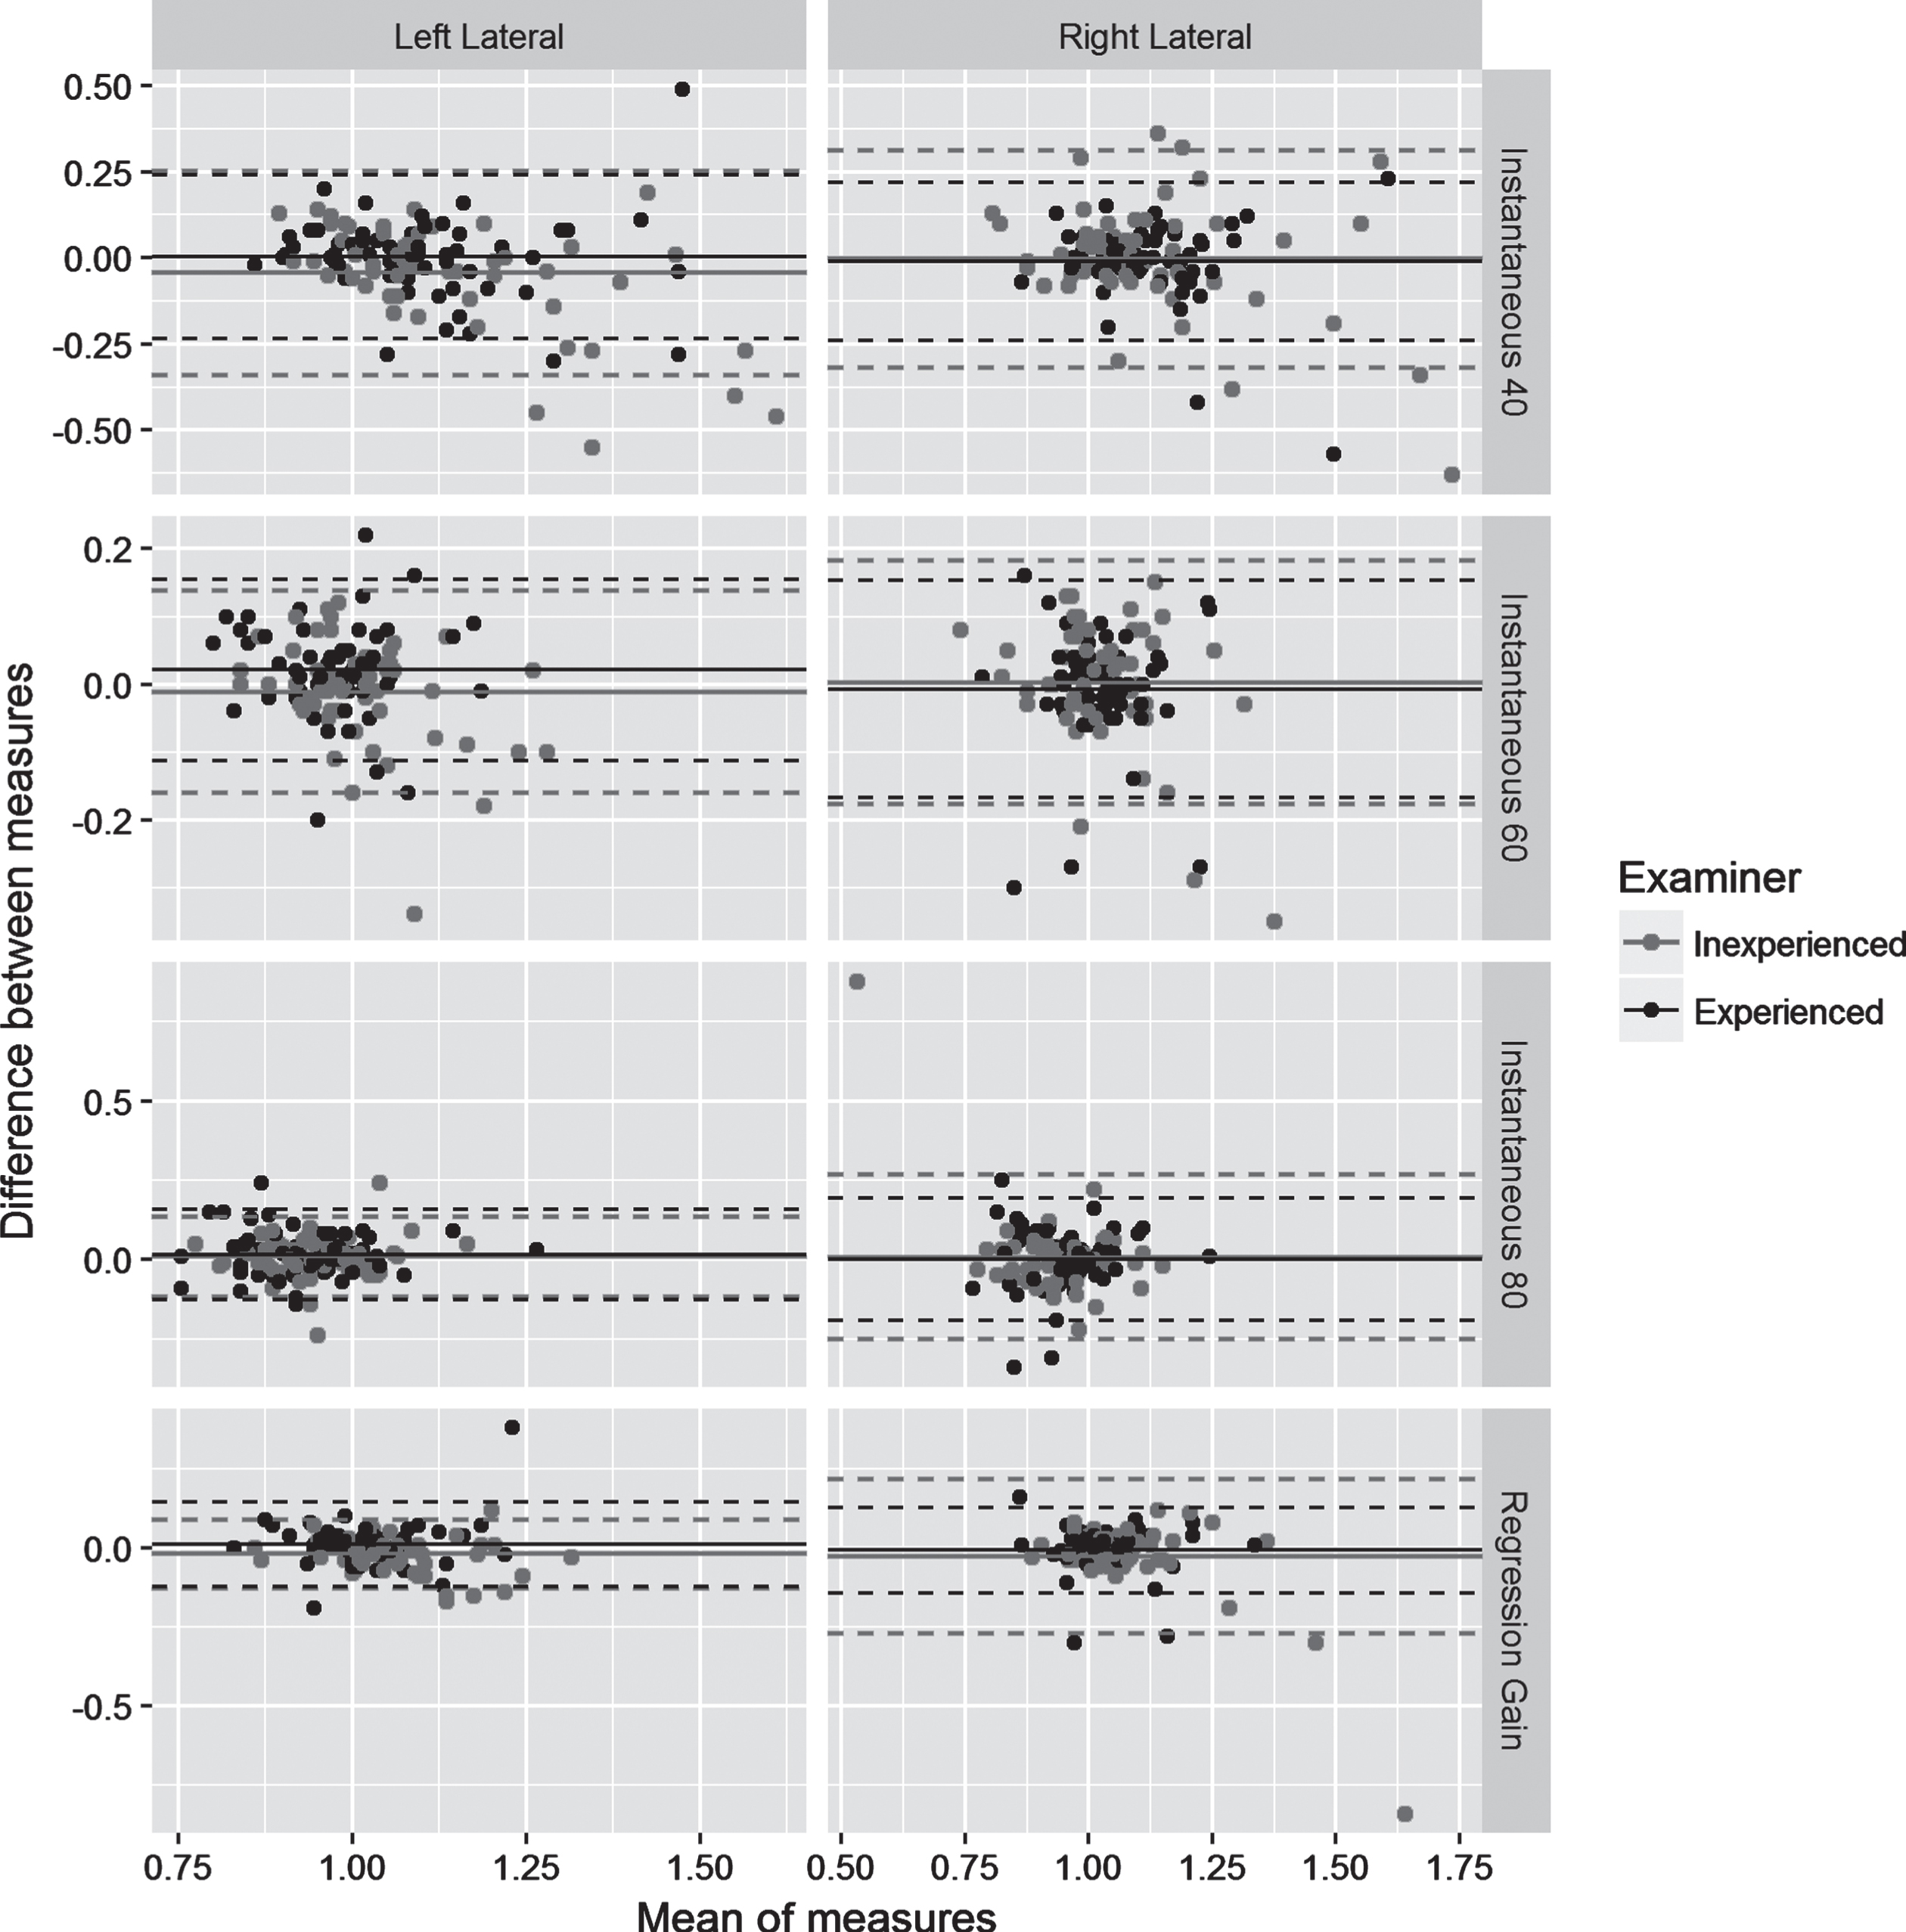
Bland Altman plot displaying LOAs for each type of gain calculation method and SCC for the two examiners. Bland Altman plot showing differences between the two repeated measures of gain values within each examiner for each patient, against the mean of the two measures. Solid lines represent the mean difference across all patients, and dashed lines represent 95% confidence limits. The least variation is found for the regression gain and instantaneous gain at 80 ms for the left lateral SCC.
When testing the horizontal SCCs using the EyeSeeCam® vHIT system and meticulously trying to avoid any pitfalls, we found the most reproducible gain method to be the regression gain analysis. When looking at the instantaneous gain values, we found the least reproducible gain setting to be at 40 ms and the most reproducible to be 60 ms. This is in accordance with findings in similar studies [9]. When comparing the results of the experienced examiner and the inexperienced we found a slight, but significant, difference showing that the experienced examiner had a higher reproducibility of the regression gain. We did not see any significant intra examiner variability related to the different gain measurements. Based upon data from this study, we recommend the examiner has a certain amount of previous experience with vHIT testing in order to obtain reliable results. A thorough understanding of the VOR and possible artefact triggers are also a prerequisite to minimize potential pitfalls and artefacts. For the EyeSeeCam® vHIT system we recommend using the regression gain value for the most reliable interpretation of results when performing lateral SCC testing.