
Abstract
BACKGROUND
Artificial gravity (AG) has the potential to provide a comprehensive countermeasure mitigating deleterious effects of microgravity. However, the cross-coupled “Coriolis” illusion has prevented using a more feasible and less costly short-radius centrifuge, as compared to large, slowly spinning systems.
OBJECTIVE
We assessed tolerability of a personalized, incremental protocol to acclimate humans to the cross-coupled illusion, enabling faster spin rates.
METHODS
Ten subjects were exposed to the illusion by performing roll head tilts while seated upright and spun about an Earth-vertical axis. The spin rate was incremented when head tilts did not subjectively elicit the illusion. Subjects completed one 25-minute session on each of 10 days.
RESULTS
The spin rate at which subjects felt no cross-coupled illusion increased in all subjects from an average of 1.8 rotations per minute (RPM) (SD: ±0.9) at the beginning of the protocol to 17.7 RPM (SD: ±9.1) at the end. For off-axis centrifugation producing 1G at the rider’s feet, this corresponds to a reduction in the required centrifuge diameter from 552.2 to 5.7 meters. Subjects reported no more than slight motion sickness.
CONCLUSIONS
Acclimation to the cross-coupled illusion, such as that accomplished here, is critical for feasibility of short-radius centrifugation for AG implementation.
Background
Artificial gravity (AG) has been considered as a countermeasure for extended-duration human space exploration (e.g., mission to Mars) for over a century [27]. AG provides the potential for a comprehensive countermeasure, in that it can mitigate deconditioning of several physiological systems concurrently (e.g. bone and muscle loss, cardiovascular deconditioning, etc.), in contrast to existing piecemeal countermeasures. Previous approaches to AG have investigated large, slowly rotating centrifuge systems [26]. These concepts have the benefit that humans on-board will likely not be adversely affected by the slow rotation; however, they are technically complex and costly to launch due to the large mass, often considered infeasible for near-term space exploration [4]. An alternative approach to AG is the utilization of a short-radius centrifuge with a diameter on the order of 4–8 meters rather than 100 + meters, but this requires that the human be spun faster to achieve the desired loading level. A shorter diameter would likely decrease both the mass and cost of the system, but the fast spin rate introduces challenges of its own. The concerns for the human during short-radius centrifugation include 1) the production of a gravity gradient along the body, 2) the Coriolis forces associated with moving (e.g., a limb) linearly in the rotating environment, and 3) the disorientation and motion sickness resulting from the cross-coupled (CC) “Coriolis” illusion. Previous research [5, 20] leads us to believe that of these three concerns, the limiting factor for short-radius centrifugation is the effect of the CC illusion on the rider.
Further detail is provided elsewhere [11, 28], but in summary: the CC illusion is a tilting or tumbling sensation felt by an individual in a constantly rotating environment when executing a head tilt outside of the plane of rotation [11]. The unusual and unexpected stimulation to the vestibular system is highly disorienting and leads to motion sickness. The CC illusion intensity is dependent on the spin rate of the rotating system, head tilt angular velocity, head tilt direction relative to the spin axis [24], and the angle of the head tilt [13]. Of greatest operational concern for future short-radius centrifugation is the more provocative side effects associated with the faster spin rates required to produce desired loading levels. Investigations from the 1960’s assessing humans in a continuously rotating room (up to 10 rotations per minute (RPM)) for extended periods of time (up to 12 days) suggested that a slow spin rate of only a few RPMs was tolerable [9, 15]. Faster spin rates led to disorientation and severe motion sickness when head tilts were performed. These adverse effects of the CC illusion at faster spin rates, coupled with the technical challenges of larger AG systems, motivate the development of a protocol to raise tolerance to the illusion, thus enabling a shorter-radius centrifuge.
Several studies have shown a reduced illusory response to the CC illusion through repeated exposure [2, 12]. More than one potential physiological mechanism may be involved: “adaptation” (a central reinterpretation of the sensory cues to be more appropriate for the novel, rotating environment) and/or “habituation” (a reduced sensitivity to unexpected sensory cues produced from the novel, rotating environment), and both terms have been used previously. Our approach and findings do not specifically focus on (or depend upon) one or the other or a combination of mechanisms, so here we refer to reductions in CC illusion responses more generally as “acclimation”.
Acclimation to the CC illusion has been demonstrated across various subjective measures (e.g. sense of illusory tilt, CC illusion intensity, and motion sickness reports) [31]. Previous CC illusion acclimation studies typically investigated subjects performing a series of head tilts at a spin rate that remained constant throughout the testing session, with each lasting 30–60 minutes, and were repeated once daily for 2–3 consecutive days [2, 31]. Acclimation continued over multiple sessions, but even in the longest published experiment to date (5 days), the acclimation was not complete (i.e., subjects still experienced some CC illusion at the conclusion of the study) [13]. Further, the constant spin rate was often quite fast (e.g., 23 RPM), which elicited severe motion sickness in many of the subjects and resulted in high subject dropout rates (typically 25–35%, even after screening out subjects most susceptible to motion sickness) [2, 31].
To potentially reduce the severity of motion sickness, an incremental approach was proposed where the spin rate (and thus the intensity of the CC illusion stimulus) was increased over time [23]. For example, one study exposed subjects to 14 RPM on day 1, 23 RPM on day 2, and 30 RPM on day 3 [7]. This approach tended to reduce the proportion of subject dropouts due to severe motion sickness (∼16% dropout proportion), as compared to the high-intensity, constant exposure approach.
Building upon the incremental approach, it was found that motion sickness could be almost entirely avoided with the use of a threshold-based, or personalized, incremental acclimation approach. In the personalized protocol, the spin rate was incremented based on each individual subject’s reporting of the presence or absence of the CC illusion [3]. In this study [3], supine subjects spun about their roll axis and performed yaw head tilts. The spin rate began at 3 RPM, and once subjects reported no longer feeling the illusion, the spin rate was incrementally increased by 1.5 RPM over 15 seconds. Head tilts were self-paced, but subjects were asked to pause for at least 10 seconds between head tilts to report any CC illusion. The study found increases in the CC illusion “threshold” both within each 25-minute session, as well as across two sessions on consecutive days. Further, when the CC illusion was only presented at or near the subject’s threshold using the personalized, incremental protocol, 0 of 10 subjects dropped out due to motion sickness. The authors concluded that this threshold-based, incremental procedure is the “method of choice for benign exposure” to the CC illusion [3].
Previous studies have noted “individual differences appeared to be rather large” in CC illusion acclimation [3]. However, to date, studies have only reported means across subjects and not specifically quantified inter-individual differences in CC illusion acclimation. Further, previous studies have typically had subjects report the CC illusion intensity on 0–10 scale in which 10 corresponds to the intensity of the illusion on the first head tilt [2, 18]. This makes it difficult to compare responses across subjects, since the scale is normalized for each subject.
Objective
In this study, we address previous limitations by assessing the tolerability and efficacy of a threshold-based, personalized, incremental protocol to acclimate humans to the CC illusion.
Methods
We tested the effectiveness of a 10-day, personalized acclimation protocol in which subjects were exposed to CC illusion stimuli near their threshold (i.e., where the illusion was barely felt or not at all), limiting motion sickness and encouraging benign exposure to the CC illusion. Our protocol consisted of 10 sessions over the course of 2 weeks – the longest investigation of its kind – aimed at understanding the upper limits of CC illusion acclimation. All subjects began the protocol at 1 RPM, and the spin rate was incremented only when a subject reported experiencing no CC illusion following a pair of head tilts performed in the rotating environment (details in Section 3.3.1. below). The protocol was approved by the University of Colorado Institutional Review Board, and all subjects signed a written informed consent form.
Subjects
A total of 10 (5M/5F) healthy subjects volunteered to participate in the study. Inclusion criteria encompassed subjects aged 18–40 years old with no known vestibular dysfunction. All subjects met these criteria with an average age of 21.4 years (range: 18–24). Subjects were not recruited or excluded based upon susceptibility to motion sickness or previous experience that would alter their vestibular acclimation ability (e.g., extensive time spent on airplanes, boats, previous centrifuge experience, etc.). None of our subjects were pilots. On the Motion Sickness Susceptibility Questionnaire (MSSQ) [21, 22] subjects scored between the 10th and 99th percentile, with a mean MSSQ percentile of 47 (SD: + /–29.3). Subjects were left naïve to the overall purpose of the study, the hypothesis of CC illusion acclimation, and the protocol for altering the spin rate.
Equipment
All experiments were completed in the Bioastronautics Laboratory at the University of Colorado Boulder, using the custom-built Human Eccentric Rotator Device (HERD). Subjects were seated upright in a converted racing chair and rotated clockwise in yaw about an Earth-vertical axis, aligned with the subject’s longitudinal (rostrocaudal) axis (Fig. 1). Experiments were performed in the dark to isolate vestibular stimulation and keep subjects naïve to the incrementing of spin rate. Subjects were secured with a 4-point harness and were monitored using infrared cameras. Wireless two-way verbal communication was provided between the subject and operators. Additionally, subjects were provided two wireless pushbuttons for entering responses. Head tilts were limited by foam blocks: one located vertically on the left side of the subject’s head, and the other placed at a 40° angle from vertical on the right side of the subject’s head to help ensure consistent head tiltangles.

CU’s Human Eccentric Rotator Device (HERD), displaying both head positions between which head tilts were made: ‘head tilt up’ (Panel A) and ‘head tilt down’ (Panel B).
The protocol consisted of 10 sessions (one session per day over the course of no more than 14 consecutive days to accommodate subject schedules) in which subjects were spun for 25 minutes per session. At each spin rate, subjects spun continuously for 30 seconds to allow for the endolymph in the semicircular canals to equilibrate and any sensation of rotation to decay. Subjects were then asked to perform a head tilt 40° right ear down and leave their head tilted while reporting if they experienced the CC illusion as a result of the head tilt. After 30 seconds of maintaining the ‘head tilt down’ position, subjects were instructed to tilt their head back upright and again report the presence or absence of the illusion. The head tilt down and the head tilt back up constituted one “head tilt pair”. Each head tilt was performed over approximately 1 second. Subjects practiced making smooth, ∼1 second head tilts prior to the beginning of testing. Approximate head tilt duration was verified by infrared video monitoring and subjects were notified if their tilts were performed too rapidly or slowly.
Incrementation protocol
Following each head tilt pair, the spin rate was incremented or maintained based on the subject reporting whether or not they felt the CC illusion. Specifically, subjects were prompted with the following: “We ask you to simply report whether or not you felt the illusion directly after every head tilt. Sometimes it may be hard to tell, but if you feel anything outside of tilting your head normally in a stationary environment, verbally report “yes” and press the “yes” button. Otherwise, report “no” and press the “no” button.” If a subject reported that he/she did not feel the illusion on both head tilts of the pair, the spin rate was increased by 1 RPM over 20 seconds. This duration was selected to keep the angular acceleration subthreshold and the subjects more naïve to the modulation of spin rate based on non-vestibular sensory information (e.g. onset of centripetal acceleration in the subjects’ legs). If the subject felt the CC illusion on either or both head tilts of the pair, the spin rate was maintained.
The testing sequence, shown in Fig. 2, was repeated for the duration of the 25-minute session. Upon the conclusion of the session, subjects were brought to a stop over ∼60 seconds, unbuckled, and free to leave. Between sessions, subject activity was uncontrolled and unmonitored, though subjects were asked to refrain from consuming alcohol or excessive amounts of caffeine within 12 hours before each testing session.

Flow chart of personalized, incremental testing protocol.
On the first test session, subjects were initially spun up to 10 RPM to introduce the sensations of the CC illusion. Ten RPM was selected and confirmed to induce a provocative, supra-threshold CC illusion in all subjects, such that they would understand what sensation(s) to be attentive to throughout the duration of testing. Following the performance of a head tilt pair at 10 RPM, subjects were spun down to 1 RPM over 60 seconds to commence the testing protocol.
On subsequent sessions, the starting RPM was the fastest spin rate that yielded no perception of the CC illusion at the beginning of the previous day’s session. This approach was intended to start each day’s session at a spin rate near, but below the subject’s threshold. Occasionally, the subject reported “yes” that he/she felt the CC illusion on the first head tilt pair at the session’s starting RPM, in which case the subsequent session was started 1 RPM below the previous starting RPM (with a minimum of 1 RPM).
Motion sickness monitoring
Every 5 minutes during each session (i.e., at 5–10, 15–20, and 25 minutes into the session), subjects were asked to verbally report their current motion sickness level. A common 0–20 scale was used (0 corresponds to no sense of motion sickness; 20 is on the verge of vomiting) [2]. Subjects were instructed that a score of at least 1 should be reported if there was any sense of motion sickness, no matter how slight. This self-reporting intensity scale has been used extensively to quantify motion sickness resulting from the CC illusion [2, 31] and has been found to highly correlate with more complex scales that require experimenter monitoring of physiological responses (e.g., pallor) that were not feasible in our protocol [12]. Our a priori criteria for prematurely stopping a session included a subject reporting a motion sickness rating (MSR) of 10 or more (or by subject request). If a score of 10 or more was reached on a second session, no additional sessions were performed with that subject.
Data analysis
Analyzed variables
Two performance metrics were extracted on each day of testing to quantify acclimation – a subject’s beginning threshold and a subject’s ending threshold, which correspond to the fastest spin rate (RPM) at which no illusion was felt (i.e., subject reporting of “no, no” on the head tilt pair) at the beginning and end of each testing session, respectively. These metrics allowed us to conservatively determine each individual’s tolerable spin rate, assuming that if no illusion is even noticed, the spin rate is presumably operationally tolerable. We also were able to use subjects’ CC illusion thresholds to quantify inter-individual differences in acclimation, a benefit over the use of illusion intensity ratings.
If a subject reported that he/she felt the CC illusion on either head tilt of the first head tilt pair of any session, this resulted in an inability to properly identify the subject’s beginning threshold for that session (since there was an absence of spin rate at which no illusion was felt to start the session). Using the starting spin rate described in Section 3.3.2, this only happened on 21 of 100 sessions (8 of which occurred when starting at the minimum of 1 RPM). In these 21 cases, we used a proxy for the subject’s beginning threshold as 1 RPM less than the starting spin rate. These occurrences are specifically noted in Fig. 4A with open/unfilled shapes.
Finally, we analyzed subjects’ subjective MSR reports to evaluate motion sickness.
Statistical analysis
We assessed the hypothesis that our personalized, incremental protocol would facilitate acclimation across sessions in two manners: 1) paired t-tests between CC illusion threshold on session 1 vs. 10 and 2) a one-sample t-test on the “slope” of a linear fit of CC illusion threshold across session 1–10. Both tests were performed using beginning and ending thresholds. While the data in the paired t-tests statistically met normality assumptions (Anderson-Darling and Shapiro-Wilks), with only 10 subjects, we also performed non-parametric Wilcoxon signed-rank tests. These reached the same conclusions, so we only present the outcome of t-tests below. The difference in CC illusion threshold inter– individual variance on session 1 vs. 10 was assessed with a F-test.
For within-session acclimation, we performed paired t-tests between beginning and ending CC illusion threshold, on each of the 10 sessions. We present the results with and without a Bonferroni correction to account for the 10 pairwise comparisons.
The dynamics of motions sickness (MSR reports) were quantified by fitting a hierarchical regression with subject as the identifier, and session number and report within session as factors. The data were transformed to ensure the residuals were normally distributed.
Finally, Spearman rank tests were used to assess potential predictors of both how quickly a subject would acclimate to the CC illusion (if age, gender, etc. correlated to acclimation rate and/or ending thresholds), and if that subject would become motion sick during the study (if MSSQ score correlated to reported MSR).
Statistical tests were performed with R/RStudio or Systat. The required level of significance for all tests was set to α = 0.05.
Results
CC illusion acclimation observed in all subjects
All 10 subjects completed the study and showed evidence of acclimation both within and across sessions, though large inter-individual differences were observed. Fig. 3 illustrates the progression of an example subject both within (panel A) and across sessions (panel B). As the example Session 5 progressed, the subject increased in spin rate from a beginning threshold of 3 RPM to an ending threshold of 8 RPM.
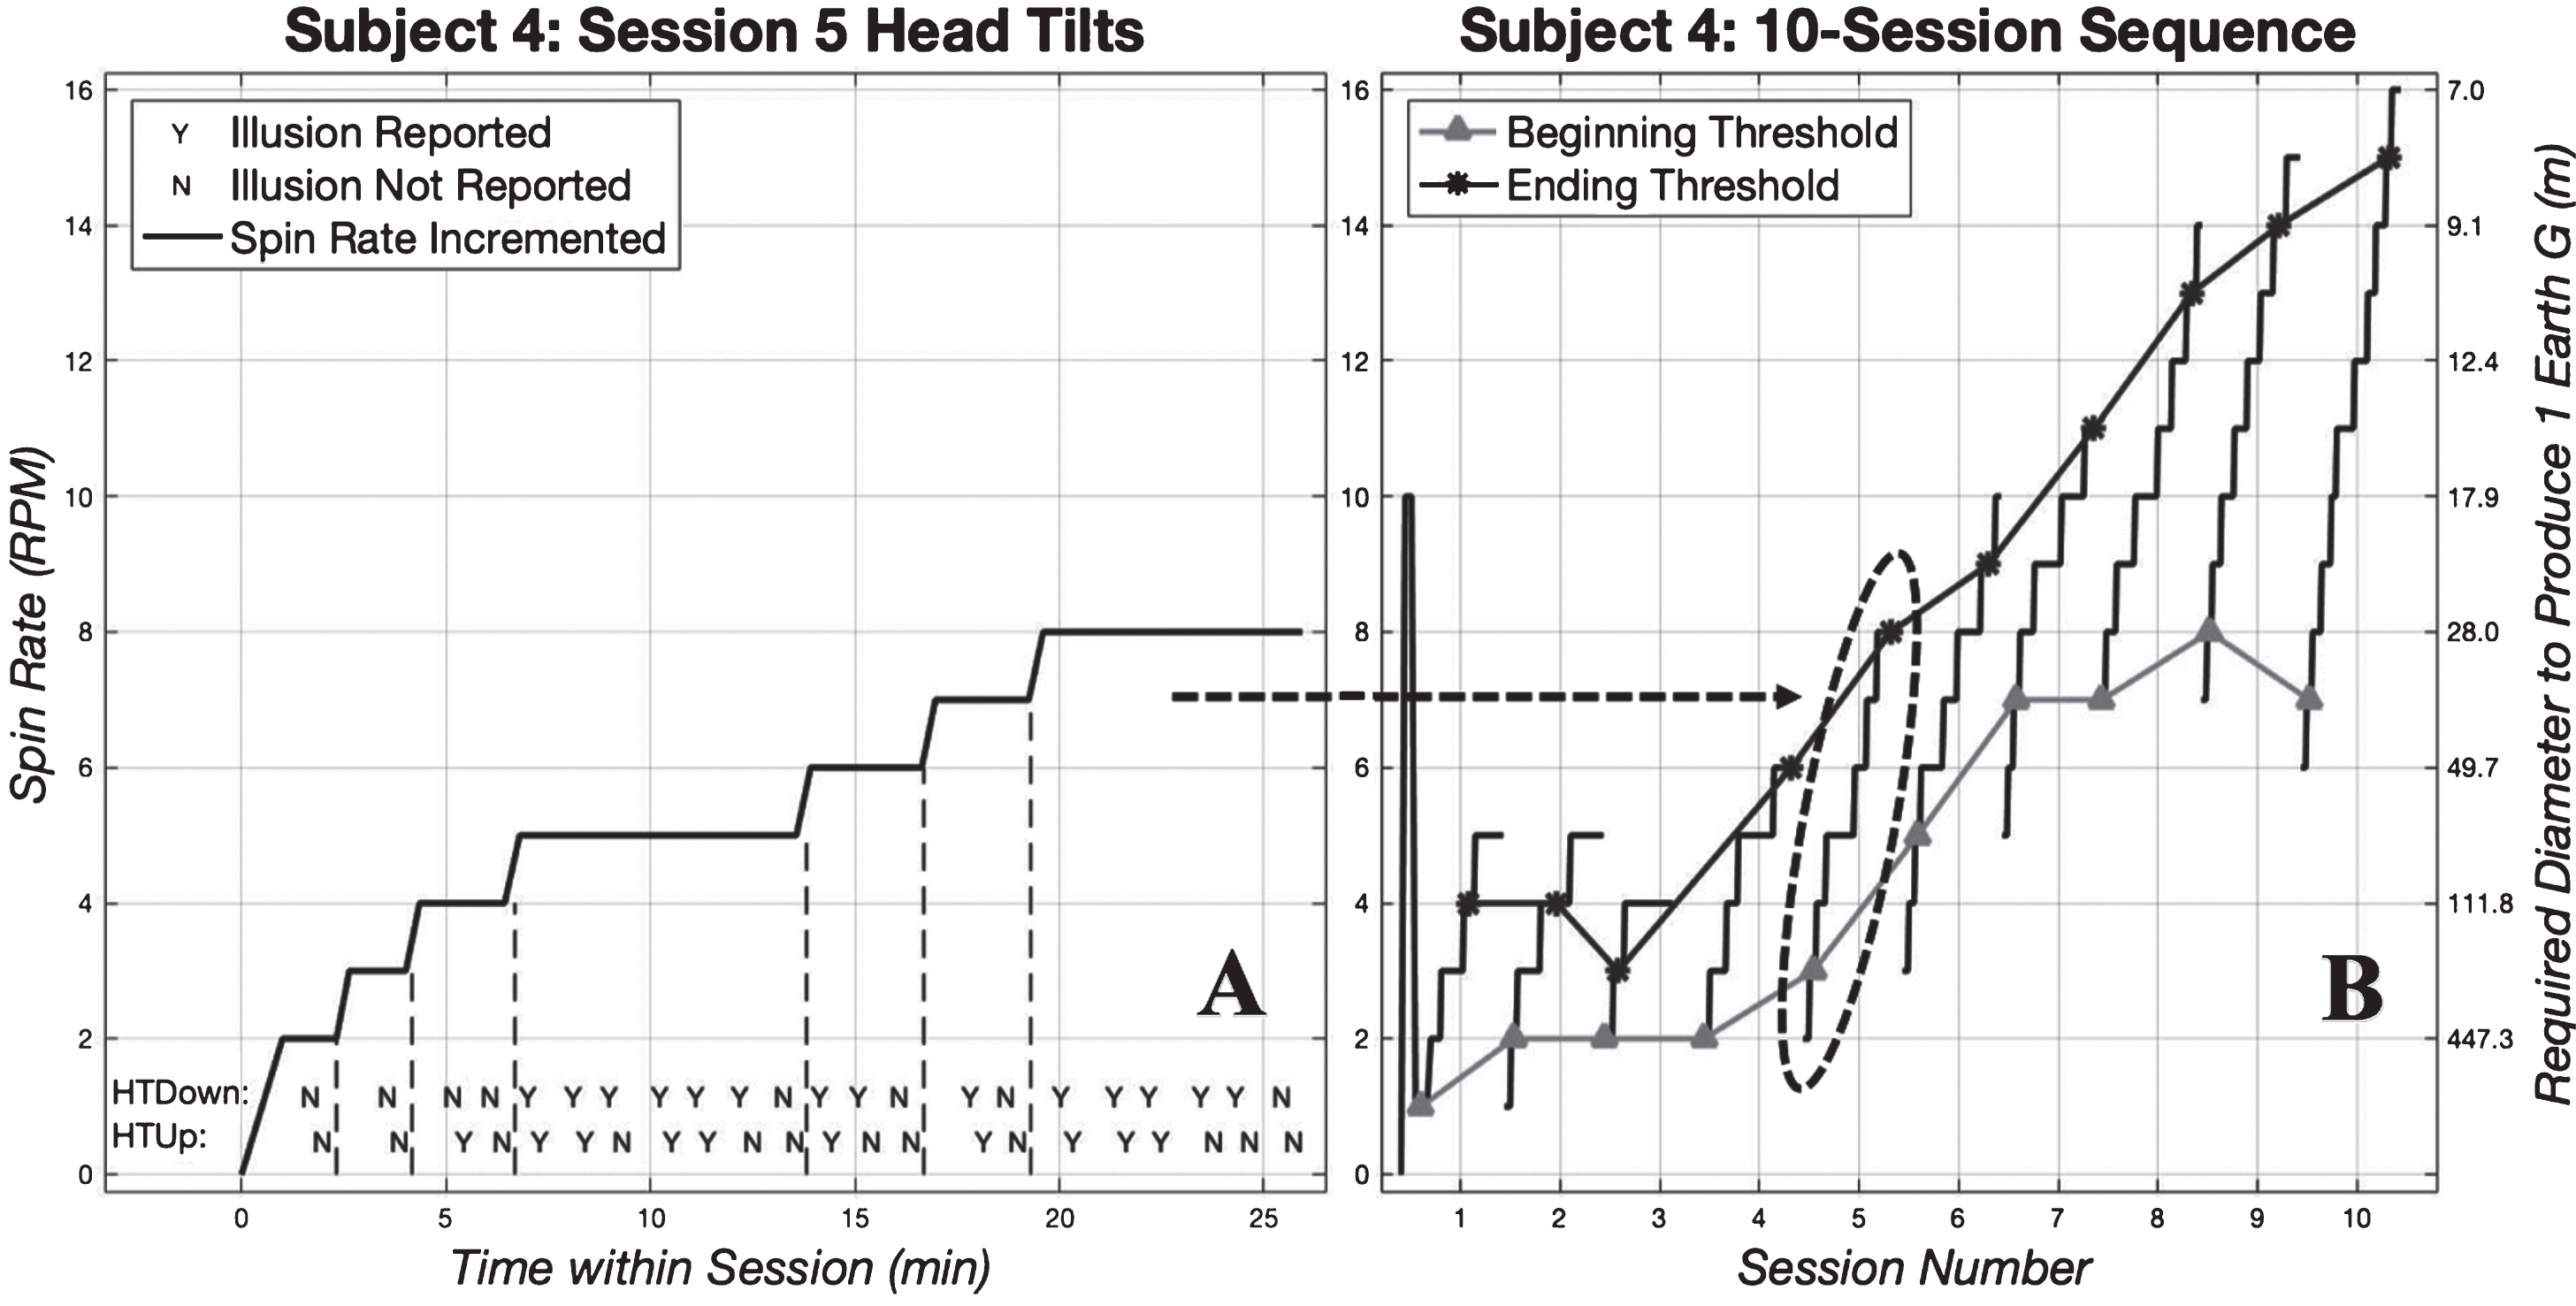
Example subject staircase. Panel A shows the incremental increases in spin rate according to CC illusion reported after each head tilt. Spin rate was only increased when the illusion was not felt on both head tilts of one head tilt pair. This data represents subject 4 on his/her fifth testing session. This particular subject started testing at 2 RPM on Session 5, which corresponds to his/her beginning threshold from the previous Session 4. Across the bottom of the graph, the individual subject reports of “yes” he/she did feel the illusion (denoted with a “Y”), or “no” he/she did not feel the illusion (denoted with an “N”) can be seen for each individual head tilt down (top row) and head tilt up (bottom row). Vertical dashed lines show when the spin rate was incremented, which only occurred following two “N” reports, first on the head tilt down, then on the head tilt up. Panel B shows the spin rate staircase across all 10 sessions for subject 4, showing progression of beginning (gray triangles and connecting lines) and ending (black asterisks and connecting lines) threshold. Each staircase section corresponds to one session of testing. For reference, the required centrifuge diameter to produce 1 Earth G (at the rider’s feet) for each spin rate is shown on the right axis (e.g., 8 RPM requires a 28.0 m diameter centrifuge to produce 1 G).
Ten session sequences such as that in Fig. 3A compose Fig. 3B, which shows this same subject’s progression over all sessions. As a primary finding, both the subject’s beginning (gray triangles in Fig. 3B) and ending (black asterisks) threshold increased from sessions 1 to 10.
On average, subjects’ beginning thresholds increased from 1.8 RPM (range: 1–3) on Session 1 to 12.6 RPM (range: 2–30) on Session 10 (Fig. 4A). The beginning threshold was significantly higher on session 10 than on session 1 (t(9) = 3.8, diff = 10.8 RPM, Cohen’s drm = 1.6, p = 0.004). All 10 subjects had a higher beginning threshold on session 10 as compared to session 1. Similarly, the ending threshold increased from an average of 4.1 RPM (range: 1–8) on Session 1 to 17.7 RPM (range: 3–30) on Day 10, yielding a statistically significant increase (t(9) = 5.4, diff = 13.6 RPM, Cohen’s drm = 2.0, p < 0.0005). Once again, all 10 subjects displayed a higher ending threshold on session 10 than session 1.

Progression of beginning (panel A, top) and ending (panel B, middle) thresholds for all 10 subjects (different shapes and shades of gray) over 10 sessions of personalized, incremental acclimation. Open shapes indicate when the beginning threshold could only be estimated, based on subjects reporting that they felt the CC illusion on either or both head tilts of the first head tilt pair. Solid black lines indicate the sample mean. Linear regression fit slope-values (as RPM increase/session) for each subject are provided in the legend as m-values. The right y-axis shows the centrifuge diameter (in meters) required to produce 1G at the rider’s feet, corresponding to the spin rates on the left. Note that the relationship between spin rate and required diameter is non-linear. Panel C (bottom) shows the average difference between beginning and ending thresholds (averaged across all subjects) for each session. The shaded area shows the 95% confidence interval across subjects.
To further characterize acclimation with an acclimation rate, we applied a linear fit to each subject’s CC illusion thresholds as a function of session number (#1–10). In these linear fits (separate fit for each of beginning and ending threshold), the slope is the acclimation rate (RPM/session) and the y-intercept is the expected CC illusion threshold (either beginning or ending) on session #1 for each subject. Residuals of each subject’s linear fit were found to be normally distributed (Anderson-Darling, Shapiro-Wilks tests, p = 0.14 –0.93), suggesting that acclimation across sessions for each subject was consistent with being linear. Values of the slopes obtained from the linear regressions are displayed in the legends of Fig. 4 (m-values), and both the slopes and intercepts are given in Table 1. A one-sample t-test on the individual regression slopes (acclimation rates) found they were significantly greater than zero for the beginning thresholds (t(9) = 4.3, mean = 1.1 RPM/session, 95% CI: 0.5–1.6, Cohen’s d = 1.9, p = 0.002) and ending thresholds (t(9) = 5.7, mean = 1.5 RPM/session, 95% CI: 0.9–2.2, Cohen’s d = 2.6, p < 0.0005). Positive slope values correspond to an increase in CC illusion threshold across sessions.
– Slopes and Intercepts of Acclimation Linear Regressions
The slopes in Table 1 highlight the substantial inter-individual differences in acclimation rate (beginning threshold coefficient of variation = 0.74, ending threshold coefficient of variation = 0.55). Further, there is substantial variation in the ending thresholds on session 10 (standard deviation of 9.1 RPM, coefficient of variation = 0.51). As a result of the varying rates of increasing threshold, the variance in threshold on session 10 was significantly larger than that on session 1, both for beginning threshold (F(9) = 0.0096, 95% CI: 0.0024–0.0386, p < 0.0005) and ending threshold (F(9) = 0.0686, 95% CI: 0.0170–0.2761, p < 0.0005). In an effort to identify potential predictors of acclimation ability and thus explain these large variances, a Spearman rank correlation test between an individual’s age and rate of acclimation was performed but found to not be significant (p = 0.63). Similarly, a two-sample t-test between males and females also found gender to not be significant (p = 0.85).
Acclimation within each session
To assess within-session acclimation, we performed paired t-tests between beginning and ending thresholds for each of the 10 sessions (differences shown in Fig. 4C). All 10 of these tests were statistically significant (p < 0.0005 to p = 0.003) such that ending thresholds were greater than beginning thresholds for each session. We note that when Bonferroni corrections were applied to account for the 10 pairwise comparisons, all sessions still reached statistical significance (p < 0.005, calculated by dividing α= 0.05 by the 10 pairwise comparisons).
Further, we found that the within-session difference between beginning and ending threshold increased with session number. To quantify this, we fit a hierarchical regression with subject as the identifier and session number as the independent variable. To ensure normality and homoscedasticity of the residuals, we log-transformed the difference between beginning (or ending) threshold (Y), as the dependent variable (Y′= log10(Y + 1), where 1 was added to produce a real number when Y = 0). The slope of the regression was significantly greater than zero (k = 0.036, CI: 0.024 –0.048, Z(89) = 5.7, p < 0.0005). This is consistent with subjects acclimating more within each session as they experienced more sessions. We note the apparent decrease on session 10 (Fig. 4C) was primarily due to two subjects who reported that they did not feel the illusion for essentially all of the final session, such that the beginning and ending thresholds were nearly the same, yielding a difference near zero.
Motion sickness ratings (MSRs) remained low in all subjects
Across all sessions and subjects, the MSRs reported by each subject were generally very low. On the standardized scale of 0 to 20, subjects reported an average MSR of 1.06 (SD:+/- 1.1). Fig. 5A shows the average of the 5 MSRs within each session for all 10 subjects over all 10 sessions. Fig. 5B alternatively shows the maximum MSR in each of 10 sessions for all 10 subjects. None of our subjects ever reported an MSR of 10 or greater, yielding a 0% (0/10) dropout rate.
Dynamics of motion sickness ratings (MSRs) within and across sessions
We aimed to test whether session number or report number within each session affected the reports of motion sickness. To yield one MSR per session for each subject, we first averaged the 5 reports made in each session (Fig. 5A). Due to the long right tail of the distribution of MSRs, these were transformed by Y′= log10(MSR + 1) for statistical analysis, where the plus one was required when MSR = 0. We then fit a hierarchical regression with subject as the identifier, session number as the independent variable, and Y’ as the dependent variable. This found session number to not have a significant effect on transformed MSRs (p = 0.07). The trend towards significance was mostly due to session 1, in which the MSRs tended to be higher than in the subsequent sessions (session 1 mean MSR across subjects was 2.1, sessions 2–10 mean MSRs ranged from 0.74 to 1.2). If session 1 was excluded, the hierarchical regression found session number to more clearly be not significant (p = 0.68). This suggests that after session 1, motion sickness remained fairly constant.
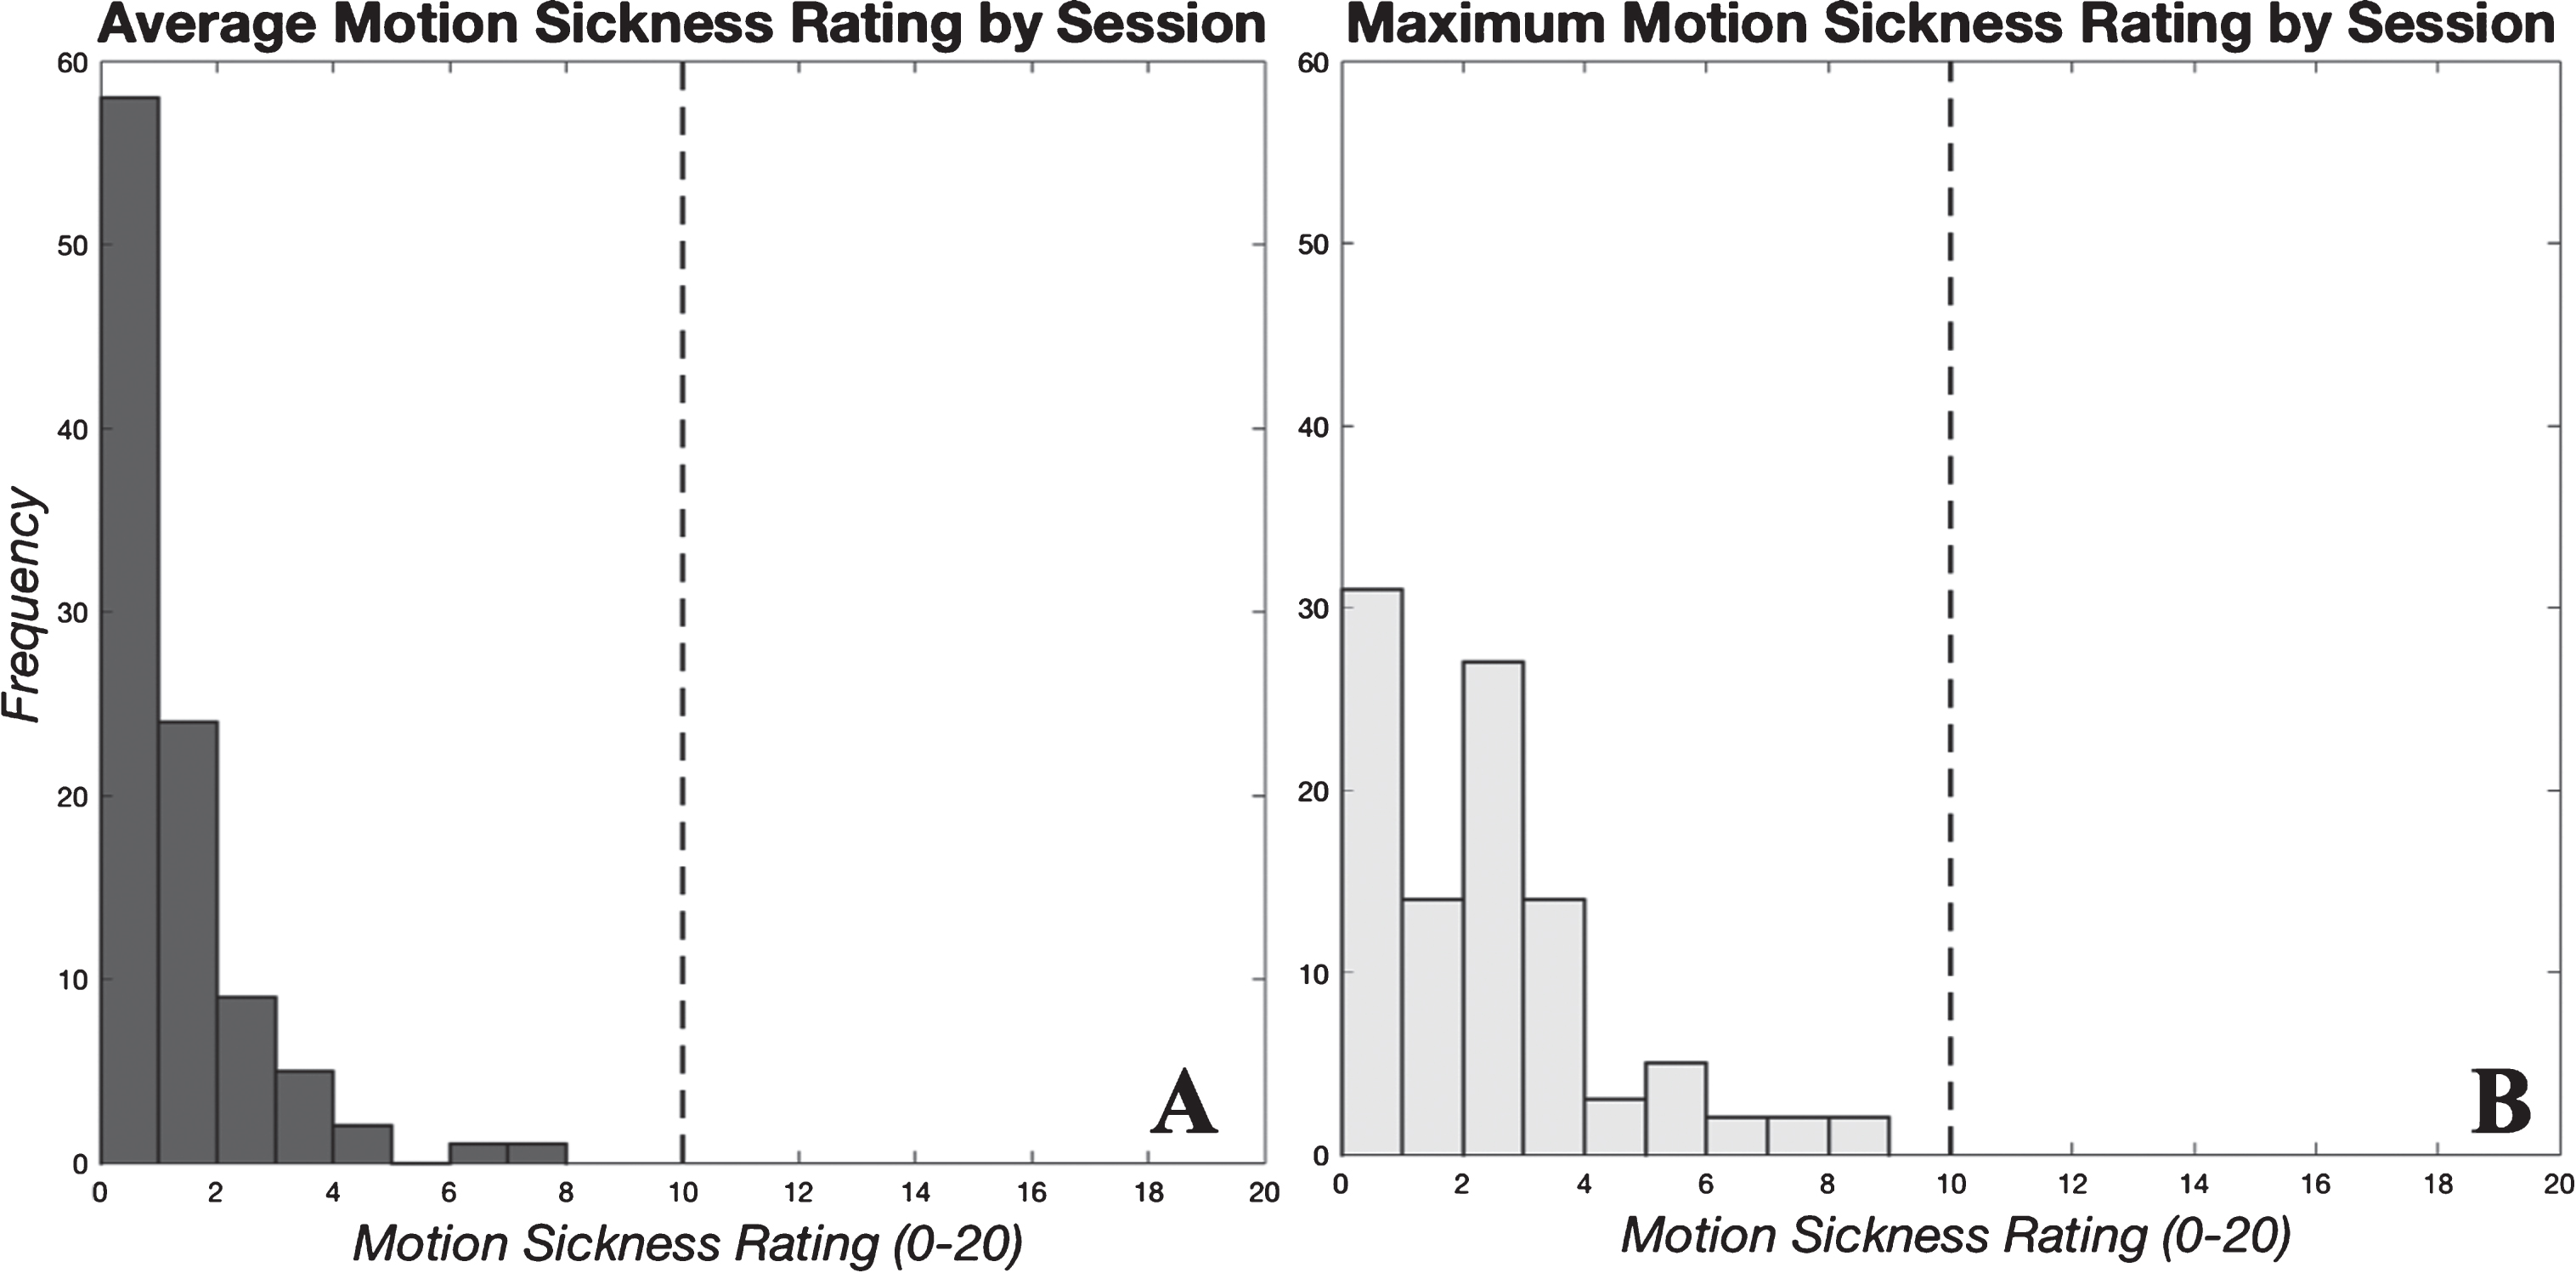
Motion sickness rating (MSR) scores reported within each session with all 10 subjects displayed (100 total scores). Panel A shows average MSR scores reported in each session, and panel B shows maximum MSRs reported.
Since there was not a clear effect of session number, we averaged across all 10 sessions to yield an average MSR for each subject for each of the 5 reports within sessions. Again, we log-transformed the MSRs, as above. Fitting a hierarchical regression, now with report number as the independent variable, yielded a significant effect (k = 0.039, CI: 0.023–0.055, Z(39) = 4.9, p < 0.0005). The coefficient is in terms of the transformed MSRs, so it does not have meaningful units. The MSRs on the first report of each session averaged only 0.61 but increased on each subsequent report to scores of 0.78, 1.21, 1.31, and 1.41. While motion sickness remained low throughout, it slowly increased during each 25-minute session.
We performed Spearman rank correlation tests to evaluate if subjects with a higher MSSQ percentile (i.e., those more susceptible) would have higher MSRs during testing but found no significant correlation between 1) each subject’s MSSQ and average MSR across each subject’s 50 reports (p = 0.55), and 2) MSSQ and maximum MSR reported by each subject (p = 0.94).Additionally, we evaluated whether a subject’s ability to acclimate was correlated with his/her MSRs (i.e., did those who acclimated quickly tend to experience higher or lower motion sickness?). Spearman rank correlation tests were performed, and no significant correlation was found between 1) ending threshold on session 10 and average MSR (p = 0.36); 2) ending threshold acclimation rate and average MSR (p = 0.88); 3) ending threshold on session 10 and maximum MSR (p = 0.81); or 4) ending threshold acclimation rate and maximum MSR (p = 0.96).
Additional findings regarding head tilt direction
While not the focus of our study, similar to previous investigations [2, 19], we found a systematic effect of the direction of head tilt eliciting stronger CC illusions. Specifically, when our subjects reported feeling the CC illusion on only one of the two head tilts in a pair, they tended to report feeling it on the head tilt back to upright. Table 2 shows the number and proportion (in parentheses) of head tilt pairs yielding each possible reporting outcome. Of the pairs in which the illusion was felt on only one of the two head tilts (last two columns), the relative proportions are shown in brackets. Eight of 10 subjects reported feeling the illusion significantly more on the head tilt back to upright as compared to the head tilt down ( *, p < 0.05), one subject (subject 7) felt the illusion on the head tilt down more frequently than the head tilt up (†, p < 0.05), and 1 subject did not have a directional asymmetry (subject 4).
– Number and Proportion of Head Tilt Pairs Yielding Each Possible Response Outcome
– Number and Proportion of Head Tilt Pairs Yielding Each Possible Response Outcome
We found that all ten subjects acclimated as a result of the testing protocol. Both beginning and ending thresholds increased for all subjects between the first testing session and the tenth. This is evidence that subjects are capable of acclimating to the CC illusion within a session, and that this acclimation carries over from one day to the next. Notably, by the tenth session, seven of our ten subjects reached a spin rate of at least 15 RPM in which they did not experience any CC illusion. This corresponds to the spin rate required to obtain 1 G loading at the outer edge of an 8-meter diameter centrifuge. This is a dramatic improvement from the beginning threshold on session 1, averaging 1.8 RPM, which would require a 552.2 m diameter centrifuge to create the same loading level.
Comparison to previous studies
We aimed to identify subjects’ CC illusion “threshold”. This metric is different from previous approaches in which participants subjectively reported illusion “intensity”, magnitude of illusory tilt angle, or measurement of resulting reflexive eye movements (e.g., time constant of decay of slow phase vestibular ocular reflex (VOR)) [29, 31], which have a few limitations. First, the relationship between reported illusion intensity and tolerability is unclear and likely depends upon the individual, their motivation, the task, and the duration (and frequency) which must be tolerated, among other factors. Additionally, while an objective measure, erroneous eye movements from the VOR are likely not the limiting factor for tolerability. We suggest that the forced-choice task (“yes, I felt the CC illusion” vs. “no I did not”) is an easier psychophysical task than magnitude estimation on a scale anchored to a sensation experienced potentially days prior (0–10 “intensity” scale). We also suggest that the threshold metric better addresses what is most critical to those designing operational AG centrifuge systems: identification of the fastest tolerable spin rate in physical units of RPM (and thus defining the shortest feasible radius).
As hypothesized, our personalized, incremental protocol facilitated benign exposure to the CC illusion. All 10 of our subjects completed the protocol, and none of them reported more than slight motion sickness. The reported motion sickness levels were similar to other personalized, incremental studies [3], and much lower than previous high-intensity exposure investigations [2, 31]. Notably, the low motion sickness levels reported here were reached without screening out subjects highly susceptible to motion sickness, as was done in many previous CC illusion acclimation investigations. Our results did show a statistically significant increase across motion sickness reports within each session; however, we note that even the highest average reports were still quite low (Average MSR (t = 25 min) = 1.41/20). If this trend continued, the sessions would need to be much longer (at least several hours) before subjects reached motion sickness levels of operational concern (10 + /20).
Inter-individual differences prevalent in acclimation to the CC illusion
The CC illusion threshold metric allowed us to not only identify acclimation trends within a subject, but also to find and characterize differences between subjects. Previous studies only presented means across subjects [2, 31], so individual differences in capacity to acclimate were not overtly apparent. In the present study, the session 10 ending threshold ranged from 3 RPM to 30 RPM across our 10 subjects. One might suspect the observed differences in acclimation may be due to individual differences in decision boundary of what constitutes “yes” vs. “no” when asked if the illusion was experienced. If this were the case, we would expect it to yield similar inter-individual differences across testing sessions. However, all subjects had beginning thresholds between 1 and 3 RPM on session 1 (range = 2 RPM or 3x), while ending thresholds on session 10 ranged from 3–30 RPM (range = 27 RPM or 10x). This increased range after 10 sessions of exposure suggests that a reasonable portion of the inter-individual variation is due to differences in ability to acclimate rather than differences in reporting decision boundary. However, the factors that cause the individual difference in acclimation ability remain unknown. We note that while no subjects reported vestibular dysfunction, an undiagnosed condition could have contributed to this variability. Other potential explanations of variation include gender or age, but our statistical tests showed no differences between groups in either of these categories. However, our experimental design was not aimed to predict individual variation (i.e., 5M/5F was likely not sufficient to identify a gender-based effect, and our subjects were 18–24 years which would not identify an age effect in older individuals), so we cannot yet rule these effects out. Identification of predictors for rate of acclimation remains an open question, critical to future AG applications.
Regardless of the inter-individual differences, each subject appeared to acclimate rather linearly across sessions with no apparent plateau in acclimation reached, as evidenced by the linear regression fits (Table 2). This suggests that continued training sessions could lead to additional acclimation. Future work may investigate whether this linear acclimation trend persists beyond 10 days, such that all subjects (even “slow” acclimators) could reach an operationally relevant spin rate (e.g., 15 RPM) given a sufficient number of training sessions.
Implications for future configurations
The configuration used in this investigation included an upright chair spinning about a head-centered, Earth-vertical axis (i.e., yaw rotation). This configuration differs from that expected during centrifugation in a few ways. First, to create centripetal acceleration along the rider’s longitudinal axis (aimed at replicating loading here on Earth), the spin axis is typically in roll and/or pitch. Further, our subjects made only roll head tilts in one quadrant (head tilt right ear down and back to upright). However, the three roughly orthogonal semicircular canals transduce angular rotation in any direction. Thus, it is reasonable to expect that acclimation in our configuration is representative of that for rotation in different axes with different head tilts. While representative, if an individual acclimates in one axis (e.g., yaw head tilt), that acclimation does not necessarily immediately transfer to another axis (e.g., pitch head tilt) [8]. This suggests that acclimation to a complex, operational centrifuge configuration (e.g., 3D head tilts and a changing orientation relative to the spin axis) may require more generalized and potentially longer training protocols. The second way our configuration differs is that in centrifugation, the rider’s head might be off-axis, producing centripetal acceleration stimulus to the otoliths of the vestibular system, which is negligible for our on-axis configuration. However, we note that any configuration here on Earth has the presence of gravity also stimulating the otoliths, which would not be present during centrifugation either on orbit or in transit. Our ground-based results suggest that substantial acclimation to the CC illusion is feasible through personalized, incremental training. These approaches will eventually need to be validated in microgravity using a human centrifuge in space.
There is some evidence that suggests that the CC illusion is less provocative in a reduced-gravity environment, both on orbit [17] and during parabolic flight [6, 16]. Thus, our ground-based results may provide a lower bound for the tolerable spin rate. We note that parabolic flight allows for only 20 seconds of microgravity at a time [14], which may be insufficient for all vestibular stimuli to have equilibrated prior to head tilts (e.g., we allow 30 seconds between tilts). Further, parabolic flight does not replicate the neurovestibular adaptations to microgravity that astronauts will undergo during extended orbital spaceflight [30]. While further testing in microgravity is needed, we suggest that if 17 RPM is tolerable on Earth, it is reasonable to expect that at least 17 RPM is likely to be tolerable in microgravity.
Mechanisms of acclimation and implications
Our study did not aim to quantify any altered sensorimotor responses (e.g., perception of head tilt, altered VOR) following each spin session. Nonetheless, no subjects exhibited overt sensorimotor impairment (e.g., poor balance or coordination) and no subjects reported motion sickness or disorientation upon session conclusion. This suggests that the acclimation was “context-specific” [25] to some extent, such that subjects could readily switch back to sensorimotor processing appropriate for the non-rotating environment. This contrasts previous investigations in the 1960s that did find post-rotation after-effects causing decrements in balance and locomotion as a result of constant rotation for days in a slow rotation room (SRR) [9, 15]. A potential explanation is that dual-adaptation is possible with short-duration, intermittent centrifugation. Operationally, this is relevant for on-orbit or in-transit short-duration centrifugation, as it is critical to maintain appropriate sensorimotor function in the stable spacecraft environment between centrifugation sessions. In spaceflight, centrifugation will also require transitioning to and from microgravity and a gravity-rich environment. Investigating tolerance to this transition occurring regularly will require a human centrifuge on orbit.
We note that this acclimation may only be beneficial operationally if it can be retained. Preliminary results suggest that subjects are able to retain of most of their gained acclimation for at least thirty days without CC illusion exposure (i.e., normal activity) [1]. Notably, when we administered a shortened 3-day personalized acclimation protocol following a 30-day break, subjects acclimated at a faster rate during these 3 days than they had during their initial 10-day exposure. This would suggest that even if subjects did not retain all of their gained acclimation, they would be able to regain at a more rapid rate.
The personalized, incremental protocol developed in this study is a tolerable approach to expose subjects to the CC illusion without eliciting severe motion sickness, as evident by our 0% dropout rate. Future work may investigate whether the efficacy of acclimation and motion sickness tolerability was the result of incremental increases in spin rate or protocol personalization. The personalization aspect (i.e., each subject’s spin rate was incremented based upon his/her responses) may be critical for management of motion sickness, especially in highly susceptible subjects. However, personalized acclimation may not always be feasible in an operational setting (e.g., a single centrifuge being utilized by multiple astronauts simultaneously). Therefore, next steps should assess the efficacy and tolerability of an incremental but non-personalized approach.
Conclusions
Acclimation to the CC illusion is critical to the feasibility of future short-radius centrifuge designs for on-orbit or in-transit AG applications. Though there are several challenges associated with short-radius centrifugation, the limiting factor appears to be acclimation to the CC illusion. We developed a personalized protocol to increase all subjects’ tolerability of the CC illusion, even those highly susceptible to motion sickness. Subjects acclimated from an average beginning CC illusion threshold of 1.8 RPM to an average ending threshold of 17.7 RPM after 10 sessions over 2 weeks. This 17.7 RPM is the spin rate required to create 1G at the feet for a 5.72 m diameter centrifuge, a realistic size for the interior of a spacecraft. The linear trend of increasing CC illusion threshold suggests that further acclimation is possible, and that all subjects could potentially reach a desired spin rate with ample exposure. Ultimately, this investigation demonstrates that substantialacclimation to the CC illusion is feasible and tolerable. Enabling high-speed rotation is essential for short-radius centrifugation to create AG, a comprehensive countermeasure for mitigating physiological deconditioning, thus enabling near-future, long-duration space exploration.
Footnotes
Acknowledgments
This work was supported by a NASA Space Technology Research Fellowship.
Preliminary results were presented at the following conferences & scientific meetings:
Human Research Program Investigators’ Workshop 2017; Aerospace Medical Association Scientific Meeting 2017; Human Research Program Investigators’ Workshop 2018; IEEE Aerospace Conference 2018; Aerospace Medical Association Scientific Meeting 2018.