
Abstract
BACKGROUND:
It has not yet been tested whether averaged gain values and the presence of pathological saccades are significantly altered by manual data selection or if data selection only done by the incorporated software detection algorithms provides a reliable data set following v-HIT testing.
OBJECTIVE:
The primary endpoint was to evaluate whether the averaged gain values of all six SCCs are significantly altered by manual data selection with two different v-HIT systems.
METHOD:
120 subjects with previously neither vestibular nor neurological disorders underwent four separate tests of all six SCCs with either EyeSeeCam® or ICS Impulse®. All v-HIT test reports underwent manual data selection by an experienced ENT Specialist with deletion of any noise and/or artifacts. Generalized estimating equations were used to compare averaged gain values based on unsorted data with averaged gain values based on the sorted data.
RESULTS:
EyeSeeCam®: Horizontal SCCs: The estimate and the p-value (shown in parenthesis) for the right lateral SCC and the left lateral SCC were 0.00004 (0.95) and 0.00087 (0.70) respectively. Vertical SCCs: The estimate varied from –0.00858 to 0.00634 with p-values ranging from 0.31 to 0.78. ICS Impulse®: Horizontal SCCs: The estimate and the p-value for the right lateral SCC and the left lateral SCC were 0.00159 (0.18) and 0.00071 (0.38) respectively. Vertical SCCs: The estimate varied from 0.00217 to 0.01357 with p-values ranging from 0.00 to 0.17. Based upon the averaged gain value from the individual SCC being tested, 148 tests before and 127 after manual data selection were considered pathological.
CONCLUSION:
None of the two v-HIT systems revealed any clinically important effects of manual data selection. However, 21 fewer tests were considered pathological after manual data selection.
Keywords
Introduction
The video Head Impulse Test (v-HIT) is a fairly new test that primarily evaluates the function of the semicircular canals (SCCs) through testing of the vestibulo-ocular reflex (VOR). Prior to testing, the subject is fitted with a pair of goggles designed for v-HIT testing and the test is performed with the subject seated in a solid non-revolving chair. The subject is then instructed to maintain fixation on a marking on the wall while the examiner delivers head impulses that are fast, brief and unpredictable in both direction and timing. As the goggles contain both a camera and a gyroscope, recordings of both unilateral eye movements and recordings of head movements are possible. The accompanying company software is, after completion of the test, able to calculate an averaged gain value as a measure of the function of the individual SCCs (VOR). The gain value is defined as the peak eye velocity divided by the peak head velocity [9].
Compared to other vestibular tests that evaluate SCC function, v-HIT stands out advantageous by being fast to carry out (duration of 5–10 minutes) and by not being nauseating to the subjects [5]. In addition, several studies have found v-HIT to be a very specific test with a high positive predictive value [1, 7]. Based on the above-mentioned benefits, v-HIT testing is currently recommended as the initial objective test for examination of vertiginous subjects.
The two most widely distributed v-HIT systems have been validated against scleral search coils, and for this reason the v-HIT test is considered an objective test [3, 24]. However, the authors of this article agree that the v-HIT test is a very technical demanding test for the clinician to carry out; especially when performing vertical SCC testing. As mentioned initially, the head impulses must be fast and brief with recommended maximum head velocities between 50 to 250 degrees per second and with amplitudes ranging between 5 and 20 degrees. Furthermore, the head impulses must be unpredictable both in direction and timing [5], as Rey-Martinez, Jorge, et al. found that predictability may affect the saccade latencies [21]. When considering potential effects on gain values a newly published study, including subjects with neither neurological nor vestibular disorders, concluded that awareness of both the direction and timing of the head impulses did not significantly affect the averaged gain values [27]. Finally, the test is also susceptible to several sources of errors and noise and artifacts with goggle slippage or poor pupil detection being two of the most common ones. Concomitant errors with noise and/or artifacts, including both of the abovementioned artifact triggers, are seen more frequently with testing of the vertical SCCs [3, 24]. Artifacts and noise are common and might contribute to a false or compromised averaged gain calculation [14], appearance of saccades and ultimately lead to a misinterpretation of the final test results. See Fig. 1.
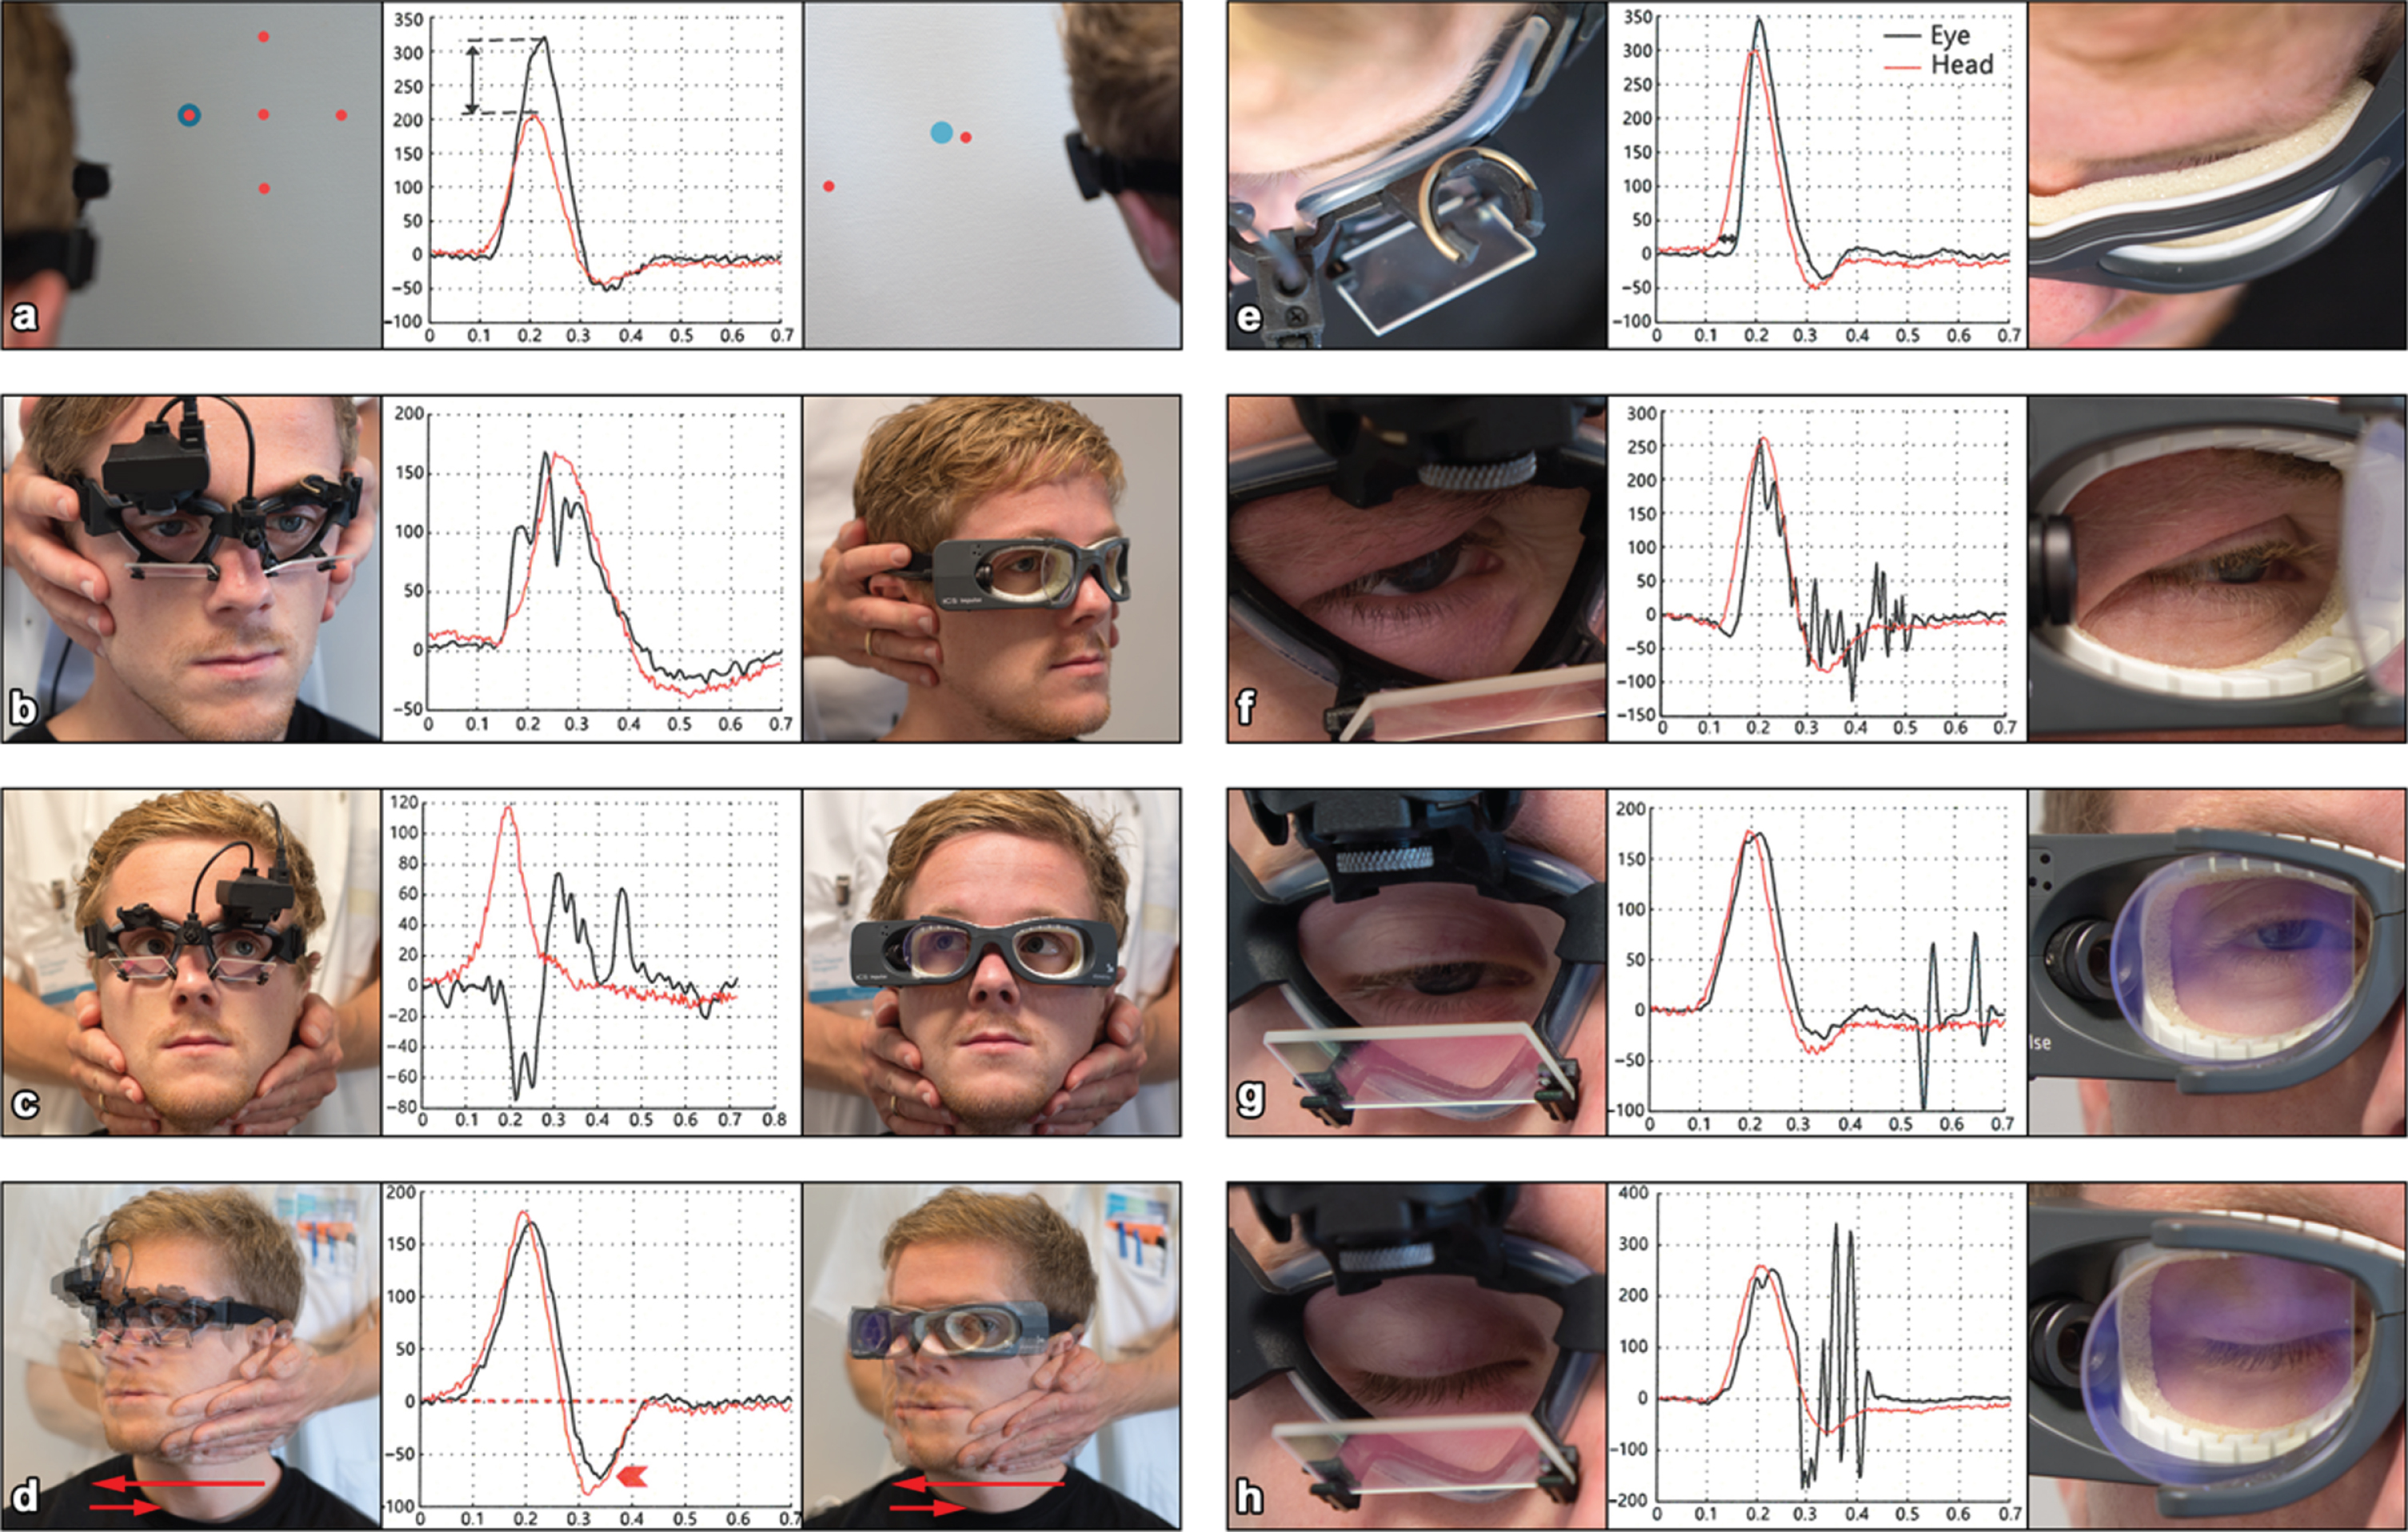
Visualization of eight different types of artifacts. Each type of artifact is illustrated by a graph as well as accompanying images depicting the test situation triggering the individual artifact. The image on the left side shows a subject being tested with EyeSeeCam® whereas the image on the right side shows a subject being tested with ICS Impulse®. The appurtenant graph shows traces for eye- and head movements related to the artifact. (a) Wrong calibration (high gain). (b) Touching of goggles (two peaks). (c) Subject inattention (eye trace in the wrong direction). (d) Bounce (head overshoot). (e) Loose strap (delay/phase shift). (f) Pupil tracking loss (trace oscillations). (g) Mini-blink (pseudo-saccade). (h) Blink (pseudo-saccade). Graphs [14] re-printed by permission of Karger Publishers.
The two v-HIT systems used in this study have automatic detection algorithms incorporated in their software. These algorithms detect head impulses containing either head- or eye movements that do not meet certain predefined criteria. ICS Impulse® discards impulses during and after testing whereas EyeSeeCam® discards impulses only after testing is completed. Despite these automatic detection algorithms, it is often a prerequisite for the examiner to do manual data selection upon completion of the v-HIT test as head impulses containing artifacts and/or noise are often classified and accepted as valid head impulses [14]. This process is time consuming but, more importantly, it renders the test susceptible to a certain amount of subjective assessment. For the clinician to make this subjective assessment, some level of experience is required. This might raise some concern, as tests performed by inexperienced clinicians, presumably, will be more susceptible to sources of errors and noise and/or artifacts [2]. As a direct consequence hereof, more extensive removal of artifacts is anticipated when a novice has performed the v-HIT test.
To our knowledge, it has not yet been tested whether averaged gain values are significantly altered by manual data selection or if data selection done by the incorporated detection algorithms are sufficient enough to enable clinical evaluation of the VOR thereby making manual data selection redundant.
Therefore, the primary objective of this study was to evaluate if manual data selection significantly alters averaged gain values following a complete v-HIT test of all six SCCs with two separate test systems; EyeSeeCam® (Interacoustics, Denmark) and ICS Impulse® (GN Otometrics, Denmark).
Materials and methods
Study design
This study was conducted as a prospective cross-sectional study.
Subjects
Enrolment and testing of all subjects were done at the Department of Otolaryngology, Head & Neck Surgery and Audiology, Aalborg University Hospital, Aalborg, Denmark.
Of a total of 120 subjects were included in this study, 60 subjects were tested with EyeSeeCam® and 60 subjects were tested with ICS Impulse®. The subjects included were either patients scheduled for a regular appointment at the Department or volunteers.
Inclusion criteria were limited to an age range between 18 and 65 years. The following exclusion criteria were set up to make sure that the subjects included had no previous history of neither vestibular nor neurological disorders. Therefore, subjects were excluded if they had been diagnosed with a vestibular disorder, had undergone ear surgery, had known central nervous system (CNS) disorder, had experienced uni- or bilateral sudden hearing loss, had a Dizziness Handicap Inventory total score of more than 14 or had been unable to cooperate during examination and/or testing.
As part of the enrollment process, subjects were asked to fill out the Dizziness Handicap Inventory questionnaire (DHI). Subjects with a total score of 15 or above were excluded, as a score below 15 is considered as being equal to having no dizziness handicap [16]. Furthermore, all subjects underwent gross eye movement examination. Video Frenzel goggles were used to rule out spontaneous nystagmus (with or without fixation) as well as gaze induced nystagmus. Any pathological finding(s) resulted in exclusion.
A total of 156 subject were assessed for eligibility and 36 were excluded. For the number of excluded subjects grouped according to the individual exclusion criteria, see Fig. 2.
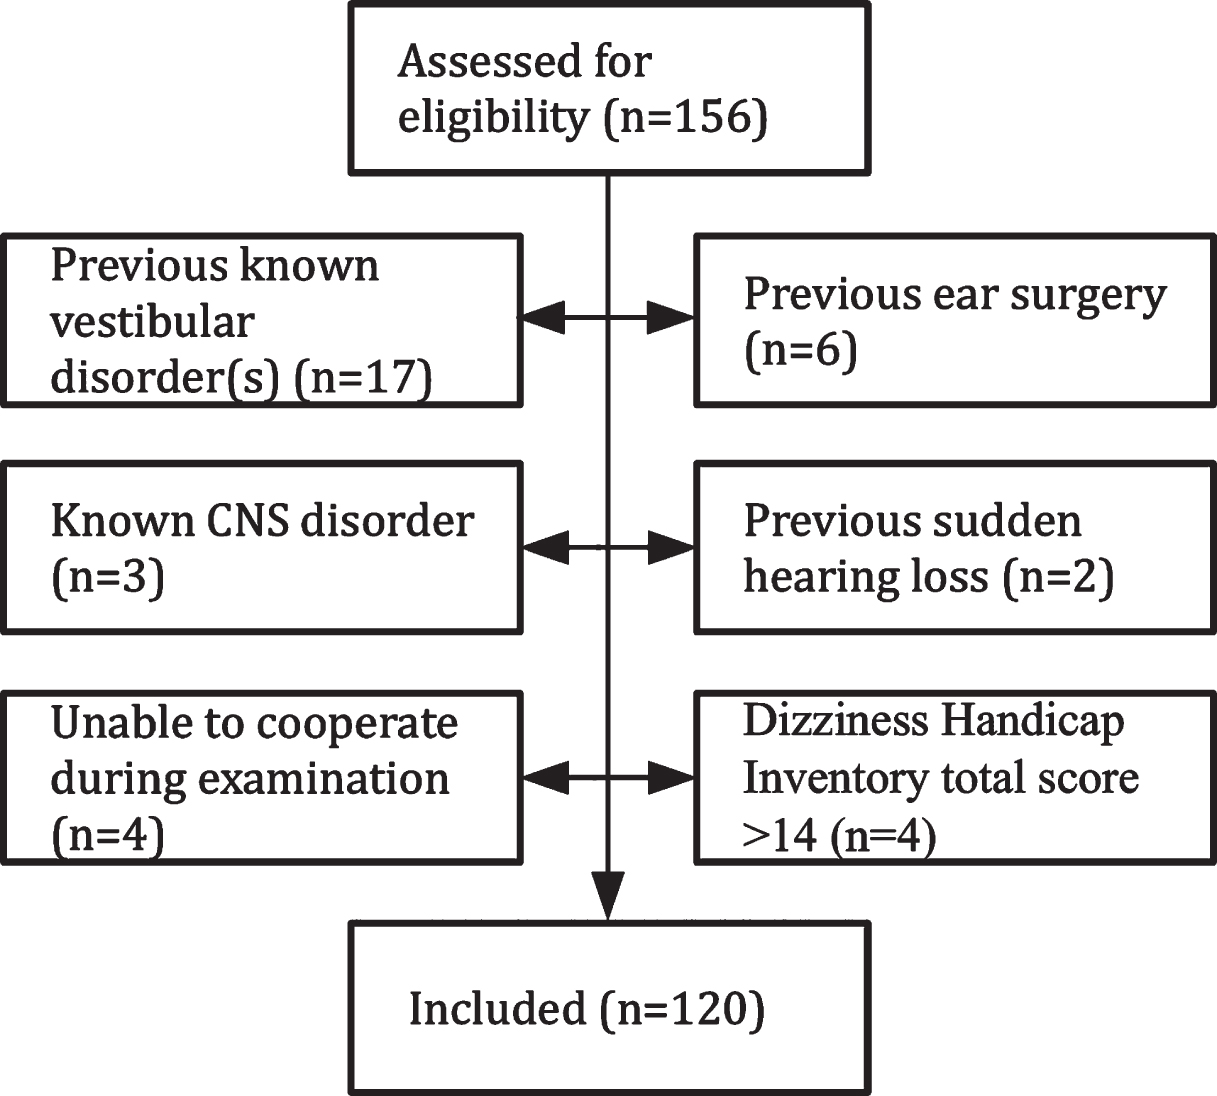
Trial profile.
The study was approved by The North Denmark Region Committee on Health Research Ethics in accordance with the Declaration of Helsinki of 2013. An approval from the Danish Data Protection Agency was also obtained.
Surroundings
To ensure that subjects were tested under the same conditions in terms of lightning, placement of the wall markings, placement and type of chair used for testing etc. all subjects were tested in the same room. The room was normally lit to avoid noise caused by poor tracking of the pupils (dilated pupils) [5]. The subjects were seated in a solid non-revolving wooden chair. The chair was placed on markings on the floor to make sure that all subjects were tested in the same position. These markings were placed according to the manufacturer’s recommendations. EyeSeeCam® markings were placed at a 1.5-meter distance perpendicular to the wall. Three different markings for ICS Impulse® were placed at a one-meter distance to the wall. One marking was placed perpendicular between the chair and the wall and the two other markings were placed with the chair turned 45 degrees to each side. Finally, taking into account that subjects would have different heights, three fixation dots were placed on the wall at different heights with a 10 cm gap between each dot. The subjects were then instructed to maintain eye fixation on the dot aligned with their eye levels throughout the entire test.
Experimental procedure
All subjects underwent four separate complete tests of all six SCCs. Following enrollment in the study, each subject was randomized to undergo testing with one of the two v-HIT systems; either EyeSeeCam® or ICS Impulse®. Furthermore, pre-test randomization included order of paired SCC testing as well as order of the two examiners who performed all the tests. Each examiner completed two separate tests of all six SCCs with each subject. Examiner 1 was a senior doctor and ENT Spe-cialist employed at the Department of Otolaryngology, Head & Neck Surgery, Aalborg University Hospital, Aalborg, Denmark with several years of experience with vestibular research, clinical work, and v-HIT testing. Examiner 2 was a medical student with no previous experience except sparse pre-trial practice. Every v-HIT test was preceded by a standard calibration of the equipment according to the manufacturer’s guidelines. Every test included testing of the two horizontal SCCs and the four vertical SCCs: right-anterior-left-posterior (RALP) and left-anterior-right-posterior (LARP). Subjects tested with EyeSeeCam® were tested by means of the 3D v-HIT method whereas subjects tested with ICS Impulse® were tested by means of the 2D modified v-HIT method [18].
EyeSeeCam® consists of a high-speed digital camera (220 Hz) and a gyroscope measuring angular acceleration. This device is mounted on a pair of lightweight goggles. This goggle allows the camera to be mounted on either side but was placed on the right side as default. OtoAccess software version 1.2.1 was used with EyeSeeCam®. ICS Impulse® consists of a camera (250 Hz) recording right eye movements and a gyroscope recording angular acceleration; both integrated into a lightweight goggle. OTOsuite Vestibular Software Version: 4.00 Build 1286 was used with ICS Impulse®.
Before each test, goggles were tightened firmly to avoid goggle slippage [22]. Both examiners used the chin-hand technique in an effort to standardize the test and to avoid goggle slippage [20]. Furthermore, both examiners were careful not to touch or move the goggles during the application of head impulses. Following completion of each test, the experienced examiner performed manual data selection, aiming to reach at least ten artifact-free head impulses for each SCC [17]. No clear definition of either noise or artifacts exist. Individual head impulse traces were removed either if the individual gain value was considered an outlier or if the traces representing head- and eye velocities displayed too much noise and/or artifacts. Solely the experienced examiner did interpretation of the individual test results. When doing the evaluation of the test results, several things had to be considered. The experienced examiner considered the known types of artifacts during the process of manual data selection, but in order to mimic current clinical decision making, no formal criteria were set up. Known major artifact generators are calibration problems with inappropriately high (>1.3) or low (<0.8/0.7) VOR gain values without consecutive re-fixation saccades, blink generated oscillations crossing the baseline (which do not qualify as saccades), goggle slippage with phase shifts as well as unclassifiable artifacts that in one way or the other restricts interpretation. See Fig. 1 for a detailed description and illustration of these. Conditions making calculation of the gain value imprecise or incorrect like trace oscillations (which do not qualify as saccades) were considered noise in this regard. A frequent condition causing trace oscillations was poor pupil tracking because of for instance mascara and/or droopy eyelids.
Gain values were considered pathological if gain values were below 0.8 for the lateral SCCs and if gain values were below 0.7 for the vertical SCCs. Gain values above 1.2 was considered falsely high due to artifacts or noise as these gain values must be considered non-physiological.
The EyeSeeCam® software calculates both “regression gain” and “instantaneous gain” whereas the ICS Impulse® software calculates gain as the ”area under the curve” (AUC). With EyeSeeCam® regression gain was used, as gain values based on few data points at around peak head velocity has been proposed to be more susceptible to sources of errors [13]. Regression gain is defined as the slope of a best fitted line through data plots based on the absolute values of peak eye velocity and peak head velocity, whereas AUC is defined as the ratio between the area under the curve for eye velocity and the curve for head velocity. For graphs following testing with both v-HIT systems see Figs. 3 and 4.
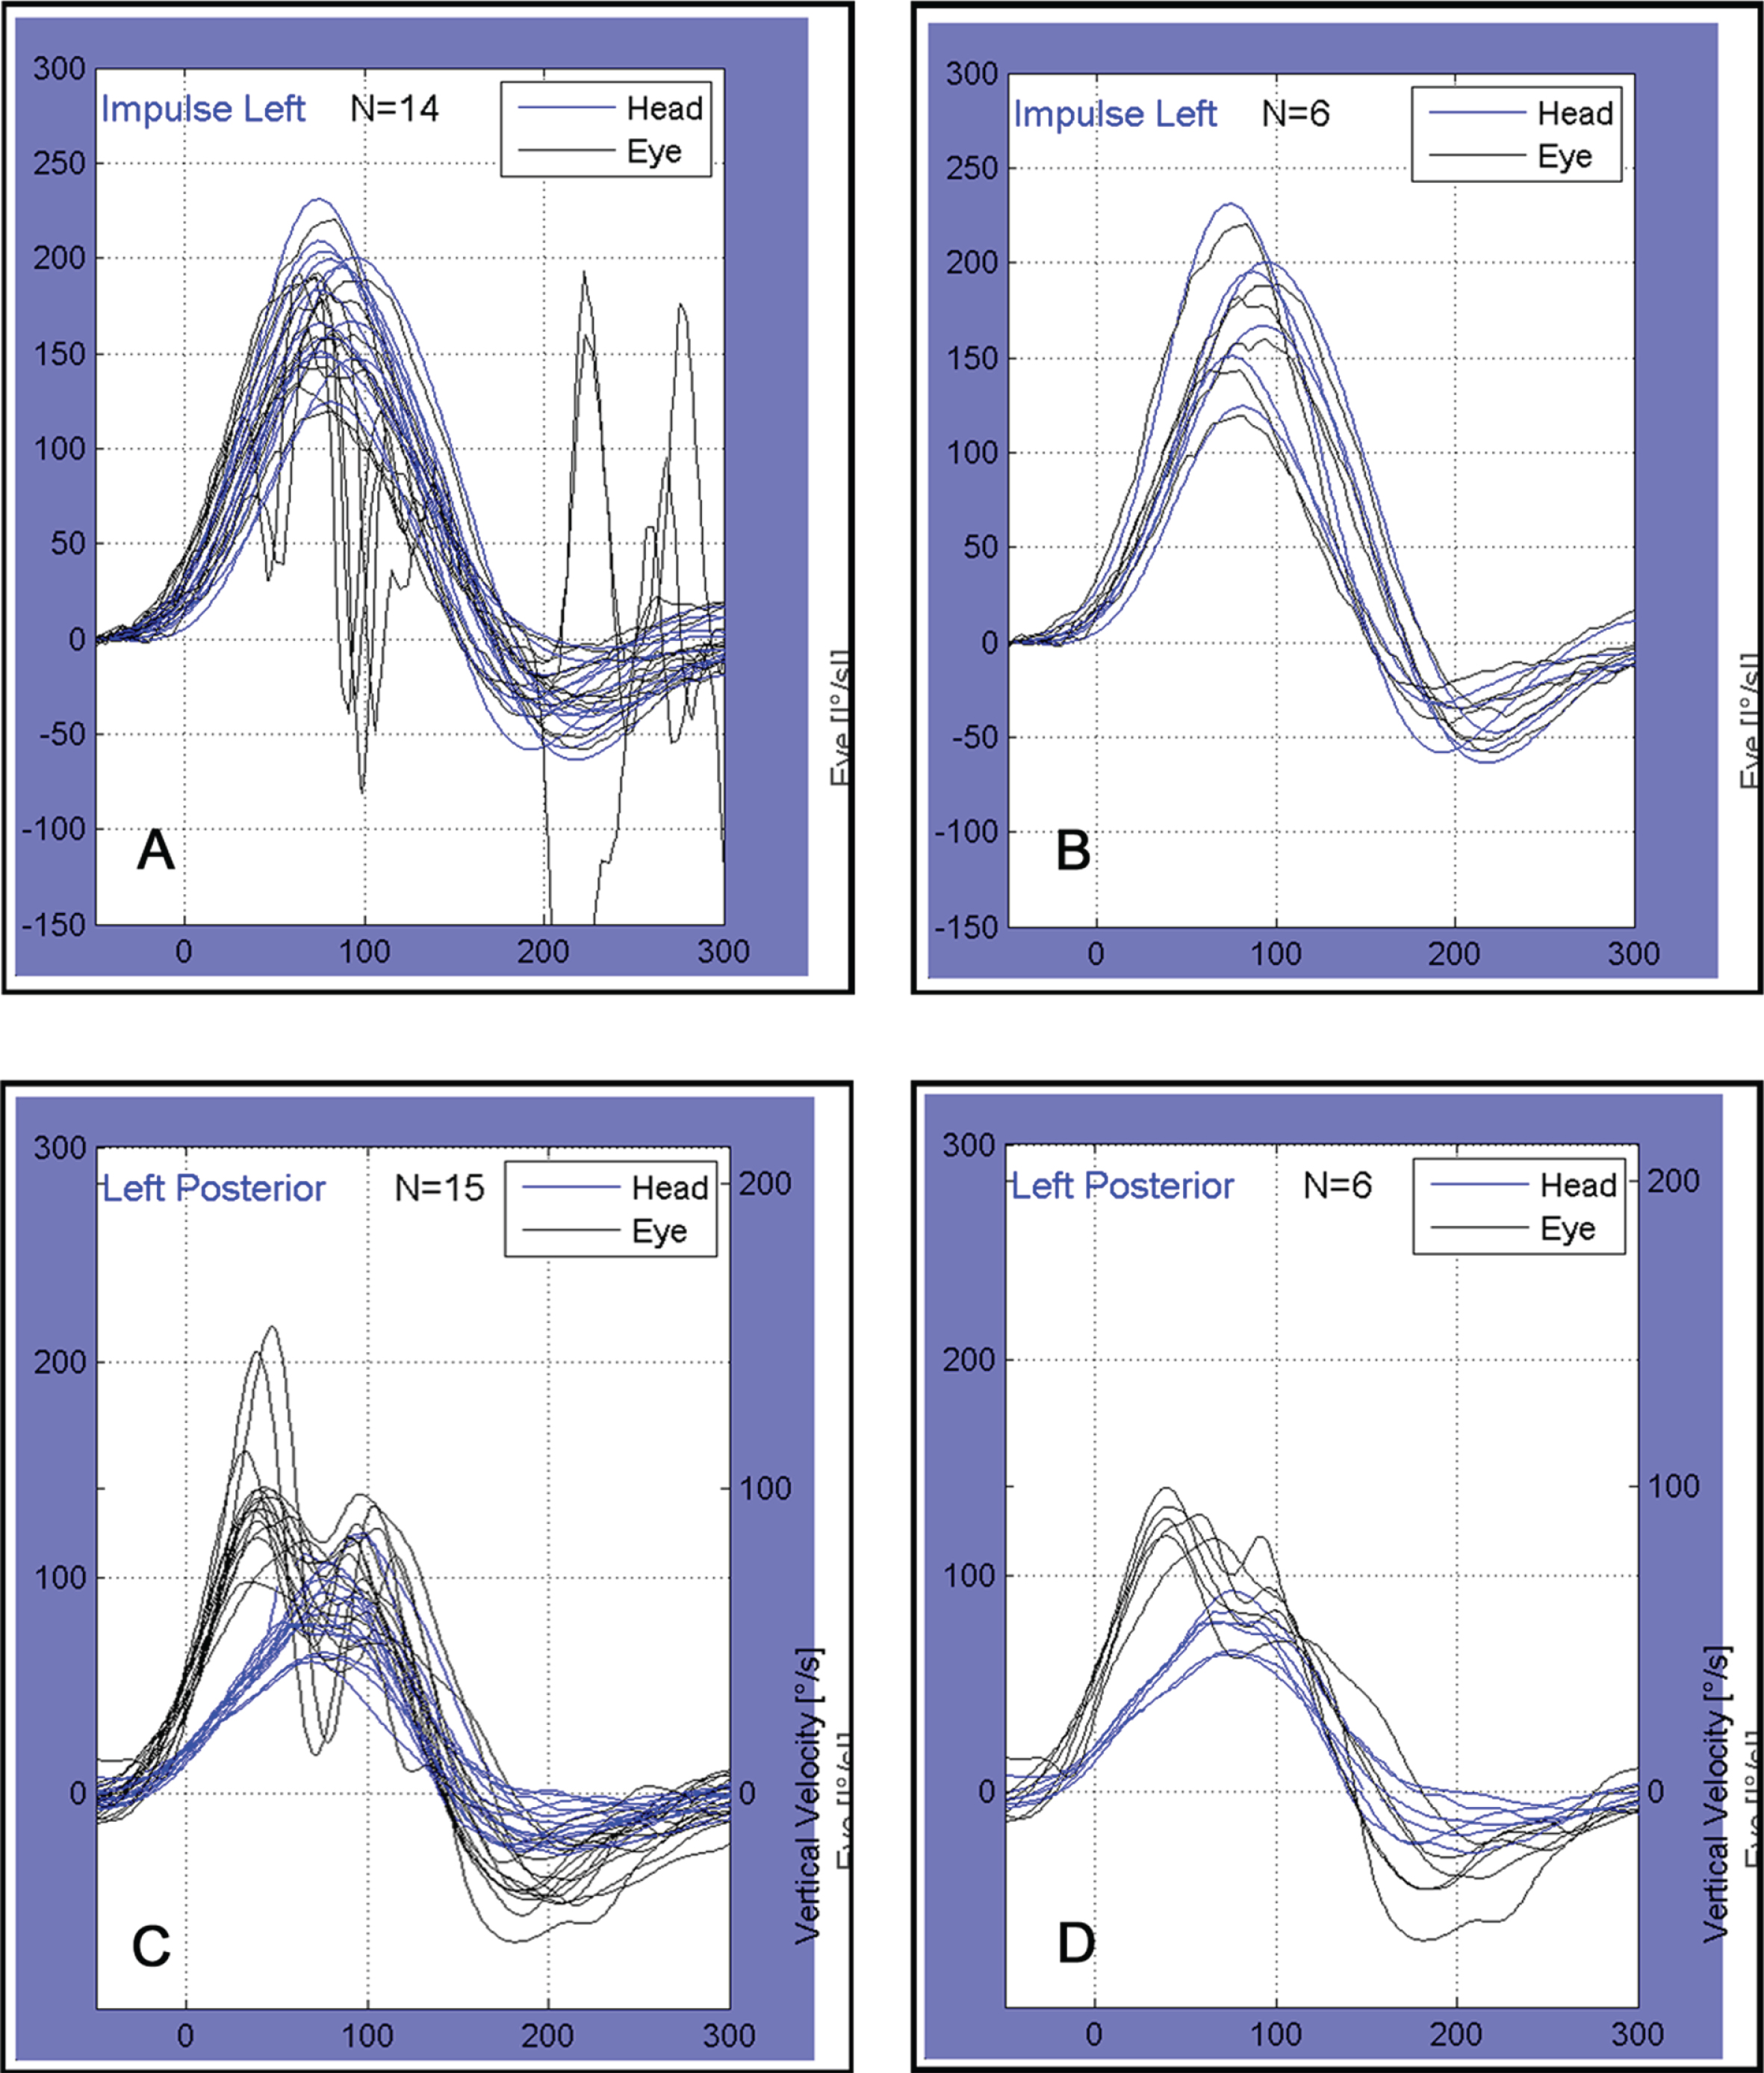
Examples of v-HIT graphs obtained with EyeSeeCam®. x-axis: time (milliseconds), y-axis: velocity (degrees per second). Figures A and B: Graphs representing test affected by noise. Averaged gain values were 1.00 before manual data selection (A) and 0.99 following manual data selection (B). Figures C and D: Graphs representing test affected by goggle slippage and/or poor pupil detection. Averaged gain values were 1.50 before manual data selection (C) and 1.61 following manual data selection (D).
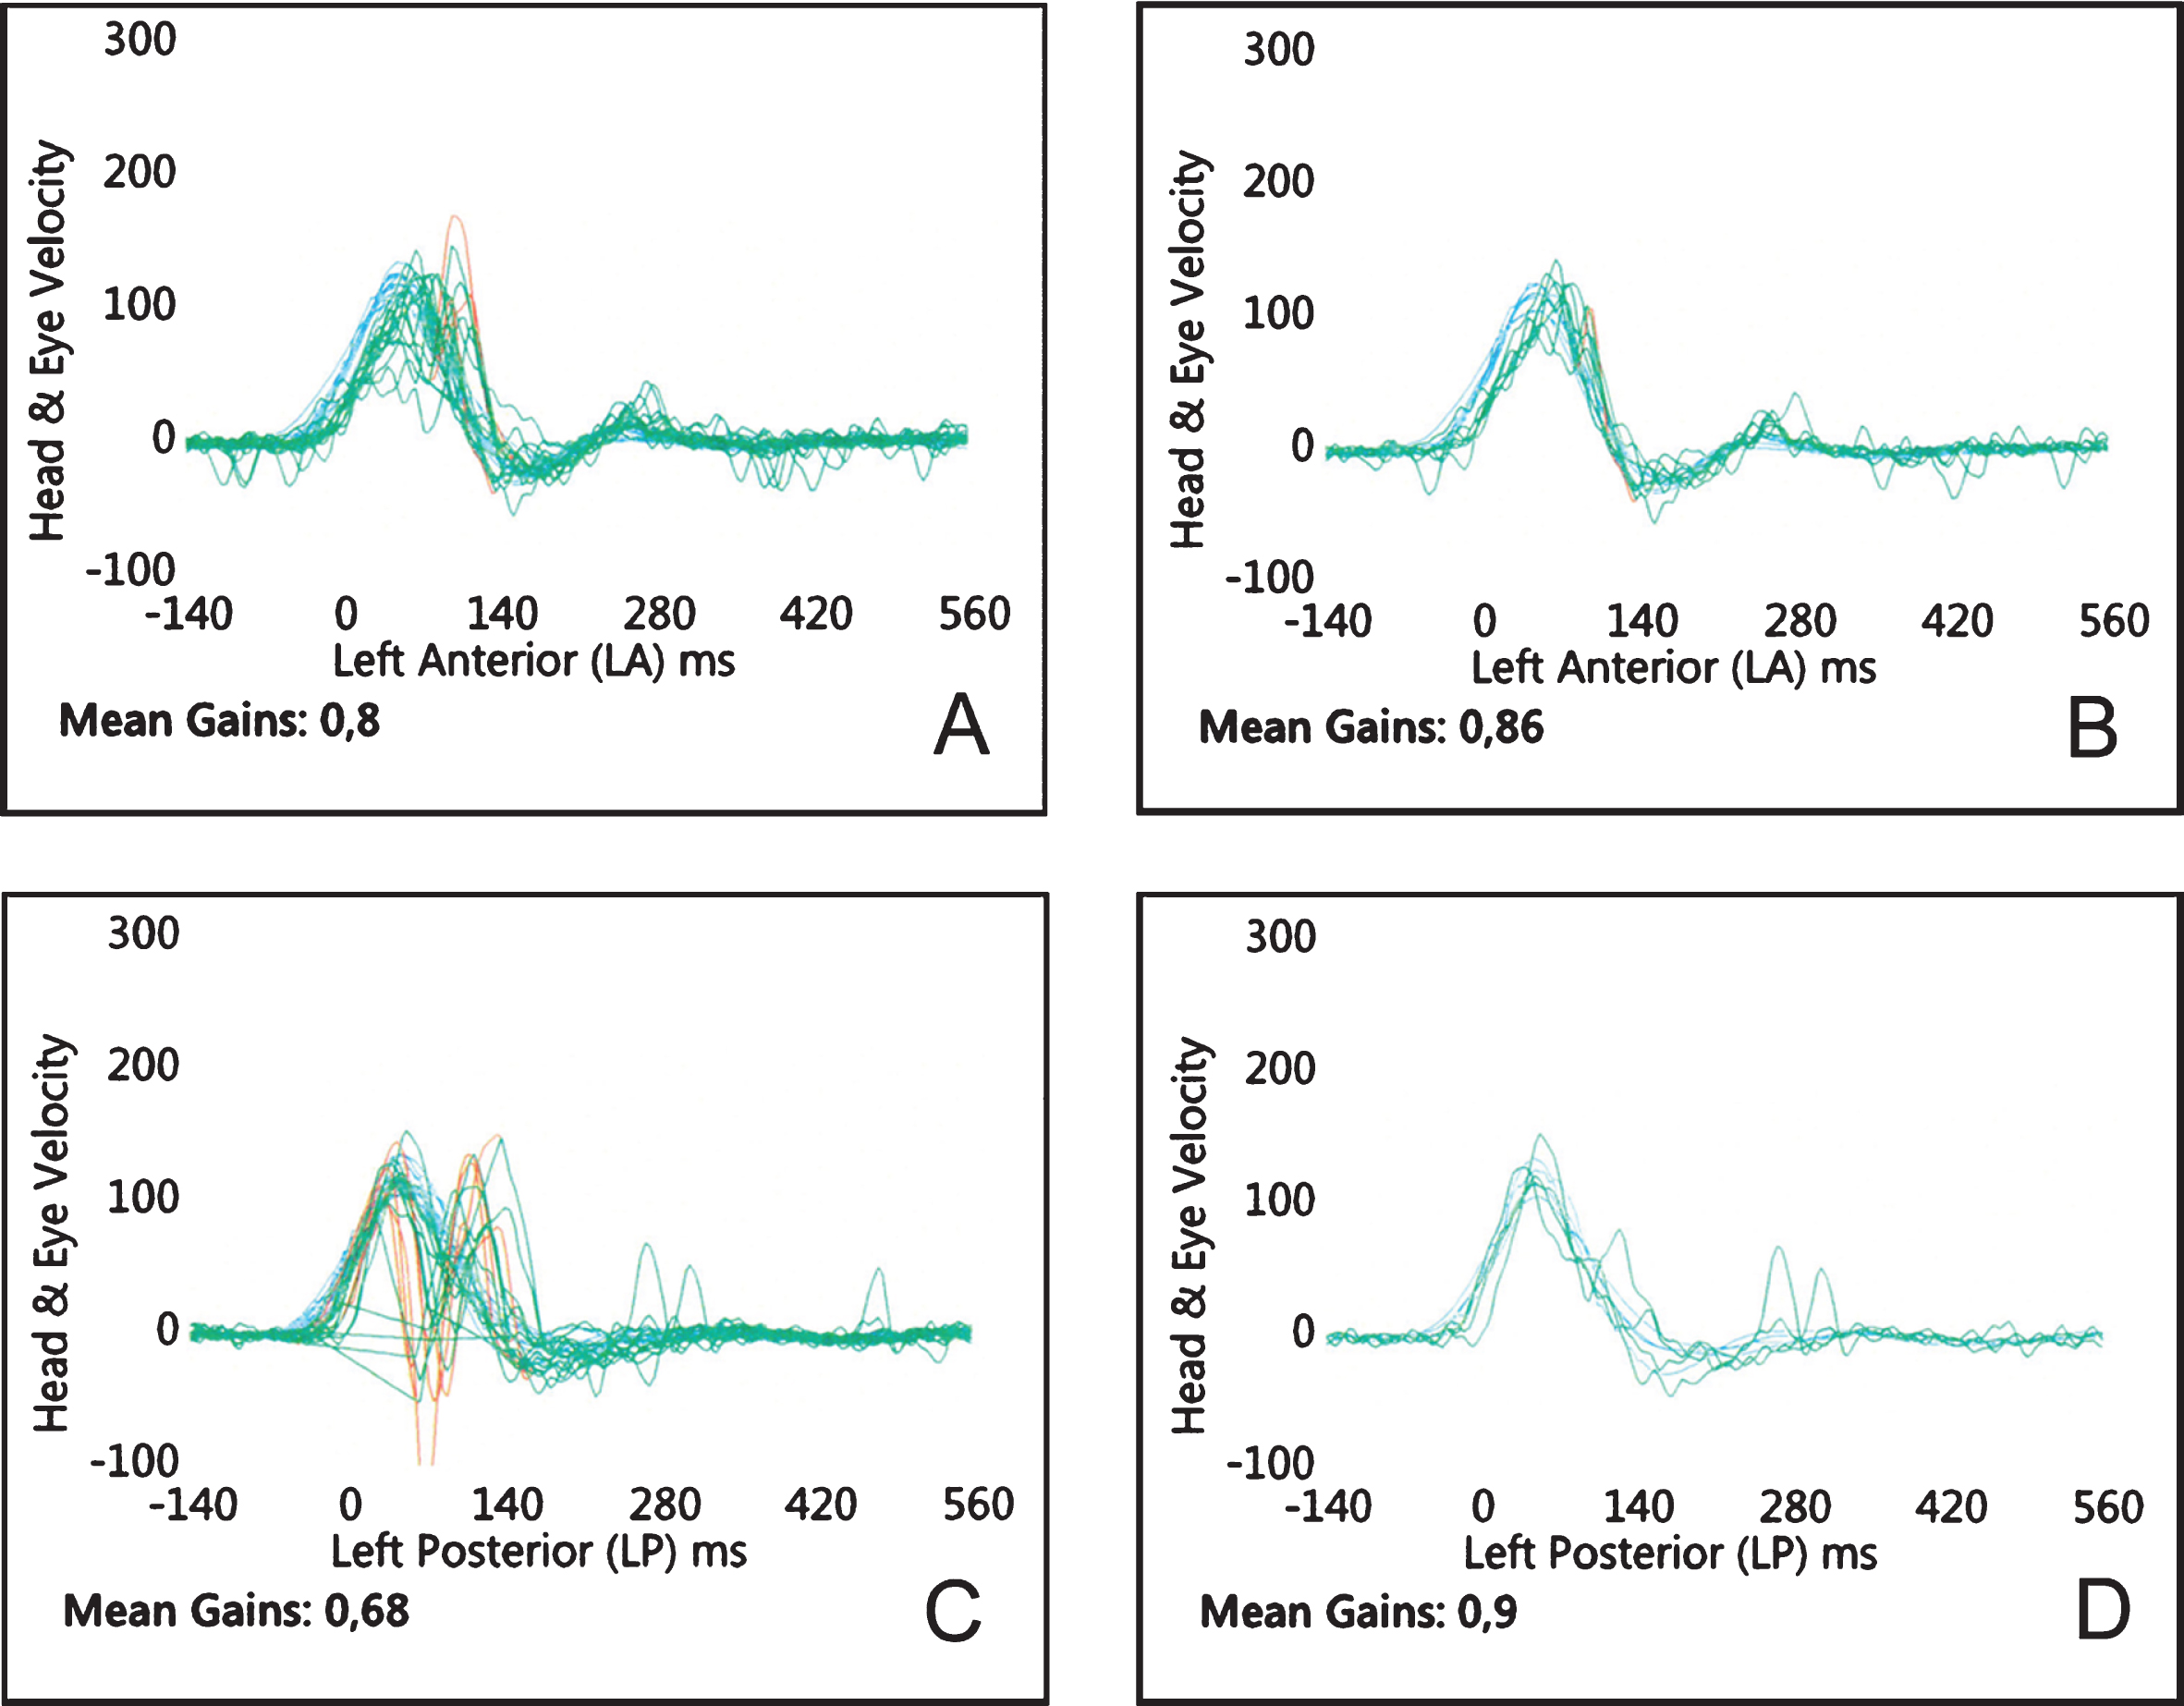
Examples of v-HIT graphs obtained with ICS Impulse®. X-axis: time (milliseconds), y-axis: velocity (degrees per second). Figures A and B: Graphs representing tests affected by noise. Gain values were 0.80 before manual data selection (A) and 0.86 following manual data selection (B). Figures C and D: Graphs representing test affected by goggle slippage and/or poor pupil detection. Gain values were 0.68 before manual data selection (C) and 0.90 following manual data selection (D).
Generalized estimating equations were used to determine whether averaged gain values were significantly altered by manual data selection. This type of model is appropriate for analysing repeated measures data, and it has the advantage that only marginal means needs to be correctly specified for the parameter estimator to be asymptotically normal [8]. The difference between unsorted and sorted averaged gain values were considered as the outcome in the model, and the type of system was included as a fixed effect. Patient ID was included as a random effect, and the correlation structure within patient was assumed to be exchangeable. To investigate the effect of examiner, a variable identifying which examiner performed the test was included as a fixed effect in the model. Effect modification between type of system and examiner was determined by including an interaction term between system and examiner in the model. Separate models were fitted for each SCC. Sensitivity analyses were made to rule out any possible influence on the results from the higher averaged gain values found with EyeSeeCam® compared to ICS Impulse®. For these analyses generalized estimating equations were used, with the percentage-wise differences between sorted and unsorted averaged gain values as the outcome. All analyses were carried out in R, version 3.6.3, using the package “geepack” [8, 26].
Results
No discrepancy regarding age, gender or DHI-scores was found between those tested with EyeSeeCam® and ICS Impulse®. The averaged gain values were high for RALP with EyeSeeCam®. In average, five out of six SCC averaged gain values were lower with ICS Impulse®. With EyeSeeCam®, the average number of deleted head impulses varied from 1.44 to 2.29 whereas the average number of deleted head impulses for ICS Impulse® varied from 0.87 to 2.16. Applicable for five out of six SCCs more head impulses were deleted with EyeSeeCam® than with ICS Impulse®. Overall, more head impulses were deleted for the vertical SCCs. For experimental data see Table 1.
Demographic and experimental data
Demographic and experimental data
Explanatory legend: Demographic and experimental data for all subjects (Overall), subjects tested with EyeSeeCam® and subjects tested with ICS Impulse®. For unsorted gain values please note that RALP testing done with EyeSeeCam® provides higher than expected gain values (bold) and that gain values obtained with ICS Impulse®, in general, are lower than those obtained with EyeSeeCam® for all six SCCs. Also note that in five of six SCCs tested with EyeSeeCam® more impulses were deleted than with ICS Impulse® (italic).
The following results were found for the two systems, using the generalized estimating equations. EyeSeeCam®: For the horizontal SCCs, the estimate (the mean difference between sorted and unsorted averaged gain values) and the p-values for respectively the right lateral SCC and the left lateral SCC were 0.00004 (0.95) and 0.00087 (0.70). For the vertical SCCs, the estimate varied from –0.00858 to 0.00634 with p-values ranging from 0.31 to 0.78. ICS Impulse®: For the horizontal SCCs, the estimate and the p-values for the right lateral SCC and the left lateral SCC were 0.00159 (0.18) and 0.00071 (0.38) respectively. For the vertical SCCs, the estimate varied from 0.00217 to 0.01357 with p-values ranging from 0.00 to 0.17. See Table 2. No effect of examiner was found in the models. Moreover, no effect modification was found between system and examiner.
Mean difference estimates using generalized estimating equations
Explanatory legend: The estimates indicate the mean differences between averaged gain values based on unsorted and sorted data. In the models, system was included as fixed effect and patient id as random effect. P-values below 0.05 indicate significant differences (shown in bold). CI: Confidence Interval.
The sensitivity analyses with the percentage-wise differences showed similar results to those shown in Table 2.
Based upon the averaged gain value from the individual SCC being tested, 148 tests before manual data selection were considered pathological and 127 tests after manual data selection were considered pathological according to the criteria mentioned under 2.3.2 ‘Experimental procedure.’ With EyeSeeCam® one test before and one test after manual data selection and with ICS Impulse® three tests before and three tests after manual data selection for ICS Impulse® were considered pathological for the lateral SCCs. For the vertical SCCs with EyeSeeCam® 74 tests before and 70 tests after manual data selection and with ICS Impulse® 70 tests before and 53 tests after manual data selection for ICS Impulse® were considered pathological. In this study 2880 individual SCC tests were performed. Each SCC test included a minimum of 15 individual head impulses in the plane and direction of the examined SCC. Multiplication of these numbers shows that the results provided is based upon a total of 43.200 head impulses.
For boxplots showing the distribution of gain values based on both the unsorted and sorted data see Figs. 5 and 6.

EyeSeeCam® boxplots based on gain values. Bottom and top of each box represent the first and the third quartile, whereas the band inside the box represent the second quartile. The vertical lines indicate the lowest and highest gain value within 1.5 interquartile range. Outliers are plotted as circles. The figure contains boxplots of all six semicircular canals (SCCs) (la = left anterior; rp = right posterior; lp = left posterior; ra = right anterior; rl = right lateral; ll = left lateral). For each SCC a boxplot based on unsorted (raw) and sorted data are placed next to each other for comparison. Please note that RALP gain values are higher than expected and that a wide variation between individual values are seen. Lateral SCCs show smallest variation between individual gain values.
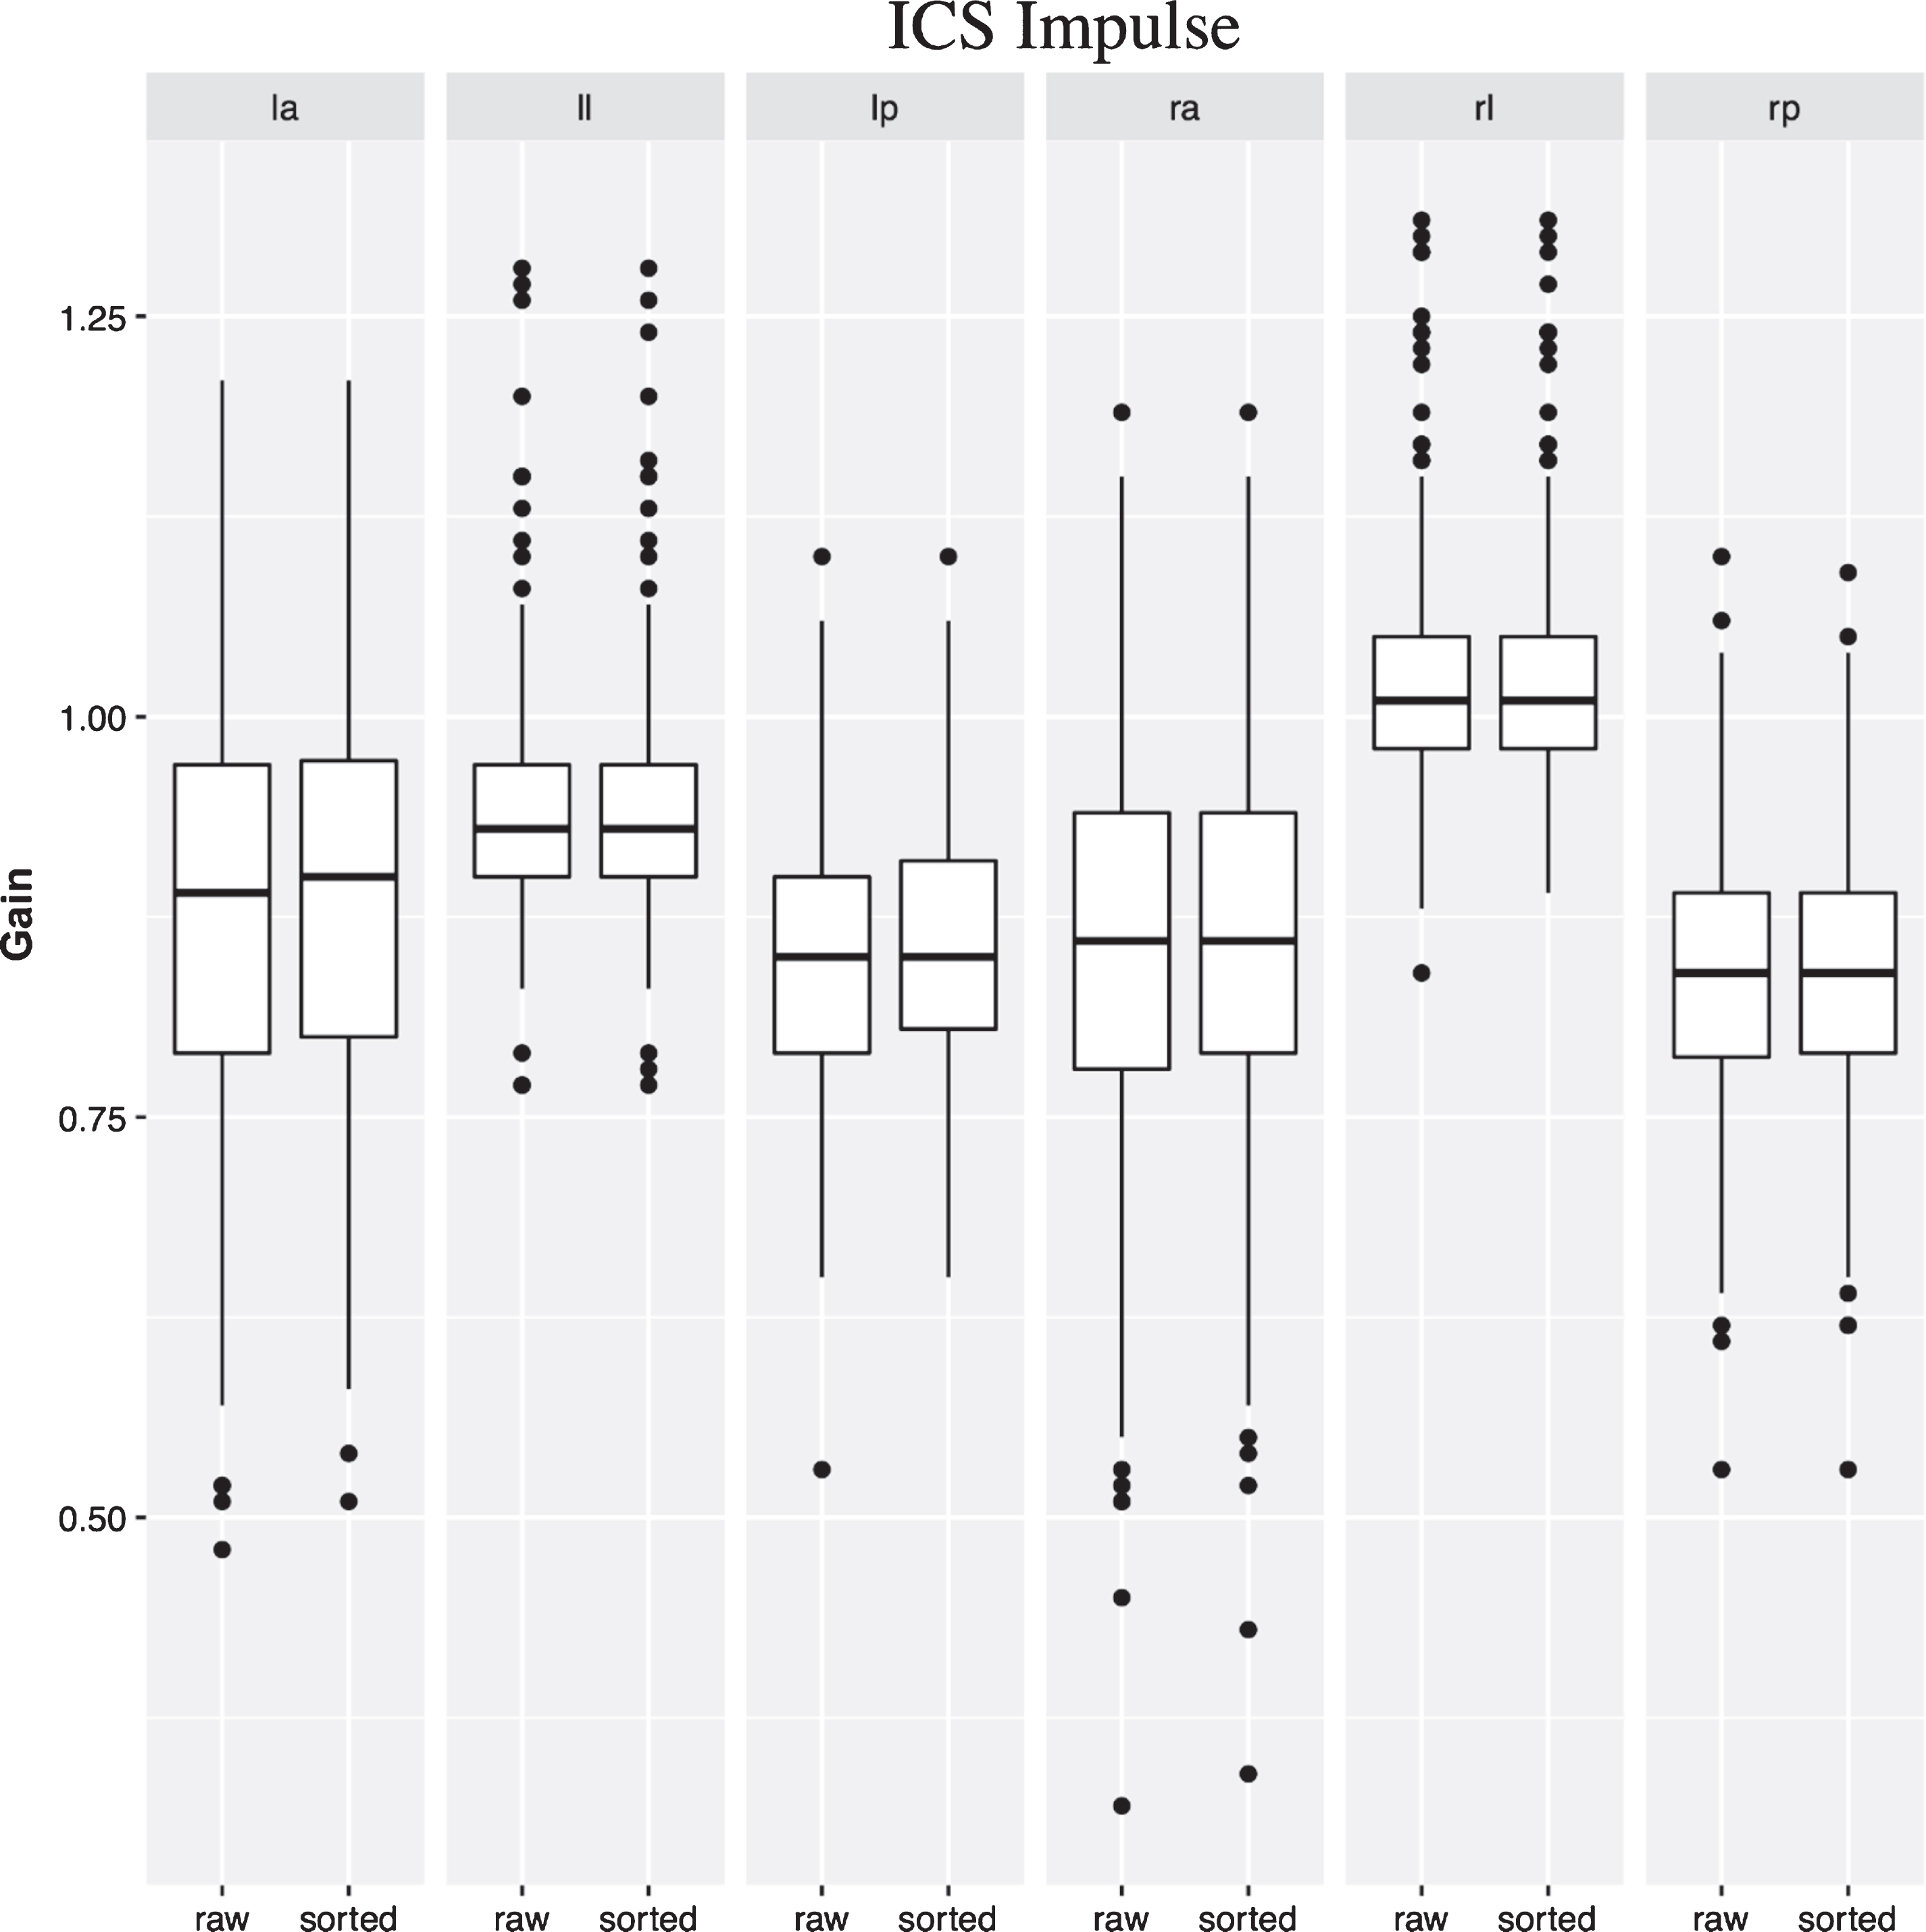
ICS Impulse® boxplots based on gain values. Bottom and top of each box represent the first and the third quartile, whereas the band inside the box represent the second quartile. The vertical lines indicate the lowest and highest gain value within 1.5 interquartile range. Outliers are plotted as circles. The figure contains boxplots of all six semicircular canals (SCCs) (la = left anterior; rp = right posterior; lp = left posterior; ra = right anterior; rl = right lateral; ll = left lateral). For each SCC a boxplot based on unsorted (raw) and sorted data are placed next to each other for comparison. Please note that the lateral SCCs show smallest variation between individual gain values.
Previously, to our knowledge, no studies have examined whether manual data selection potentially alters the results and conclusions made following v-HIT testing.
The present study showed only significant differences in averaged gain values based upon the unsorted and sorted dataset of three vertical SCCs for ICS Impulse®. No significant differences were found for neither all six SCCs with EyeSeeCam® nor for the two horizontal SCCs and one vertical SCC with ICS Impulse®. However, none of the significant differences seen with ICS Impulse® were of clinical relevance, as they would not change whether the vestibular function of a subject was considered normal or compromised. All averaged gain mean differences between unsorted and sorted data were very low and would not have any impact on whether a test would be considered normal or pathological. See Table 2. From Figs. 5 and 6 it is also evident that the distribution of gain values before and after manual cleaning is almost identical. However, if instead averaged gain values from the individual tests were analyzed, 148 tests before and 127 tests after manual data selection out of 2880 tests were considered pathological, showing a difference of only 21. With EyeSeeCam® 75 tests (5.2%) before and 71 tests (4.9%) after manual data selection out of 1440 tests were considered pathological. With ICS Impulse® 73 tests (5.1%) before and 56 tests (3.9%) after manual data selection out of 1440 tests were considered pathological. The conclusions did only change with vertical SCC testing (primarily with the ICS Impulse® v-HIT system) as no change of conclusions were seen with the lateral SCCs before and after manual data selection.
When looking at the data provided in Table 1 and Fig. 5 it is evident, that averaged gain values were higher than expected for RALP testing with EyeSeeCam®. There are no previous studies determining normative averaged gain values for the vertical SCCs with EyeSeeCam® for comparison. One must also consider the fact that up until now there has not been any validative studies with vertical testing and scleral search coils with this v-HIT system. Studies have, however, shown that averaged gain values differ significantly between algorithms/devices [11]. The high averaged gain values might be ascribed to the fact that subjects tested with EyeSeeCam® were tested using the 3D v-HIT method. During testing of the vertical SCCs, the eye movements consist of both a vertical and a torsional component. The system is, however, not capable of detecting torsional eye movements. As EyeSeeCam® uses regression gain, the presence of covert saccades could also result in hyperfunctional averaged gain values. The average gain values for LARP were close to one but had concurrent broad ranges and showed a wide distribution of gain values within the boxplots. Hyperfunctional gain values have, amongst other things, been ascribed to different gain analyzing methods [14]. The fact that averaged gain values for LARP are not as high as those for RALP might also be ascribed to mono-ocular eye movement recording, as all subjects in this study were tested with recordings of the right eye. All horizontal SCCs had averaged gain values close to one, narrow ranges and a narrow distribution of gain values within the boxplots. For the horizontal SCCs, the averaged gain values were similar to those found in other studies [25, 26]. For ICS Impulse®, gain values of all six SCCs were similar to those found in other studies and within the normal ranges [4, 17]. See Table 1 and Fig. 6. The lower averaged gain values of the vertical SCCs compared to the horizontal SCCs have been ascribed to the smaller amplitude of eye movements in the vertical plane than in the horizontal plane [15].
Considering Table 1, it is evident that, in average, more head impulses were deleted with EyeSeeCam® than with ICS Impulse®. Both v-HIT systems discard impulses when certain predefined criteria are not met. From the respective user manuals, it appears that ICS Impulse® discards head impulses when both head- and eye movements do not meet specific criteria whereas EyeSeeCam® primarily discards head impulses when head movements do not meet specific criteria. Neither user manuals specify if and when head impulses are discarded during the test. However, it has been observed by the authors, that ICS Impulse® discards impulses both during and after the test is performed, whereas EyeSeeCam® discards impulses only after completion of the test. This might explain why more head impulses were deleted with EyeSeeCam®, as no head impulses were discarded during the test thereby allowing the examiner to include additional head impulses. Finally, Table 1 shows that the range of deleted head impulses were wider for all but one SCC with ICS Impulse®. This can probably be explained by a lower number of tests being highly affected by sources of errors.
As more head impulses were deleted with EyeSeeCam®, one would expect a larger difference between averaged gain values based on the unsorted and the sorted data than for ICS Impulse®. This is, however, not the case. See Table 2. This is most likely due to the different methods of calculating the averaged gain value. EyeSeeCam® calculates “regression gain” whereas ICS Impulse® calculates the gain value using the AUC method. Therefore, results from this study indicate that averaged gain values, calculated using the AUC method, are more prone to be affected by manual data selection than averaged gain values calculated by means of the “regression gain” method. The AUC method was developed for ICS Impulse® as this method was considered less susceptible to v-HIT artifacts [24]. Before the averaged gain values are calculated, the v-HIT system uses an eye acceleration algorithm to detect saccades. The additional AUC caused by the saccades is then excluded by “de-saccading” the curves. Minor corrective saccades, or simply noise mimicking small saccades, are not automatically excluded from the AUC. In these situations, you would get a higher AUC for the eye velocity curve, thereby getting a false, higher than expected, averaged gain value. If these head impulses, displaying corrective saccades or noise, are removed after the test, a lower averaged gain value will result. The opposite, where lower than expected averaged gain values are computed, is also possible. In the case of goggle slippage or poor pupil detection, typically an M-shaped eye velocity curve is produced. See Fig. 4C. In this case the AUC will decrease, and you will get a false lower averaged gain value. If the head impulses affected by goggle slippage are manually removed, the averaged gain value will increase. See Fig. 4C and 4D. Manual removal of head impulses increases the averaged gain value from 0.68 to 0.90. A study found the variance, when comparing gain values between two different v-HIT systems, was smallest when using AUC [12].
Despite the fact that averaged gain values with ICS Impulse® were significantly affected by manual data selection in the present study, none of the two v-HIT systems reveal any clinically important effect(s) of manual data selection. From Table 2 it is evident that the right anterior SCC for ICS Impulse® has the highest mean difference between averaged gain values based on the unsorted data and averaged gain values based on the sorted data. The mean difference is however only 0.01357. This difference is only of minor importance and is not large enough to potentially alter conclusions based upon the test results. Therefore, in cases where the test is only slightly affected by noise, artifacts or small corrective saccades, it is probably not mandatory to do manual data selection. Following every v-HIT test, however, it is still very important that the clinician determine whether manual data selection is required or not. Artifacts and/or noise might still affect some tests to such an extent that manual data selection or even a re-test is required (see Fig. 4). This is emphasized when looking at the individual tests, where 21 fewer test were considered pathological after manual data selection. Also see Fig. 1 for different types of artifacts.
Previous vHIT experience of the examiner needs to be considered before interpretation and manual data selection is done. One study found that, with horizontal vHIT testing alone, 3.2% of the tests were not interpretable due to restrictive mistakes. The most common reasons for this was google slippage (63.6%), calibration problems (18.2%), noise (13.6%), and low velocity of the individual head impulse (4.6%). The same study also found that the overall rate of restrictive mistakes decreased significantly during the study from 12% per examiner within the first 25 tested participants to 2.1% during the rest of the examinations [10]. These results clarify that there is a non-negligible inter-examiner variation in the quality of the vHIT test results even before interpretation and manual data selection is initiated.
Another study that only examined the horizontal SCCs found that the combination of random artifacts did not appear to affect average gain values, but the recurrence of one type of artifact, such as loss of eye tracking, might elicit disagreement for that measurement suggesting the necessity of removing artifacts after the VHIT examination because they affect its accuracy and precision [23].
Evaluation of vestibular function with vHIT is only reliable when the artifact frequency is low. Currently there is no universal agreement on how to determine and classify artifacts and noise with vHIT testing. As a direct result of this, different examiners with different levels of experience do interpretation and manual data selection individually. Therefore, from a clinical decision point of view, there is a need for development of a Clinical Decision Support System for the Video Head Impulse Test. Before a test may undergo valid interpretation, the quality of the test needs to be determined in a standardized way. To the knowledge of the authors, only one such system has been developed and tested [19]. If one can actually get a standardized artifact index with any given test report, then the quality of a given test may be a substantial part of the evaluation and interpretation of a vHIT test. This might also prove to be an important post-test prerequisite before considering doing either a re-test of the patient or manual data selection.
Strengths and weaknesses
On the basis of the chosen study design, we were able to test whether manual data selection of the dataset significantly affected the averaged gain values of all six SCCs with two separate v-HIT systems. To our knowledge, no previous study has done this. In this study, an experienced as well as a non-experienced examiner carried out v-HIT testing on all subjects. This also enabled us to comment on whether or not the experience of the examiner is of importance regarding the need for subsequent manual data selection. Our results showed that the level of examiner experience does not influence the need for subsequent manual data selection, as no effect of examiner was found in the models. However, any final conclusions cannot be drawn on this matter in this study design. To properly determine whether experience is an important factor a group of experienced examiners versus a group of inexperienced examiners is a prerequisite. Furthermore, one could argue that the medical student in this study was no longer inexperienced towards the end of the study after performing 240 complete v-HIT tests with a total of 21.600 head impulses applied.
Furthermore, the same subject should have undergone complete testing with both v-HIT systems for an ideal comparison of the two v-HIT systems. However, this set-up was concluded to be non-feasible, since each subject then would have to undergo eight complete v-HIT tests. Even testing the same subject four times, as we did in this study, might have affected the results. Undergoing four consecutive tests might have been tiring for subjects, rendering the test more susceptible for artifacts caused by subject inattention [14]. A possible impact on the results was minimized through initial randomization.
In order to mimic current clinical practice, where post-test interpretation is solely done by the clinician (expert opinion), no clear definition or unambiguous identification of artifacts/noise were used during the manual data selection. This, of course, lowers the reproducibility of the study. This issue has been addressed in the discussion section.
Finally, this study only included subjects with normal vestibular function and therefore no conclusions regarding v-HIT testing on subjects actually suffering from vestibular disorders may be drawn. The role and impact of pathological saccades following manual data selection has not been considered in this study, as it only deals with gain alterations. However, the definition of a pathological v-HIT test often includes the combination of low gain values together with concomitant pathological saccades. Furthermore, the subjects included in this study represent a rather heterogeneous population, as subjects were either patients scheduled for a regular appointment at the Department or volunteers. Future studies must clarify whether similar results are applicable for subjects with vestibular disorders.
Conclusion
Averaged gain values for all six SCCs with Eye-SeeCam® and averaged gain values of the lateral SCCs and one vertical SCC with ICS Impulse® were not significantly altered by manual data selection. However, manual data selection following vertical SCC testing with ICS Impulse® did significantly alter averaged gain values for three of the four vertical SCCs. All averaged gain mean differences were very low and would therefore not have any impact on whether a test is considered normal or pathological.
In a few tests the change in averaged gain value had clinical relevance, changing the conclusion of the test from normal to pathological. However, only 0.7% fewer tests were pathological after manual data selection.
The above emphasizes the importance of a mandatory and continuous evaluation of the test quality upon completion of every individual v-HIT test and based upon this, a subsequent decision on whether the test needs to undergo manual data selection or instead must be repeated. However, manual data selection is often not necessary if the test is considered not to be affected by noise/artifacts.
Furthermore, this study included subjects with presumed normal vestibular function and the above may not be applicable for subjects with vestibular pathologies.
Finally, the level of experience did not have any influence on the impact of manual data selection.