
Abstract
BACKGROUND AND AIMS:
An acute unilateral peripheral vestibular deficit (aUPVD) due to vestibular neuritis causes deficient yaw axis vestibular ocular reflex (VOR) gains. Using video head impulse tests (vHITs), we examined phasic and tonic velocity gains of the VOR over time to determine if these differed at onset and during subsequent improvement.
METHODS:
The VOR responses of 61 patients were examined within 5 days of aUPVD onset, and 3 and 7 weeks later using vHIT with mean peak yaw angular velocities of 177°/s (sd 45°/s) and mean peak accelerations of 3660°/s2 (sd 1300°/s2). The phasic velocity or acceleration gain (aG) was computed as the ratio of eye to head velocity around peak head acceleration, and the tonic velocity gain (vG) was calculated as the same ratio around peak head velocity.
RESULTS:
aG increased ipsi-deficit from 0.45 at onset to 0.67 at 3 weeks and 7 weeks later, and vG increased ipsi-deficit from 0.29 to 0.51 and 0.53, respectively, yielding a significant time effect (p < 0.001). Deficit side aG was significantly greater (p < 0.001) than vG at all time points. Deficit side gain improvements in aG and vG were similar. Contra-deficit aG increased from 0.86 to 0.95 and 0.94 at 3 weeks and 7 weeks, and vG contra-deficit increased from 0.84, to 0.89 and 0.87, respectively, also yielding a significant time effect (p = 0.004). Contra-deficit aG and vG were normal at 3 weeks. Mean canal paresis values improved from 91% to 67% over the 7 weeks.
CONCLUSIONS:
Acceleration and velocity VOR gains on the deficit side are reduced by aUPVD and improve most in the first 3 weeks after aUPVD onset. Deficit side aG is consistently higher than deficit side vG following an aUPVD, suggesting that acceleration rather than velocity sensitive compensatory neural mechanisms are predominant during the compensation process for aUPVD.
Keywords
Introduction
When an acute unilateral peripheral vestibular deficit (aUPVD) occurs, the altered vestibulo-ocular reflex (VOR) function can be easily revealed using rapid head rotation impulses, either driven mechanically by a motor or manually applied by hand [9, 27]. With this approach, response-gains for head impulses towards the ipsi- and contra-deficit sides can be separated into phasic (acceleration-dependent) and tonic (velocity-dependent) components, in order to examine how these components of VOR responses change during the compensation processes for an aUVPD, and whether these changes could be associated with known changes in neural processing in, for example, the vestibular nuclei. It is unknown whether changes over time in these phasic and tonic components are different during recovery from vestibular loss due to vestibular neuritis. We reasoned that studying changes in these components over time might provide useful insights into the underlying neural compensatory mechanisms for vestibular loss.
The question also arises if the time courses of the recovery processes of these phasic and tonic components of VOR gain are different for ipsi- and contra-deficit head rotations following onset of aUPVD. This question was raised by Palla and Straumann [27] who noted that if bilateral linear processes were driving VOR responses then both ipsi- and contra-lateral gains should be equally affected by the deficit. They found that contra-deficit response gains were larger than ipsi-deficit gains [27]. They argued, based on the model of Lasker et al. [17], that the observed gain differences were due to rapid changes in non-linear pathways enhancing VOR responses more during contra-deficit head impulses. In this case it might be expected that the recovery processes of phasic and tonic velocity-gains of the VOR should be different for ipsi- and contra-deficit directed head impulses, specifically faster for the contra-deficit phasic responses.
There are also reasons for assuming that a patient’s age would also influence VOR responses following an aUPVD. First, VOR gains of normal subjects decrease slightly with age [22, 28]. Second, there is a trend for ipsi-deficit video head impulse test (vHIT) gains in the elderly to be lower than in young adults at onset and during recovery from a vestibular deficit due to vestibular neuritis [31]. However, other authors [29] have argued that these age effects are not complementary as the characteristics of catch-up saccades during vHITs are different in the elderly with and without peripheral vestibular loss. In an attempt to resolve this difference, we examined the interaction between changes in phasic and tonic vHIT velocity-gains and age following onset of acute vestibular neuritis. Thus based on the considerations noted above, in the current research, we asked the following questions: Are phasic and tonic velocity-gains of VOR responses on the ipsi-deficit side elicited by yaw rotations of the lateral canals equally affected by aUPVD due to vestibular neuritis and do both gains similarly fail to improve to a normal gain by the same amount? Are the phasic and tonic velocity-gains of VOR responses on the contra-deficit side also affected in the same manner as the ipsi-deficit gains? Do differences in phasic and tonic velocity-gains on the ipsi- and contra-deficit side fol-lowing aUPVD occur with increasing subject age?
By using a ramp-step increase in stimulus head velocity, Minor and Lasker [17, 24] computed VOR velocity gains at peak acceleration and steady state velocity following unilateral vestibular neurectomy or canal plugging. These authors provided evidence that the dynamics of the tonic-velocity gain (vG) of the VOR resembled the gain and phase dynamics of regularly firing vestibular afferents, whereas dynamics of the phasic-velocity or acceleration gain (aG) of the VOR resembled the gain and phase of irregularly firing vestibular afferents. When these gains were examined in normal humans and primates, aG was slightly greater than vG (1.0 versus 0.85, respectively) [8, 24]. However, this balance between aG and vG changed drastically following a peripheral vestibular lesion due to labyrinthectomy with the largest changes occurring during compensation of aG on both the lesion and intact sides, with greater changes on the intact side. For this reason, Minor et al. [23] argued that signals underlying aG, are critically important for recovery of VOR gain after a peripheral vestibular deficit [23]. Furthermore, changes to aG and vG were similar to those when the lesion was induced by canal plugging rather than by a neurectomy [16, 17], suggesting that the aG and vG changes were not dependent on the presence of background afferent nerve resting activity.
Improvement in VOR gains following vestibular neuritis can occur both through peripheral recovery and central compensation. On average, peripheral recovery accounts for a 35% improvement and central compensation for a 40% improvement in ipsi-deficit vHIT responses [4]. Given that the response properties of irregularly firing vestibular afferent fibres closely follow those of the phasic-dependent aG and those of regular afferent fibres follow response properties of tonic-dependent vG as suggested by Hullar and Minor [15] then an increase in the proportion of irregular to regular vestibular nerve afferents could be one mechanism underlying a possible increase in aG during peripheral recovery. Sadeghi et al. [30] showed, however, that following labyrinthectomy such a change only occurred for contra-lesion vestibular afferents tending to rule out this mechanism for ipsi-lesion peripheral recovery. At the level of the vestibular nuclei, Newlands and Wei [26] stated that type I vestibular nucleus neurons (those excited by ipsilateral rotation) have sensitivities to rotation in the compensated state which are not different ipsi- and contra-lesionally. In contrast, type II vestibular nucleus neurons (inhibited by ipsilateral rotation) have higher sensitivities ipsi-lesionally. As this later action is mediated by a commissural pathway [32], it represents a central compensatory action. Furthermore, because type I neurons project to the oculomotor nuclei [14] and type II neurons have inhibitory connections to ipsi-lateral type I neurons [32], an ipsi-deficit increase in aG could result via this pathway.
In view of these features described above: 1) a loss of excitatory responding vestibular afferents ipsi-lesionally; 2) an increase in phasic, acceleration-dependent, inputs contra-lesion: and 3) the changes in type II ipsi-lesion vestibular nuclei neurons; all of which could possibly underlie changes in aG and vG, following onset of vestibular neuritis, our working hypothesis was similar to that of Minor and Lasker [23]. Namely, that compensatory increases in acceleration-dependent (phasic) VOR gain (aG) would be more rapid than velocity-dependent (tonic) VOR gain (vG), and that vG would be more affected on the deficit-side. This would be in keeping with the concept that the effect of vestibular neuritis (VN) on VOR gains is more similar to the effect seen with vestibular neurectomy rather than the effect seen with semicircular canal plugging as it is the vestibular nerve that is affected by neuritis [6]. As far as we are aware, this is the first report on acute and compensatory changes in phasic and tonic velocity-gains for head impulse tests of VN patients. We also compared these gains with those reported for healthy normal subjects [28].
Methods
Data acquisition
Data was examined from 61 patients with an aUPVD (31 male and 30 female subjects; mean age at onset, 53.3 years, age range 23.0–82.8 years. The deficit was presumed to be caused by vestibular neuritis based on the symptoms of nausea, a caloric irrigation weakness of greater than the upper limit of normality, 30%, and spontaneous nystagmus fast phases beating to the side opposite the caloric weakness. All patients from the 2 data collection centres (Basel and Liestal) were studied as inpatients or soon after discharge in those well enough. The study was approved by the local institutional review board responsible for North-West Switzerland (EKNW, Study 2014-026). All subjects gave informed consent for retrospective use of their de-identified data as required by the local ethics committee approval.
All patients, except 2, were first examined within 5 days of onset of vestibular neuritis symptoms. Patients were re-examined at 3 weeks (average 3.4 weeks,sem 0.14) and 7 weeks (average 7.1 weeks, sem 0.3) after the initial examination, as these time-points correspond to an expected 40% and 70% improvement in vHIT VOR gain, respectively, based on an exponential model of improvement [1]. Each patient was examined at a minimum of two out of these three time points, which provided examinations from 56 patients at onset, 41 patients at 3 weeks, 44 patients at 7 weeks, and 28 patients at all 3 time points.
VOR gains were assessed using the video Head Impulse Test (vHIT). Twenty-five patients were examined using an EyeSeeCam (ESC) system (Interacoustics, Demark), and 36 were examined using an ICS system (GN Otometrics). As a precaution, patients included in the study were always examined with the same system. However, prior work has shown that there is no difference between the results of the same gain measure obtained with ICS version 1 and ESC systems [7]. Right eye (ICS) or left eye (ESC) horizontal eye movements and yaw head movements were recorded during the head impulses. Each patient was asked to fixate their gaze on a target located 1–1.5 m away while rightward and leftward head rotation impulses (amplitude range 10–25°, peak head velocity: mean 176.6°/s, maximum 337.4°/s, minimum 81.5°/s) were administered randomly by the examiner. All sampled data used in this paper was acquired for head rotations applied in the lateral plane and exported for data analysis using the manufacturer’s software. Sampling rate was 250 Hz for both systems. However, prior to export, the data was resampled at 1000 Hz by the ESC system. On average, approximately 17 vHITs (minimum 5, maximum 68) were applied per direction, examination, and subject. Approximately 2 vHITs (minimum 0, maximum 14) were rejected per direction, examination and subject in the analysis phase based on the rejection criteria described below (see also Cleworth et al. [7]).
Data analysis
Data were analyzed offline using a custom made algorithm developed using MATLAB (Mathworks Inc. Natick, MA) and described in detail elsewhere [7]. Head and eye velocity recordings were first filtered using a 3rd order, dual pass 40 Hz low-pass Butterworth filter. Individual trials were accepted if peak head velocity was greater than 80°/s. Once peak head velocity was identified, the first sample, prior to peak head velocity, with a velocity less than 20°/s was specified as the impulse onset. A mean eye and head velocity were calculated during a 40 ms interval between 20–60 ms prior to this impulse onset time (see interval 4 in Fig. 1). The mean eye and head velocities over this 40 ms period were subtracted from the rest of the trial’s eye and head velocities samples, respectively. Covert saccades, overt saccades, anti-compensatory quick eye movements (ACQEM), and artifacts (as defined below) were identified using a custom algorithm [7]. A covert saccade was identified when eye acceleration was larger than 5000°/s2, had an opposite sign to peak head velocity and occurred after peak head velocity but before head velocity zero crossing. In this case, the eye velocity response was cut off when eye acceleration first crossed zero acceleration prior to the 5000°/s2 threshold. An overt saccade was identified with the same criteria but occurred after the zero crossing of head velocity. An ACQEM or an artifact was excluded if the criteria for a covert saccade were fulfilled, and peak eye acceleration and peak head velocity were in the same direction. The cut-off used for an ACQEM or artifact was the same as described for covert saccades. If peak eye acceleration exceeded 5000°/s2 prior to peak head velocity, we assumed an artifact was present and rejected the impulse response from analysis.
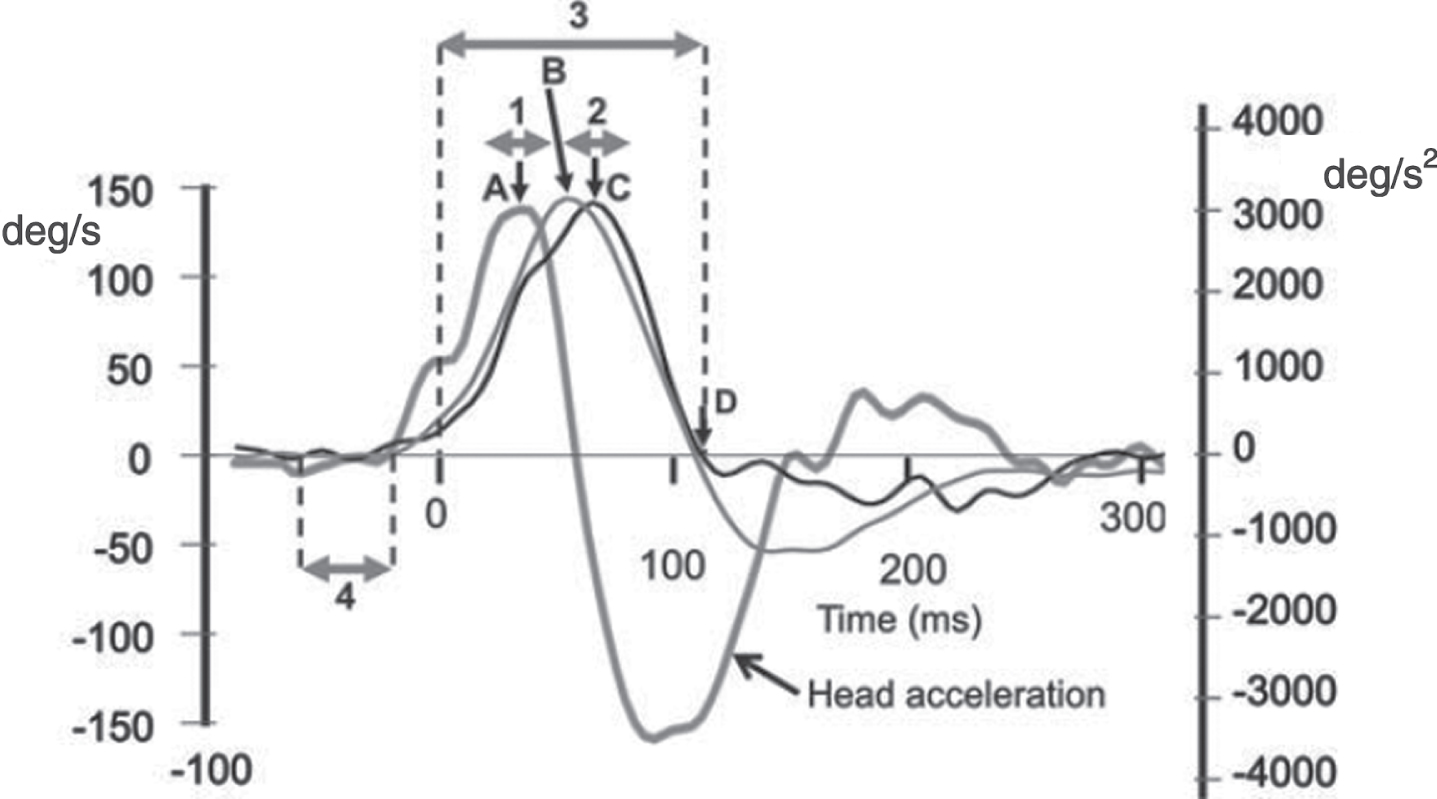
Head velocity (thin grey line), eye velocity (thin black line) and head acceleration (thick grey line) traces from a representative subject for a contra-deficit (normal) side response to a head impulse test. Eye velocity is inversely plotted, that is, in the same direction as head velocity. 0 ms indicates the onset of the trial (dashed vertical line, 20°/s head velocity). Peak head acceleration (A) had a latency of 35 ms, on average. Peak head velocity (B) had a latency of 63 ms, on average. Peak eye velocity (C) had a latency of 74 ms, on average. The end of the trial, as defined by the first zero-crossing of head velocity after peak head velocity (D), provided no covert saccades or artifacts were present and had an average latency of 137 ms, on average (see vertical dashed line in Figs. 2). A doubled headed horizontal arrow (marked 3) indicates the whole response interval used for wvG analysis. Similar arrows marked 1 and 2 indicate the eye velocity gain analysis intervals (peak±12 ms) used for the aGs and vGs, respectively (see methods). Another doubled headed horizontal arrow (marked 4) indicates the 40ms interval used, ending 20 ms before trial onset, to determine baseline head and eye velocity for each trial. Partially reproduced from [7] with permission.
Head and eye velocity traces were clipped for analysis from response onset (see Fig. 1) to the response termination defined as the first zero crossing of head velocity after peak head velocity (see interval 3 in Fig. 1). For trials in which a covert saccade, ACQEM or artefact occurred, the response termination was identified prior to head velocity zero crossing as described above. If a head velocity zero crossing was not reached within 120 ms after peak head velocity, the response termination was set at when head acceleration first crossed zero after peak head velocity.
VOR gain was calculated over 3 different time intervals as the ratio of the area of eye velocity to head velocity, after accounting for the delay of eye velocity with respect to head velocity. The 3 different intervals used are labelled 1–3 in Fig. 1: Acceleration gain (aG) was calculated over a window of±12 ms around the time of peak head acceleration (35 ms on average) when goggle slippage effects correlated with the first derivative of acceleration (jerk) are at a minimum (see Fig. 3, MacDougall et al. [18]). No shift of eye velocity with respect to head velocity was used for ESC and ICS version 1 data because the average shift between the peak head and eye acceleration signals (1 ms) for the contra-deficit side at aUPVD onset was less than the vHIT software sample interval (4 ms). This shift was set to 8 ms (2 sample intervals) for the version 3 software of ICS as the average shift between the head and eye acceleration signals was on average 7.9 ms for this software version due to different filtering of eye and head velocity being applied in comparison to version 1 software of ICS. The interval we used to calculate aG is similar to that used by Minor and coworkers [17, 23]. As described above, we used an interval 23–47 ms, on average, from stimulus onset when eye velocity was increasing from 60 to 120°/s (see interval 1 in Fig. 1). Minor and coworkers used an interval 20–40 ms from stimulus onset, also when eye velocity was also increasing from 60 to 120°/s. They also termed the gain so measured the acceleration gain [17, 23]. Velocity gain (vG) was calculated over a window of±12 ms around peak head velocity (Gv) when head acceleration is zero and acceleration effects on eye velocity gain would theoretically be zero. A shift of 8 ms (2 sample intervals) was used to calculate eye velocity area after determining that the average shift of peak eye velocity with respect to peak head velocity was 6.5 ms for the contra-deficit side at aUPVD onset. This shift was increased to 16 ms (4 sample intervals) for the version 3 software of ICS as the same shift was on average 15.5 ms for this software version. Minor and coworkers [17, 23] also measured vG as the ratio of the mean eye and head velocity over an interval when head velocity had plateaued, that is when head acceleration was zero. Their interval was longer (100–300 ms) due to differences in head velocity stimulus profiles. Whole-window velocity-gain (wvG) was calculated over the “whole” interval from stimulus onset to response termination which was clipped as described above (see arrow labelled 3 in Fig. 1). Similar shifts in eye velocity were applied for the gain calculation as described above for vG gain. The wvG method, without the shift correction, is the standard ICS gain calculation method.

Mean acceleration and velocity gains at onset of an aUPVD due to vestibular neuritis, 3 weeks and 7 weeks later. The height of the column represents the mean value, and the vertical bar on the column the sem. * marks an ipsi-deficit response with a gain value at 7 weeks which is significant less than the normal reference data of Pogson et al. [28], Ω marks an acceleration gain, aG, which is greater than the velocity gain vG, at the same examination time, and ▴ marks gain values at 3 and/or 7 weeks which are greater than gain values at aUPVD onset. The significance levels of the differences are listed in the legend to Table 1.
For each impulse trial, we calculated the area gain as follows:
where n (generally equal to 7 for aG and vG, except when the eye velocity responses were clipped, see above) is equal to the number of eye velocity (EV) and head velocity (HV) samples in the time interval used, and i is indexing from 1 to the total number of data points. We used the area gain calculation as it leads to the lowest mean variance in comparison to regression and point-to-point gain calculations [7].
Apart from the shifts of eye velocity we have applied to compare amplitudes of head and eye velocity at their peaks, the aG, vG and wvG methods described above are very similar to methods 2, 4 and 1, respectively, of Pogson et al. [28]. We used the data of Pogson et al. [28] to compare aG, vG, and wvG gains reported here with those of healthy normal subjects. The methodical differences are as follows: 1) Not taking the shifts into account will lead to slightly lower gain values for vG (our method 2) and wvG (our method 3) by 2.6% [7]. 2) The time windows for Pogson et al. [28] methods 2 and 4 are±20 ms which cause a window overlap of 15 ms as peak head acceleration occurs on average at 35 ms and peak head velocity at 60 ms (see Fig. 1). To avoid this overlap, we used time windows of±12 ms. There is no difference in onset times between method 1 of Pogson et al. [28] (60 ms prior to peak head velocity) and the onset time we used (head velocity exceeds 20°/sec) as the difference between our onset time and the time of peak head velocity is 60 ms on average [7].
Due to missing data points in the longitudinal data (43 data points were missing out of a possible 186; thus data was 77% complete for 61 subjects over 3 examinations), a linear mixed model analysis, with repeated measures, [11, 33] was used, when appropriate, to test for differences between gain type (aG and vG) and examination time (within 5 days of onset of uAPVD, 3 weeks and 7 weeks later) across ipsi- and contra-deficit responses independently. F and p-values for fixed effects are reported, [11]. Ipsi- and contra-deficit response gains were not compared as these differences have been reported elsewhere [19, 27]. Mean gains and standard error of the means are reported in Table 1. Pairwise comparisons were used, post-hoc, to further examine main and interaction effects between aG, vG, and time. In addition, differences due to age between young adults (< 35 years), middle-aged adults (35 to 60 years), and older adults (> 60 years) were also examined using a linear mixed model. Finally, data of all three gain metrics (aG, vG, wvG) for the final examination (7.1 weeks after onset) were compared to normal reference values obtained by Pogson et al. [28] (see Table 1) using one sample t-tests. Note, however, that normality assumptions were violated for 3 of the 18 total variables. Given that no transformation and outlier removal technique corrected for all violations, no normality corrections were made. The level for significance was set at alpha equal to 0.05, and Bonferroni corrections were used for multiple comparisons (post-hoc analyses). Statistical analysis was carried out using IBM SPSS Statistics, version 27.
Mean and standard error of mean (sem) for acceleration (aG) and velocity (vG and wvG) gains over time (onset of aUPVD, 3 weeks and 7 weeks later). Normal reference values are taken from Pogson et al., (2019) –values for 150°/s stimulus velocity, pooled left and right gains. N stands for the number of subjects included in the mean and sem
Mean and standard error of mean (sem) for acceleration (aG) and velocity (vG and wvG) gains over time (onset of aUPVD, 3 weeks and 7 weeks later). Normal reference values are taken from Pogson et al., (2019) –values for 150°/s stimulus velocity, pooled left and right gains. N stands for the number of subjects included in the mean and sem
A 2.6% correction was made to the normal wvG reference values to take into account the shift of eye velocity peak with respect to peak head velocity. * stands for gain significantly less than normal at 7 weeks. (Only values at 7 weeks values were compared to those of Pogson et al. 2019). Ω stands for ipsi-deficit aG significant greater than ipsi-deficit vG at examination time point (at onset p = 0.00004, at 3 weeks p = 0.013, at 7 weeks p = 0.039). ▴ stands for ipsi-deficit gain at 3 and 7 weeks significantly greater than at onset (p≤0.0002). •stands for contra-deficit wvG at 3 weeks greater than at onset (p = 0.05). ◂ stands for a trend (0.1 > p > 0.05) over time with respect to onset values. These significance values are without correction for multiple comparisons. When Bonferroni corrected, the difference between ipsi-deficit aG and vG at 7 weeks and for contra-deficit wvG between 3 weeks and onset are no longer significant (p > 0.05). Ipsi-deficit aG and vG differences with respect to time remained significant (p < 0.0001).
Ipsi-deficit differences
The caloric canal-paresis (CP) values quantified an average ipsilateral peripheral deficit of 91% (±2.4% sem) at aUPVD onset and 67% (±4.7%) 7 weeks later. There was a significant main effect of time (F(2,129.2) = 25.1, p < 0.001) on the VOR gain values calculated for the ipsi-deficit side. Compared to 5 days post onset (mean = 0.37±0.02), there was a significantly larger gain at 3 weeks (mean = 0.59±0.03; p < 0.001) and 7 weeks (mean = 0.60±0.04; p < 0.001), independent of gain type. There was no statistical difference between gains at 3 and 7 weeks (p = 0.480). There was also a significant main effect of gain type (aG, vG) on the ipsi-deficit side (F(1,156.2) = 72.0, p < 0.001), with significantly larger gains observed for aG (mean = 0.59±0.03) compared to vG (mean = 0.43±0.02). There were no significant interaction effects for examination time and gain type for the ipsi-deficit data. There were also no age-related main or interaction effects for the ipsi-deficit gain data.
The aG and vG values for the deficit side at each examination time are listed in Table 1. The post-hoc significance values indicating that the significance of the difference between aG and vG values decreased over time are listed in the legend to Table 1. These gain values confirm qualitative characteristics of vHIT responses observed in Fig. 2. For example, a characteristic of the eye velocity deficit-side responses at onset of the aUPVD and 3 and 7 weeks later is that these are “clipped” prior to the occurrence of peak head velocity. A more detailed examination of the traces in Fig. 2 reveals that the reduction of the initial slope of eye velocity traces in vHIT recordings is less than the reduction of peak eye velocity at peak head velocity. That is, across time, gains at peak acceleration (aG) always appeared greater for ipsi-deficit responses than velocity gains (vG) at peak head velocity when head acceleration is approximately zero. (Fig. 3 and Table 1).
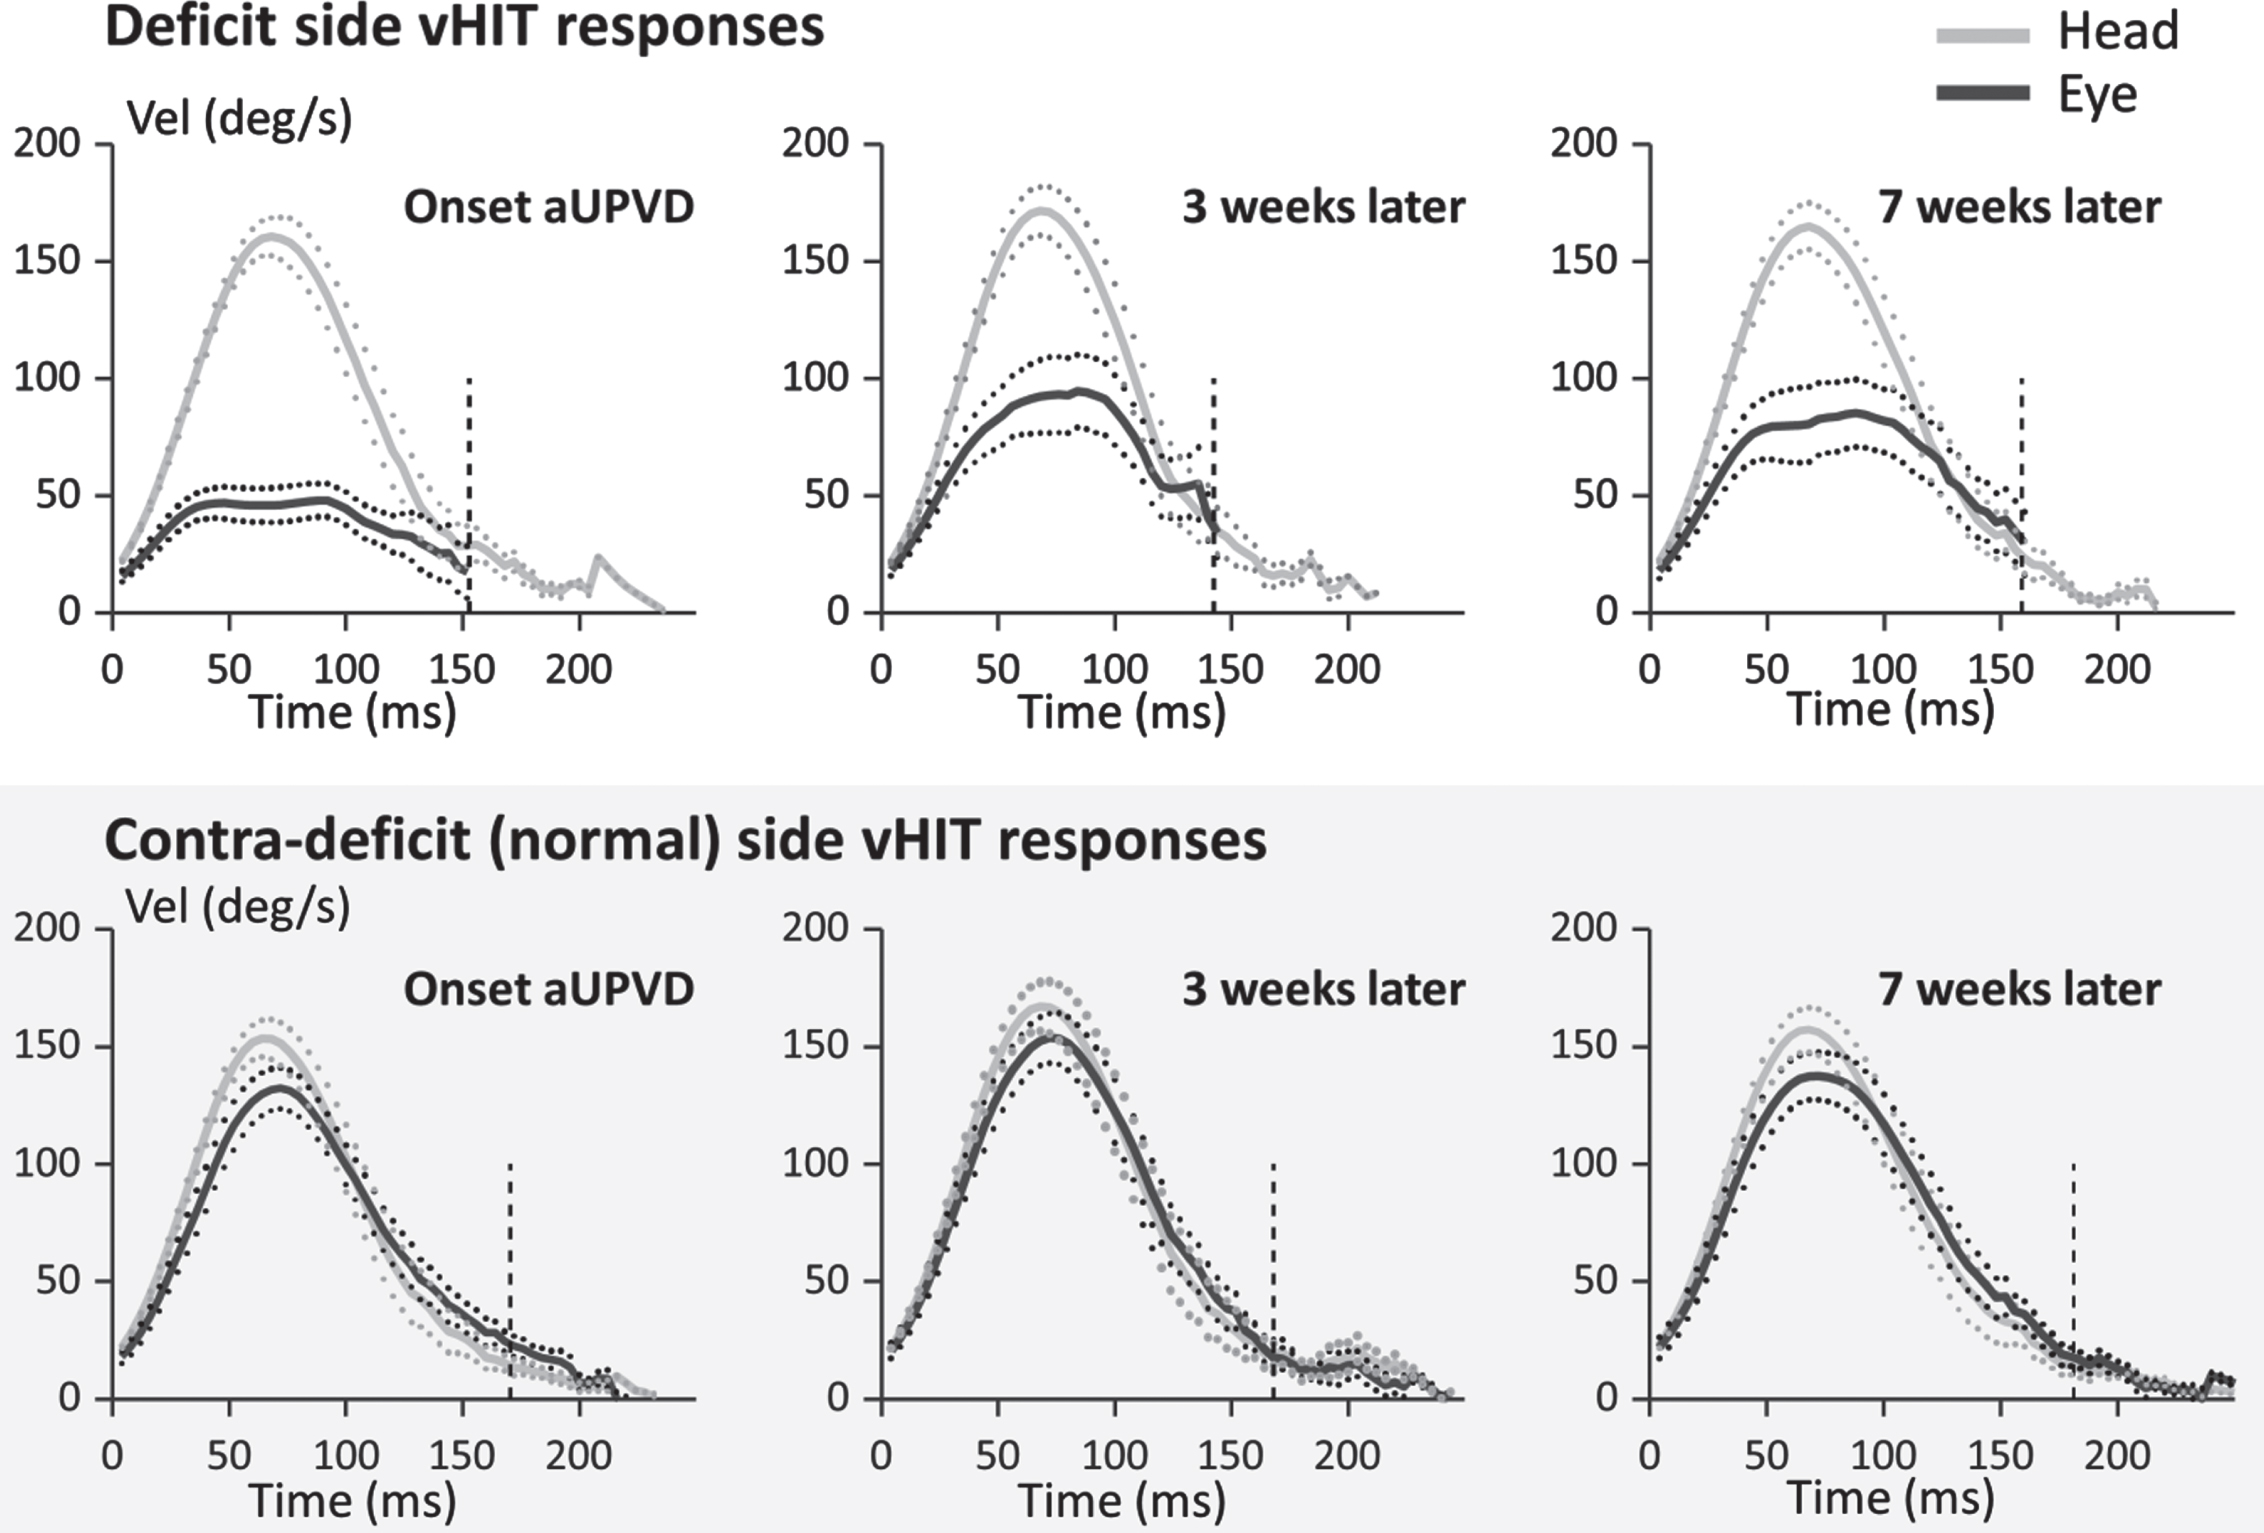
Mean population traces for vHIT horizontal responses to the ipsi-deficit (lower traces) and contra-deficit (upper traces) directions at 3 different times following onset of an acute unilateral peripheral vestibular deficit (aUPVD). The traces have been aligned, prior to averaging, at the time when head velocity first exceeds 20°/s prior to peak head velocity. The full lines represent the mean response and the dotted lines the mean±the standard error of the mean (sem). The vertical dashed lines mark the average end of the whole window analysis (interval 3 in Fig. 1). The eye traces on the deficit side have been terminated at this time point. Note for comparison with the data of Pogson et al. [28], the average maximum head velocity is approximately 150°/s.
There was a significant main effect of time (F(2,118.5) = 5.75, p = 0.004) on the VOR gain values calculated for the contra-deficit side. Compared to 5 days post-onset (mean = 0.846±0.020), there was a significantly larger gain at 3 weeks (mean = 0.920±0.025; p = 0.045) and 7 weeks (mean = 0.907±0.024; p = 0.008). There was no statistical difference between contra-deficit gains of 3 and 7 weeks (p > 0.9). There was a trend towards differences between gain types on the contra-deficit side data (F(1,93.164) = 2.961, p = 0.089), with aG (mean = 0.908±0.023) larger than vG (mean = 0.865±0.014). The aG and vG values for the contra-deficit side at each examination time are listed in Table 1 together with post-hoc significance values. There were no significant interaction effects for time and gain on the contra-deficit data (p = 0.670). There were also no age-related main or interaction effects for the contra-deficit gain data.
Comparison to Pogson et al. (effectiveness of central compensation by 7 weeks)
There was a significant difference between the normal gain [28] (see Table 1) and the gain at 7 weeks on the ipsi-deficit side calculated using the aG (t(43) = 4.942, p < 0.001); vG (t(43) = 6.013, p < 0.001) and wvG (t(43) = 7.270, p < 0.001) methods. There were no significant differences between the normal gain values and gains on the contra-deficit side at 7 weeks using the aG (t(43) = 0.711, p = 0.731) or wvG (t(43) = 1.247, p = 0.390) methods, with trend observed for the vG method (t(43) = 2.109, p = 0.080). Two outliers were identified for vwGs of examination 3 (7 weeks). When these were removed, there was a significant difference in wvG contra-deficit gains compared to normal gain values (t(41) = 3.205, p = 0.006), but the removal of the corresponding vG data caused the trend for vG to be no longer evident. No other changes in the comparison to Pogson et al. [28] data were observed with the removal of the 2 outliers.
Discussion
The major finding of this study was to show that, ipsi-deficit, VOR gains measured at peak acceleration (aG) were always greater than VOR gains measured at peak velocity (vG) during the weeks following onset of acute unilateral vestibular neuritis. Several authors [17, 23] have also termed the acceleration gain (aG) the phasic velocity VOR gain. Likewise the velocity gain (vG) has been termed as the tonic velocity gain. Our major finding lends support to the findings of Lasker et al. [17] who argued that phasic-velocity (or acceleration dependent) response components of the VOR had a major role in the compensation for a unilateral labyrinthectomy because aGs had improved more rapidly than vGs after lesion onset. In our study there was no difference in the aG and vG improvement after deficit onset, however aG values were always larger than Gv values, presumably permitting greater participation in the recovery processes. However, further modelling studies are required to support this conclusion.
Differences in aG and vG values can be expected based on the obvious clipping of eye velocity which occurs prior to peak head velocity in vHIT responses (see Fig. 2). The most parsimonious explanation for this effect is that it is due to the limits of disinhibition of the contra-deficit input to the ipsi-deficit vestibular nuclei and the reduction in amplitude of the ipsi-deficit afferent response. As the response is clipped around peak head velocity, where there is no contribution from phasic, acceleration dependent responses, this suggests that the clipping effect is velocity dependent. In contrast, at peak acceleration both phasic and tonic inputs could contribute to the computed aG gain as head velocity is not zero at peak head acceleration (see Figs. 1 2).
The major changes to ipsi-deficit aG and vG gains occurred between onset and 3 weeks after onset of vestibular neuritis causing an aUPVD. This time course is similar to that observed using ‘whole window’ velocity gains (wvG) to measure VOR improvement, as documented in Table 1 and elsewhere [12]. VOR deficit side vHIT gain improvement has an exponential time-course with a time constant of 5.9 weeks, leading to a gain value within 10% of steady state at 13 weeks [1]. The VOR improvement reported here is not directly comparable to improvement following vestibular neurectomy. Improvements in cases of neurectomies can only be due to central compensation as the peripheral nerve is dissected. VOG improvement, in cases of vestibular neuritis, has two components: central compensation and peripheral recovery. The peripheral loss in this study was on average 91% at onset of the aUPVD as measured by a caloric examination. The improvement was 24% to a 67% remaining peripheral loss, on average at 7 weeks, for our current data. By comparing the improvement in patients who recover some peripheral function with those who do not and have an initial loss of 90% at onset, we have estimated that central compensation could provide approximately 40% of the improvement in patients with partial peripheral recovery [4]. Given that this could provide more total gain improvement than needed, this might explain the relative overshoot of contra-deficit gain values we observed at 3 weeks in comparison to those at 7 weeks (Table 1 and Fig. 3). Based on the contra-deficit recovery processes described by Palla and Straumann [27], this change could occur because the CNS first attempts to boost the contra-deficit VOR gain close to 1, and subsequently reduces the response asymmetry with respect to ipsi-deficit gain. Our hypothesis concerning the role of central compensation on the ipsi-deficit side, however, differs from that of Palla and Straumann [27] who argued that ipsi-lesional VOR gain recovery is a result of spared peripheral vestibular function on the deficit side. As described above, we observed considerable ipsi-deficit gain recovery due to central compensation when only 10% or less of peripheral function (as determined by CP values of caloric tests) was available [4]. To explain which of these different compensatory mechanisms underlies ipsi-deficit vHIT gain recovery of patients with vestibular neuritis, responses of patients with 90% or greater CP due to vestibular neuritis need to be compared with those of patients with a vestibular neurectomy.
To our knowledge, there have been no previous reports comparing phasic (acceleration dependent) and tonic velocity gains (aG and vG) for cases of vestibular neuritis. Reports do exist for changes in the whole window velocity gain (wvG) over time following onset of vestibular neuritis. Therefore, a comparison with previous research can only be made for wvGs (see Table 1). Our results are comparable with previous reports of wvG gains bearing in mind that the canal paresis values at onset, indicating the degree of peripheral loss, and time interval between tests after deficit onset may differ. For example, Martin-Sanz et al. [21] observed ipsi-deficit wvG values of 0.63 at onset and 0.74 at 1 month, which are only comparable to our value at 7 weeks (Table 1). However, the gain values at onset are not comparable to ours despite being recorded within 24 hours of hospital admission. This difference may be due to the difference in mean CP values (47% for Martin-Sanz et al., [21] versus 91% at onset in the current study). There is a negative correlation between CP values at onset and wvG vHIT gains [4]. Thus higher CP values on average will be associated with lower wvG gains as in the current study. Similar wvG results to ours have been previously reported by Fu et al. [12]. Gain values of 0.47 at 10 days and 0.69 at 6 months after onset of vestibular neuritis are very similar to the values reported here (see Table 1; 0.42 within 5 days of onset, and 0.66 at 3 and 7 weeks later). Thus, based on these similarities and exceptions, we assume that similar results for aG and vG values would have been obtained by the authors of the previously mentioned studies.
We noted no differences between the recovery times for ipsi- and contra-deficit aG and vG values. aG and vG on both sides showed most improvement over the first 3 weeks with less improvement in values at 3 compared to 7 weeks (Table 1). There are minor differences in contra-deficit gain recovery compared to the major differences in ipsi-deficit gain recovery. Previously we observed a similar result for contra-deficit gains using less subjects (37) for whole window gains at 3–4 weeks [1]. We expected to observe more significant differences for contra-deficit gains with a larger group of subjects (61). This was not the case.
There are a number of limitations to this study. First, we have measured the phasic velocity, or as termed here, acceleration gain, aG, using vHIT techniques. For tests in the horizontal canal plane, these techniques are particularly susceptible to goggle slippage during the ascending head velocity phase [18]. The data of MacDougall et al. [18] shows, however, that the biphasic pulse associated with such slippage has peaks at the onset and end of the monophasic acceleration phase. That is, these slippage peaks have a profile more like the time derivative of head angular acceleration (jerk), and not like the ascending monophasic head acceleration profile itself. The peak head acceleration occurred, on average, in our data at 35 ms with respect to zero latency at 20 deg/s head velocity (see Fig. 1). This time point is approximately at the zero crossing of the biphasic “bump” or jerk artifact as would be expected if it is dependent on the time derivative of head acceleration (see Fig. 3, MacDougall et al. [18]). Thus, this comparison indicates that when computing gain across our acceleration gain time-window of peak head acceleration±12 ms, the effect of the goggle slippage or “bump” artifact would have averaged out. Furthermore, in our average traces of Fig. 2, it can be noted that a marked presence of such an artifact is not apparent in our data. Secondly, based on our previous results [1], we have assumed that peripheral functional loss measured with the caloric test is correlated with that measured with head impulses. It might be argued that irregular phasic responding vestibular afferents contribute less than regular afferents to the eye movement response during caloric stimulation, and that the contribution of irregular afferents becomes more observable under head impulses. If so, after vestibular neuritis, a caloric test might underestimate the contribution of spared irregular afferents to VOR gains. Countering this reasoning, our previous investigations [1] determined that low frequency rotating chair deficit response amplitudes and high frequency head impulse response amplitudes were equally well correlated with CP values. However, the time course of head impulse response recovery was more similar to that of CP values [1]. These results suggest spared irregular fibres should be equally apparent as spared regular fibres in caloric responses.
We also found no differences in aG and vG values with respect to subject age. In a previous study with 30 subjects, we determined that wvG gains at vestibular neuritis onset tended to be less in the elderly (60–74 years of age) compared to the young (23–35 years). Our current study with 61 patients could not confirm this finding. Coupled with the finding that gain improvements are similar across canal planes [3], these findings on the effect of age and gain side suggest that vestibular rehabilitation should concentrate on improving the effects of head movement velocity and acceleration on eye movements and balance control similarly across all age groups.
We have assumed that changes in acceleration and velocity VOR gains over time in the yaw planes are attributable to 2 processes: partial recovery of lateral canal peripheral function, and central compensation in yaw directed VOR brainstem pathways. This assumption may require modification for two reasons. Firstly, the semi-circular canals are not orthogonal to one another [5, 9]. When the head is upright as in vHIT tests, this anatomical non-orthogonality leads to lateral canals being stimulated by 0.91 of the total head yaw acceleration, and the posterior canals by 0.32 of yaw head acceleration and anterior canals a negligible amount [9]. Crucially, posterior canal function is affected significantly less by vestibular neuritis [10, 13] with the wvG for the posterior canal being slightly reduced to 0.69 on average for ipsi-deficit impulses compared to 0.4 for the lateral canal [2]. The normal lower limit of wvG for the posterior canal is 0.6, mean 0.78 [28]. Thus, theoretically, a third method of central compensation would be to use the largely unaffected posterior canal sensitivity to yaw rotations to drive horizontal VOR neural circuits. However, in 40% of the cases the posterior canal response is affected by vestibular neuritis with an average gain of 0.43 not different from that of the deficit lateral canal [3], leading to variable amounts of central compensation if the posterior canal response would be involved in the central compensation of the lateral canal deficit.
Conclusion
The key findings of this study were that following vestibular neuritis, acceleration dependent (often called phasic-velocity) VOR gains (aG) are less affected than tonic-velocity dependent VOR gains (vG) and aG remained larger than vG during the first 7 weeks of peripheral recovery and central compensation. These findings might be considered predictable on the basis of changes in the proportion of contra-lesion irregular (phasic) afferents [30], and aG and vG changes following labyrinthectomy in animals [16, 17].
Footnotes
Acknowledgments
This study was supported by a grant from the Freiwillige Akademische Gesellschaft Basel to JHJ Allum. We thank Ms. Barbara Wenger for editorial assistance.