
Abstract
INTRODUCTION:
No reliable biometric measurement of vestibular involvement with migraine is currently available.
OBJECTIVE:
Measures of autonomic nervous system and postural responses could serve as quantifiable indicators of vestibular involvement with migraine.
METHODS:
A convenience sample of 22 young healthy adults (34±9 years old) and 23 young adults (34±8 years old) diagnosed with vestibular migraine (VM) participated. A rod and frame test and clinical outcome measures of dizziness and mobility were administered. Participants stood on foam while viewing two dynamic virtual environments. Trunk acceleration in three planes and electrodermal activity (EDA) were assessed with wearable sensors. Linear mixed models were used to examine magnitude and smoothness of trunk acceleration and tonic and phasic EDA. A Welch’s t-test and associations between measures were assessed with a Pearson Correlation Coefficient. Effect sizes of group mean differences were calculated using Cohen’s d.
RESULTS:
Visual dependence was present in 83% of the VM population. Individuals with VM exhibited lower baseline EDA (t(4.17) = –7.2, p = 0.001) and greater normalized trunk accelerations in the vertical (t(42.5) = 2.861, p = 0.006) and medial (t(46.6) = 2.65, p = 0.01) planes than healthy participants. Tonic EDA activity increased significantly across the period of the trial (F (1,417) = 23.31, p = 0.001) in the VM group. Significant associations appeared between vertical trunk acceleration and EDA, Dizziness Handicap Inventory, and Activities of Balance Confidence tools.
CONCLUSIONS:
Higher tonic EDA activity in healthy adults results in more accurate postural reactions. Results support the supposition that EDA activity and postural acceleration are significantly different between VM and healthy individuals when accommodating for postural instability and visual-vestibular conflict.
Introduction
Migraine headache is the third most common diagnosis in the world [14, 24] and more than 37 million Americans suffer from migraine [22]. A subgroup of patients with migraine has been identified as migraine with vestibular involvement and called vestibular migraine (VM) or migrainous vertigo [33, 65]. VM includes chronic migraine associated with vertigo, gaze instability, nausea, and sensitivity to sound, light, and visual tracking motion [10, 45]. Twenty to 61% of migraineurs experience disequilibrium, [16, 46] and several studies have reported impaired postural responses in individuals with VM [6, 34]. VM has a significant impact on daily functional activities; 60% of these individuals report that VM prevents them from going to work or school [56].
Recently, the International Headache Society Classification Committee and the Barany society set diagnostic criteria for VM that includes recurrent spontaneous or positional vertigo or dizziness caused by migraine and associated with migrainous symptoms that last from minutes to days [12]. Despite the existence of these diagnostic criteria, it is still challenging to diagnose patients with VM because physical examination and laboratory testing are often normal between attacks [9, 47]. Diagnosing and treating VM, relies mostly on the reported history of symptoms (e.g., dizziness and postural unsteadiness), [4, 33] however, vestibular symptoms of VM manifest in different presentations. These may include spontaneous vertigo, triggered vertigo, positional vertigo, visually induced vertigo, head-motion vertigo, and head-motion induced dizziness with nausea [16, 45].
The pathophysiology of VM is poorly understood, but data suggest that migraine may be explained by the interactions between migraine symptoms and the systems that regulate those symptoms. For example, emetic responses, nausea, and motion intolerance are indicative of a connection between migraine, VM, and the autonomic nervous system (ANS). Measures of resting systolic and diastolic blood pressure, the Valsalva maneuver, and heart rate variability have indicated that those with more severe migraine also demonstrated more signs of ANS hypofunction [51]. ANS function was examined in both migrainous and healthy adults by measuring the pupillary light reflex amplitude, pupil size, latency, speed of constriction, and speed of dilation [41]. A lower dilation velocity in those adults with migraine implied the presence of ANS hypofunction [42].
The same symptoms and signs of ANS dysfunction (e.g., nausea and episodic vomiting) also appear with migraine headache [8, 64] which suggests that migraine and ANS dysfunction share the same neural substrate [51]. There is evidence that electrolytic or chemical lesions in the caudal region of the medial vestibular nucleus (MVc) can reduce vestibular-elicited activity in the sympathetic nerve [64]. Bilateral transection of the vestibular nerve compromised the ability of the anesthetized and paralyzed cat to compensate for orthostatic hypotension during 30°–60° nose-up tilt [21]. Direct connections have been found between middle superior temporal (MST), parieto-insular vestibular cortex (PIVC) and parieto-temporal junction (PTJ) in the cortex and the MVc nucleus [60]. Thus, the MVc nucleus has the potential to act as the anatomical connection between sympathetic activity and temporoparietal lobes.
There is evidence for an interrelationship between postural stability and ANS function, [51, 57] however, the number of studies that have examined this association is limited [44, 54]. Although the ANS and the vestibular system are physiologically related (e.g., nausea, pallor, and sweating with vertigo reveal afferent vestibular influences on the sympathetic nervous system), to our knowledge, ANS responses have not been assessed in individuals with VM [29, 59]. Studies that assessed postural responses in VM patients have not concurrently investigated ANS responses [6, 34].
We hypothesized that changes in the integrity of postural and ANS responses could serve as quantifiable indicators for diagnosis of VM. Thus, the aim of this study was to record the ANS and postural responses in healthy individuals and adults diagnosed with VM within dynamic environments in order to determine if the two groups could be differentiated by these values. We employed an immersive virtual reality environment which has been used previously to elicit both postural and sympathetic nervous system disturbances [31, 37]. We expected to find that individuals with VM would exhibit hyperfunction of sympathetic nervous system responses and increased postural sway responses compared to healthy participants.
Methods
Subjects
This study was approved by the Institutional Review Board of the Ministry of Health of the Kingdom of Saudi Arabia (protocol # H-05-FT-083). A convenience sample of 45 participants included 22 young healthy adults (34±9 years old) and 23 young adults with VM (34±8 years old). Participants were selected from individuals with a previous diagnosis of VM who presented to the outpatient Otoneurology and Emergency Departments at Hafer Al-Batin Central hospital between the period of December 2020 and February 2021. Those willing to participate provided informed consent. In a separate visit, vestibulonystagmography (bi-thermal caloric, positional nystagmus, smooth pursuit, random saccade, gaze stability, optokinetic nystagmus, and oculomotor testing) was performed on individuals with migraine. Values of the abnormal caloric testing result were established by the clinical laboratory as a directional preponderance of 25% or greater.
Procedures
Participants stood on the center of a standard AIREX 20“×16.4”×2” balance pad (Advanced Medical Technology Inc., Watertown, MA) with their arms at their sides and their feet about shoulder-width apart (Fig. 1). Throughout the experiment, the participants were asked to maintain an upright standing position with their eyes open while wearing a head mounted display (HMD) and watching a virtual visual scene for 3 min. Each exposure to the dynamic visual environment was followed by a rest period of at least one min until any emerging symptoms of dizziness, nausea, or any discomfort were resolved.
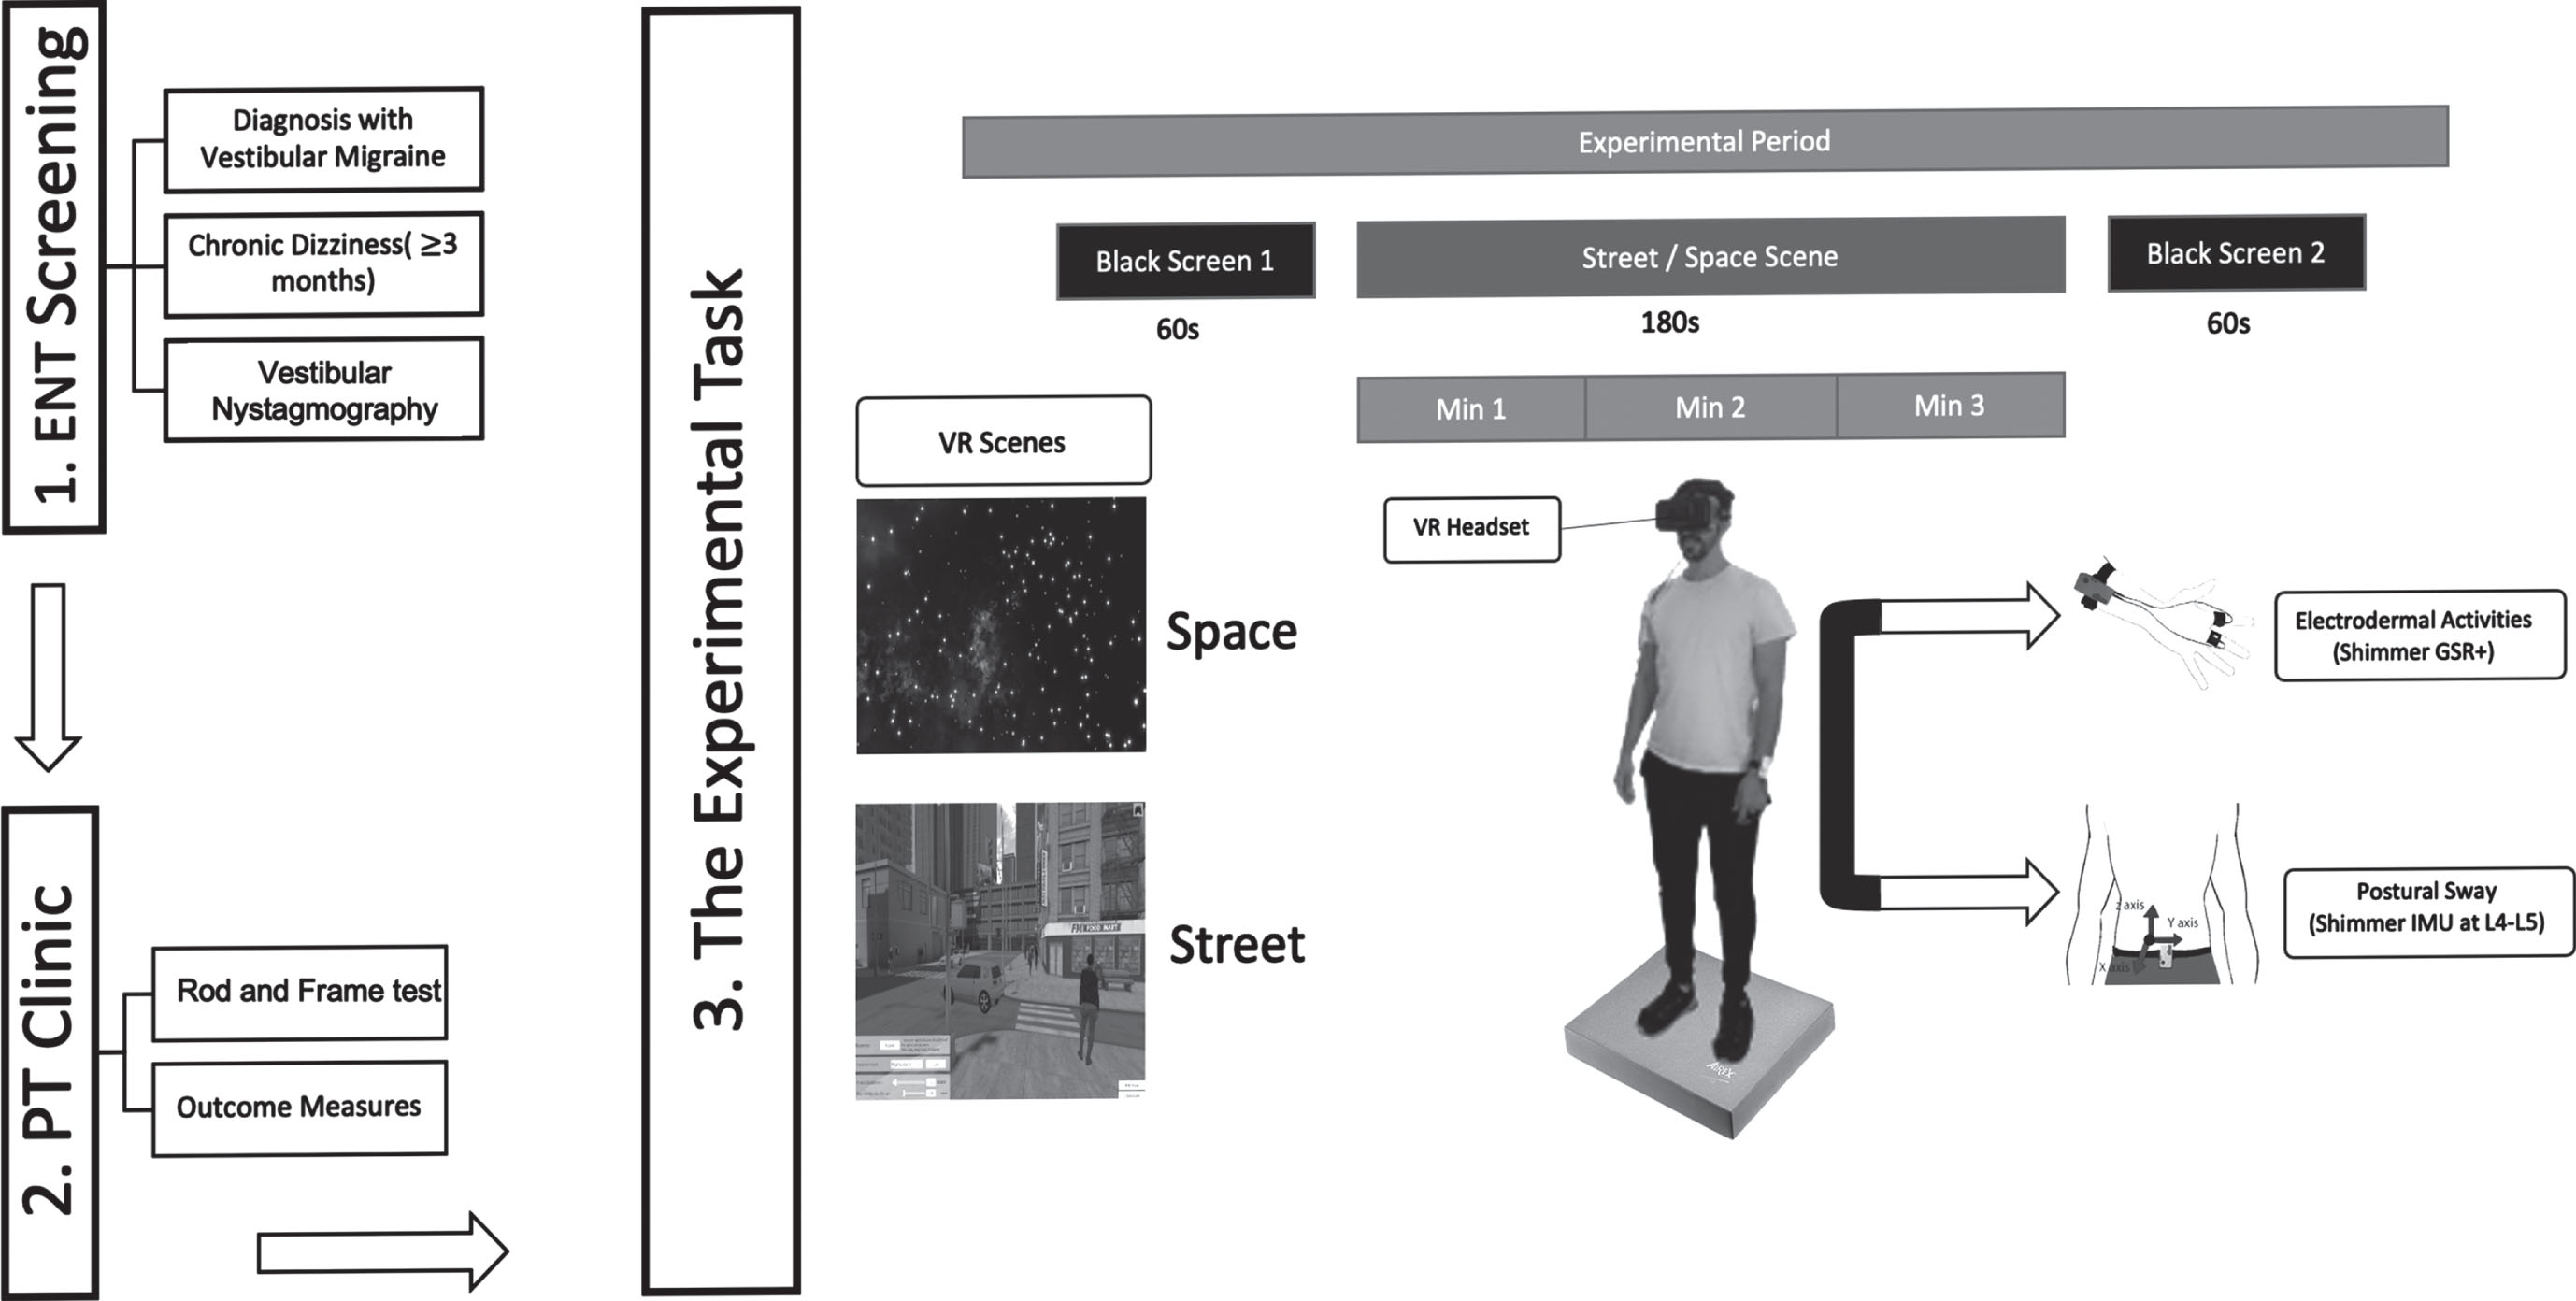
Diagram of experimental procedures.
Participants were exposed to a three-dimensional complex visual environment generated by the software PosturoVR 0.8.3 (Virtualis, France) projected on the HMD. The Oculus Rift HMD (Oculus Rift, CA) weighs 379-grams which is light compared to the mass of the head (approximately 4.0 kg). The field of view (FOV) of this device is more than 90 deg horizontal (110 deg on the diagonal). Vision of the real world is completely blocked providing a strong sense of immersion.
Two virtual environments (a space scene [SPACE] and a pedestrian crossing scene [STREET]) were randomly presented in one visit (Fig. 1). Each trial was 5 minutes long including 1-minute in the dark, 3 minutes in the visual environment, and 1-minute in the dark. The SPACE scene was a projection of stars at different sizes and distances from the participant moving in the yaw axis with no cues to vertical orientation which has been demonstrated to induce strong sensations of self-motion during quiet stance [28, 48]. Visual scene motion was in the direction of the dominant hand. The STREET scene was constructed of three-dimensional fixed objects (i.e., buildings, sidewalks, traffic signals) and virtual objects (i.e., cars, pedestrians) moving in all directions at various distances from the participant.
Electrodermal Activity (EDA)
EDA is a measure of skin conductance (SC) over time. EDA consists of a (1) tonic component, also known as skin conductance level (SCL), which changes slowly over time (baseline) and indicates the active state of the sympathetic nervous system, and (2) phasic component known as the skin conductance response (SCR) which changes rapidly in response to external new, unexpected, and/or arousal-driven stimuli (Fig. 2). Sudden shifts of phasic activity above the tonic activity indicate the SCR peaks.
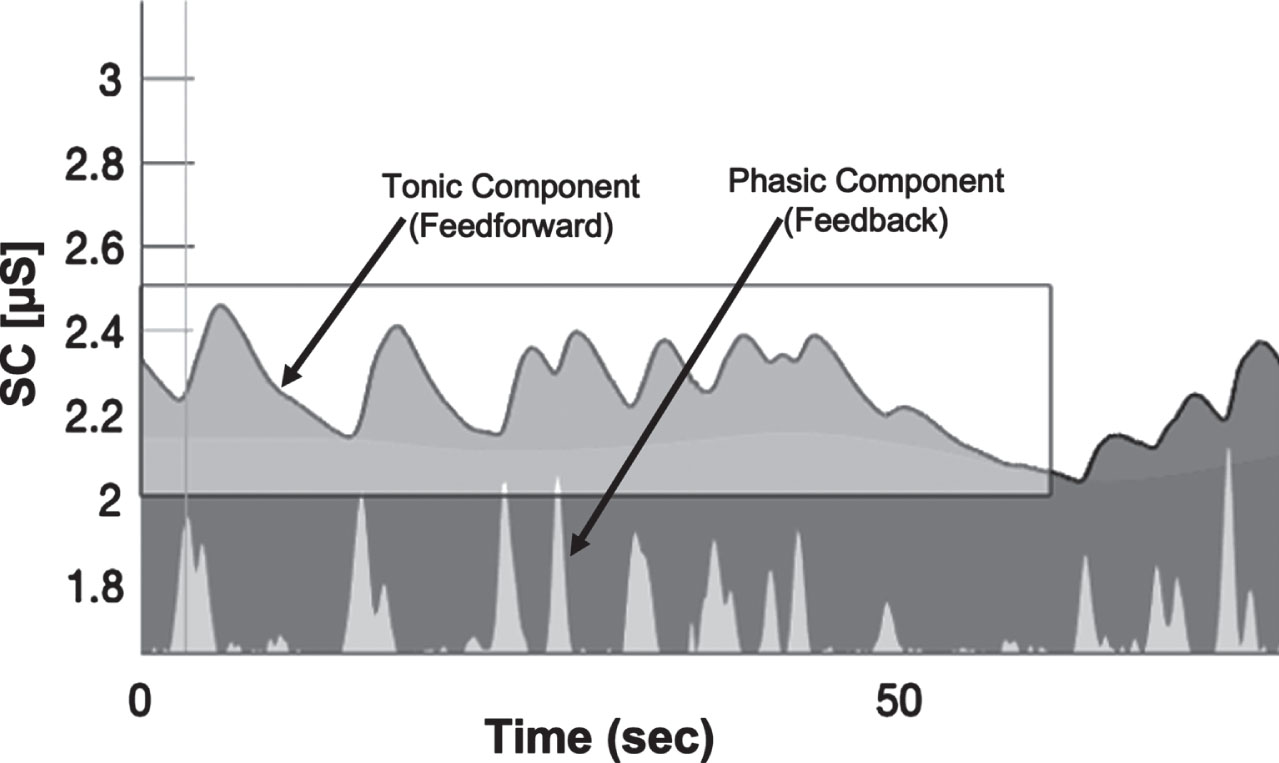
EDA data decomposition into tonic and phasic components.
Changes in electrodermal activity were recorded using the wireless Shimmer3 GSR+ sensor unit (Shimmer-North America, Cambridge MA) that measures changes in skin conductivity produced by increases in the activity of sweat glands at a sampling rate of 128 Hz. The sensor was placed over the palmar surface of the medial metacarpal-phalanges of the third and fourth fingers of the non-dominant hand. Participants were instructed to close their eyes and relax until the investigator observed that activity detected and displayed by the Shimmer sensor unit remained close to a baseline.
Trunk triaxial linear acceleration data were tracked with a Shimmer3 IMU wearable sensor with a sampling rate of 128 Hz placed over the L5 vertebral region.
Self-reported Outcomes Measures
The presence of visual-vestibular mismatch (VVM), dizziness, balance confidence, and the level of physical activity of each individual were evaluated at the beginning of the experiment using the following validated clinical tools: VVM Questionnaire, [35] Visual Vertigo Analog Scale (VVAS), [20] Dizziness Handicap Inventory (DHI), [30] Vertigo Symptoms Scale-Short Form (VSS-SF), [63] Activities of Balance Confidence (ABC) questionnaire, [40] and Rapid Assessment of Physical Activity [58].
Our previous study revealed that greater than 50% of individuals with VM test positive for visual dependency [5]. To track the effect of visual dependency on these responses, each individual with VM was tested on a Rod and Frame task (RFT) available on the PosturoVR 0.8.3 software (Virtualis, France) and projected on to the Oculus Rift. At the beginning of each trial, the virtual rod was set randomly at a 45-degree angle to the left or right. The rod was then slowly moved toward vertical by the investigator and the participant raised their hand to signal when they perceived that the rod had achieved a vertical position. The same procedure was repeated four times and the measure of angular deviation from vertical averaged for later analysis.
Data analyses
EDA measures
Raw EDA data was processed with MATLAB R2020b (The MathWorks, Inc., Natick, Massachusetts, USA) using the Ledalab-toolbox V3.4.9 (www.ledalab.de) using continuous decomposition analysis (CDA) to decompose the SC data into phasic and tonic components [11]. The CDA method can be applied to full-length data which provides a complete decomposition model of the original SC data. All mathematical models of CDA are based on a physiological rationale to avoid underestimation biases due to overlapping responses. However, the integrated skin conductance response (ISCR), which is defined as the area (time integral) of the phasic component within the response window reflects the phasic EDA response to a given event or stimulus. It equals SCR multiplied by the size of the response window [Microsiemens (μS) * seconds (s)]. The detection threshold for significant peaks was set to 0.01 μS as recommended by the Society for Psychophysiological Research [13]. To prevent the common skewed distribution of electrodermal response measures, the standardized ISCR was computed as [11]:
Postural acceleration measures
Trunk linear acceleration data was processed using MATLAB R2020b (The MathWorks, Inc., Natick, Massachusetts, USA) which provides a formula for calculating the Root Mean Square (RMS) and the Normalized Path Length (NPL). RMS and NPL were calculated for the antero-posterior (AP), medio-lateral (ML), and vertical (Vert) planes where a higher value indicates greater postural instability [1, 50]. RMS represents the mean power of the entire trial time and NPL is the sum of the absolute values of acceleration over time divided by the length of time that it takes to travel that distance, thus describing smoothness of the trunk motion. RMS and NPL were computed using the following formulae [3]:
Statistical analyses
EDA and six postural acceleration measures (RMS and NPL each in ML, AP, and Vert axes) were analyzed using R version 4.0.4 (R Foundation for Statistical Computing, Vienna, Austria). Correlations for continuous variables were computed with Pearson correlation coefficients and a two-tailed test. A Shapiro-Wilk test revealed the data were normally distributed.
Linear mixed-effects (LME) models were constructed to statistically assess the effects of the (SPACE and STREET) virtual visual scenes across groups (VM and healthy) and time. Response variables included ISCR, NPL, and RMS with the subject as a random effect and a slope fit for each trial. Linear mixed models were fit using restricted maximum likelihood (REML) [7]. Specific differences between the virtual environments and groups was examined with a Wilcoxon signed rank test. Cohen’s d (range 0–1.4) was used to calculate effect sizes of differences between group means. Relative effect sizes were categorized as small (d = 0.2), medium (0.5), and large (0.8) [15].
Data from self-reported outcome measures were analyzed using IBM SPSS Statistics v.23 (IBM Corporation, Armonk, N.Y., USA) and reported as mean±standard deviation or as a percentage of participants. The significance level was set at α = 0.05 for all analyses. Bonferroni post-hoc adjustments were used to adjust for multiple comparisons. Differences in demographics and clinical outcome scores between VM and healthy groups were assessed using Welch’s t-test. Individuals were assigned positive or negative results on the RFT based on the criterion of an angle of deviation greater than 5 deg to indicate visual dependency [5]. Demographic differences in gender distribution were assessed using the Chi-square test.
Results
Self-reported outcome measures
Demographics, self-reported outcomes, and clinical characteristics of the study sample are summarized in Table 1. The VM group had significantly lower (poorer) scores on the ABC than healthy adults (t = 13.30, p = <0.001). The healthy adults had significantly lower (better) scores than the VM group on the DHI, the VVAS, and the VSS-SF (t(218) DHI = 23.34, t(261) VSSAS = 24.22, t(353) BMI = 7.31, pall = <0.001).
Demographic and clinical characteristics of participants (n = 45)
Demographic and clinical characteristics of participants (n = 45)
The angle of deviation in the RFT was significantly higher in all VM adults (t(42.6) = 3.33, p = <0.01) than in healthy adults thereby indicating the presence of visual dependence in 83% of the population with VM. The VSS-SF revealed that those with visual dependency experienced vertigo generated almost equally due to vestibular and autonomic symptoms whereas those without visual dependence were principally affected by autonomic symptoms (Fig. 3). Because results skewed predominantly toward visual dependence, we chose to treat the VM population as a single group for further analyses.
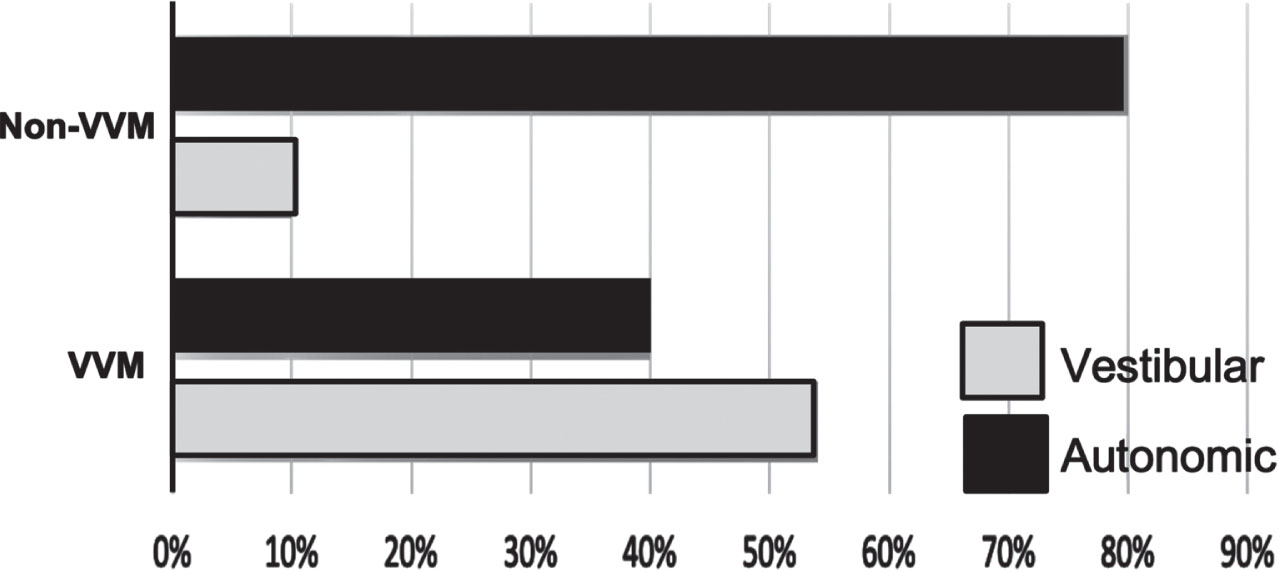
Results of the visually dependent (VVM) and non-visually dependent subjects (Non-VVM) on the Vertigo Symptoms Scale-Short Form.
The six postural acceleration measures (i.e., RMS and NPL each in ML, AP, and Vert axes) exhibited large variability between group mean±SD values across the three minutes of exposure to the VR environment (Fig. 4). No significant differences emerged in RMS measures except for a medium effect size between group means of the RMS-AP with the SPACE environment (t(40) = 2.01, p = 0.05, d = 0.59) so we did not further consider this measure.
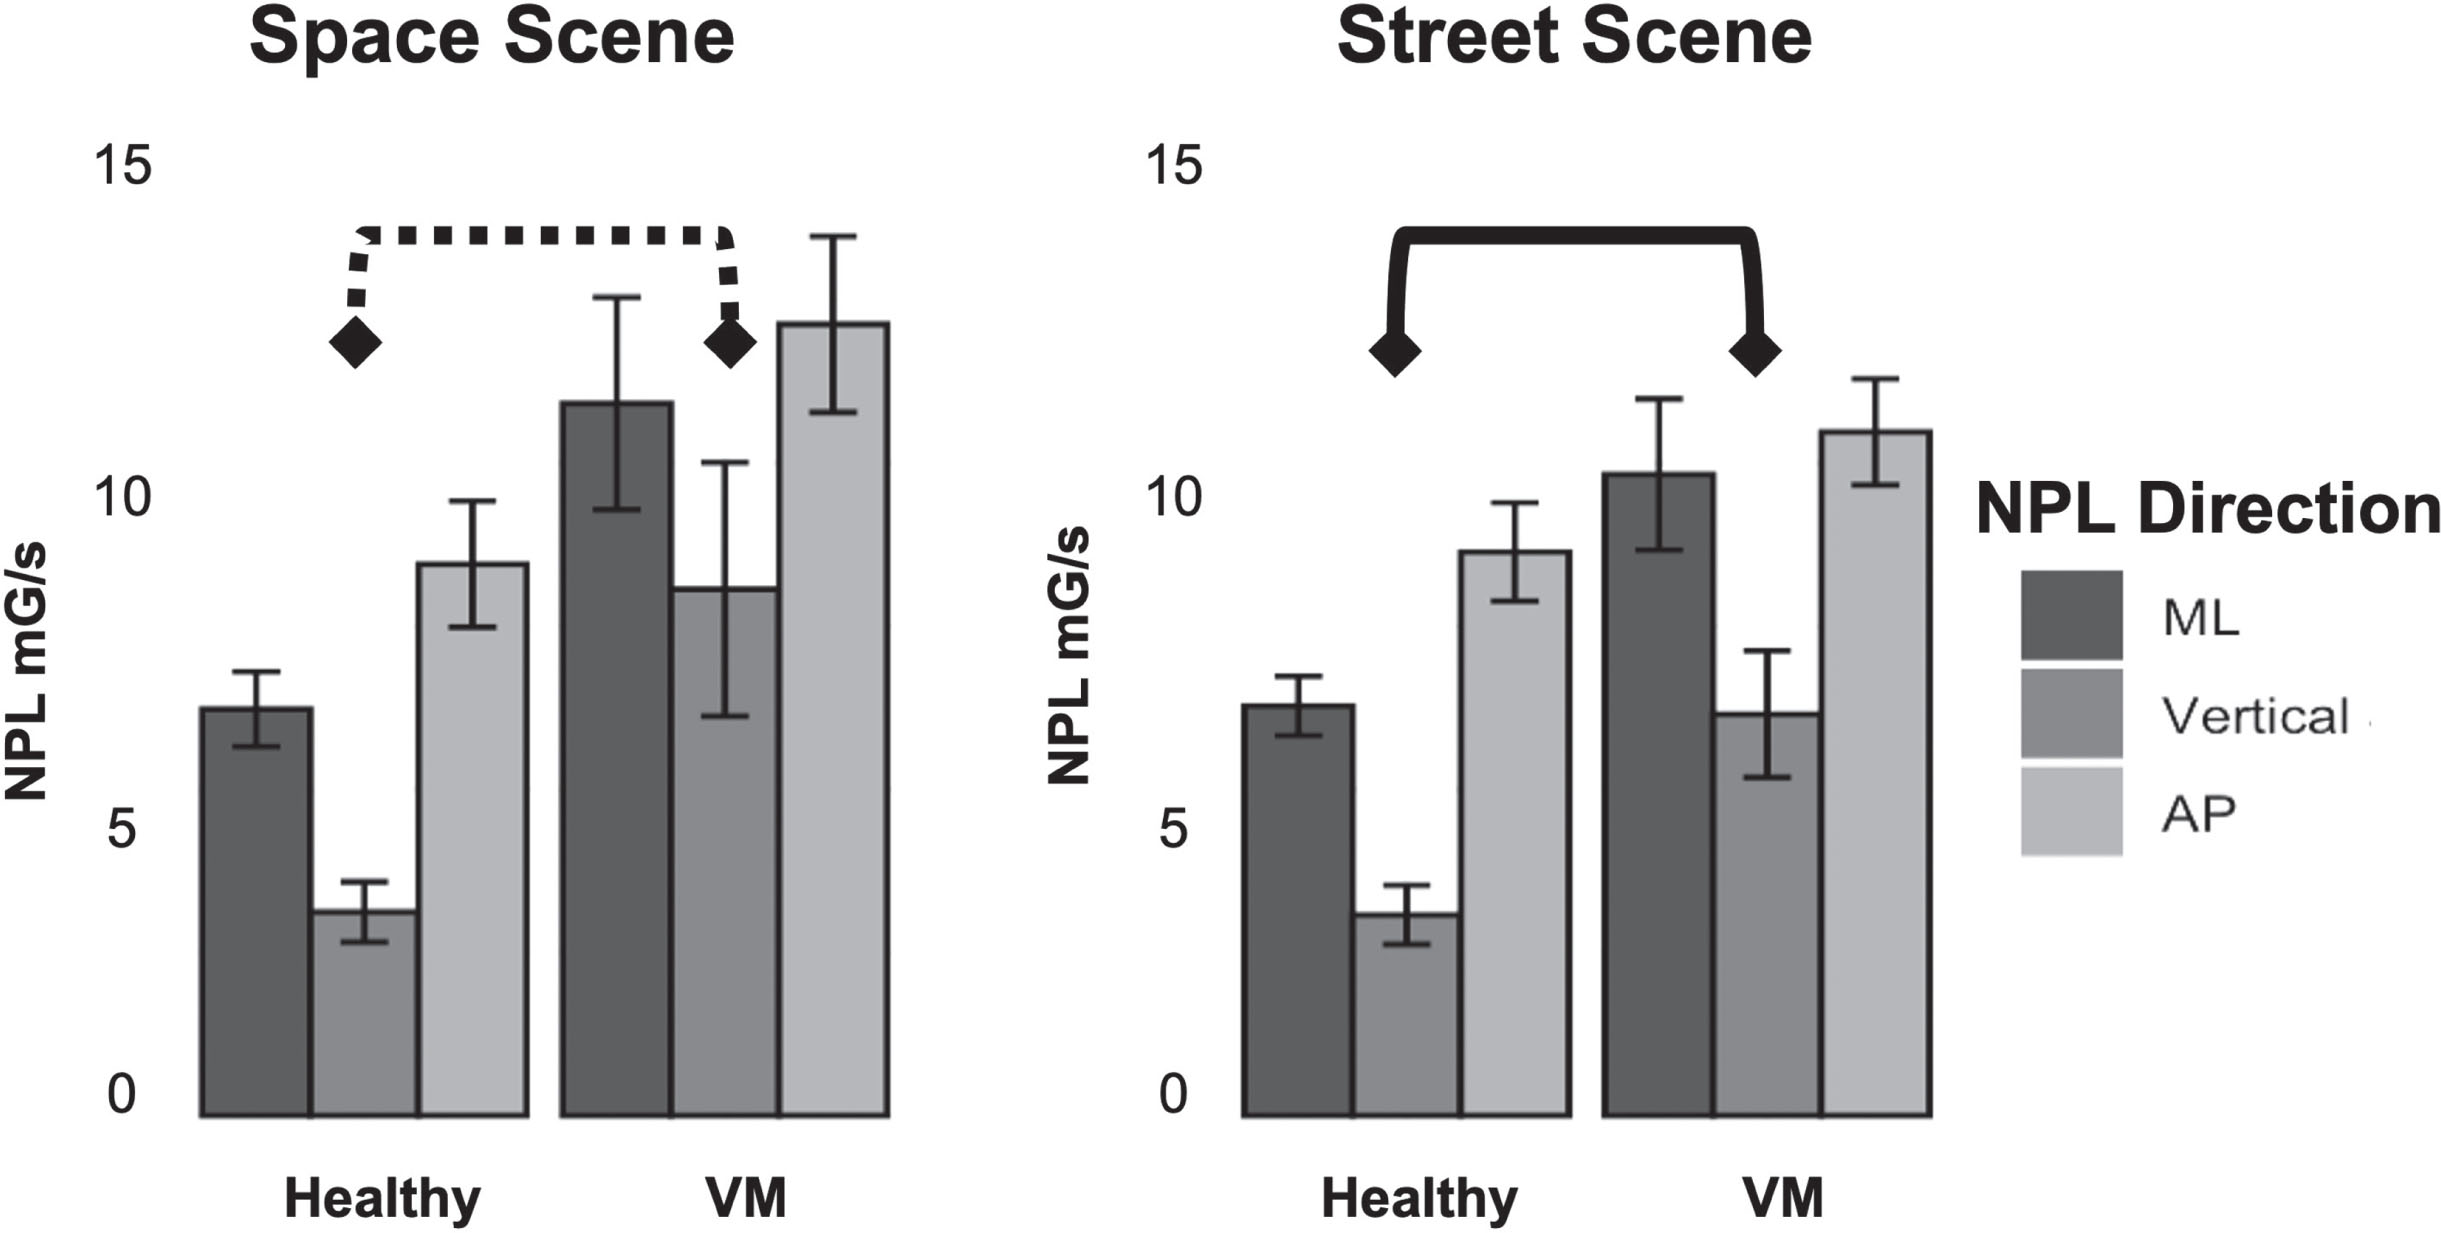
Normalized Path Length (NPL) in milli-Gravitational (mG/s) of trunk linear acceleration in the Medial-Lateral (ML) (black), vertical (dark grey), and Anterior-Posterior (AP) (light grey) directions. Square brackets indicate the existence of a significant effect size between healthy controls and vestibular migraineurs (dotted line: medium effect, solid line: large effect) in the vertical plane.
A Wilcoxon signed-rank test revealed significant differences between the means of some postural measurements with respect to time segments of the experiment. NPL-ML had a higher effect size than NPL-AP during minute 1 (W = 119, p = 0.01, d = 0.83) and NPL-Vert exhibited medium and high effect sizes throughout the experimental period.
The NPL-AP difference between groups had a medium effect size in the SPACE scene compared to the STREET scene (t(371) = –2.43, p = 0.01, d = 0.75). The NPL-ML and NPL-Vert demonstrated medium effect sizes between groups with both SPACE and STREET environments: ML(Space) (t(40) = –2.29, p = 0.02, d = 0.70), ML(Street) (t(40) = –2.67, p = 0.01, d = 0.82), Vert (Space) (t(40) = –2.52, p = 0.01, d = 0.77), and Vert (Street) (t(40) = –2.62, p = 0.01, d = 0.80).
The interaction term between Group and Scene was significant for NPL-AP (F (1,371) = 12.98, p = <0.001), NPL-Vert (F (4,365) = 6.17, p = 0.01), and NPL-ML (F (1,40) = 6.03, p = 0.01). The estimated fixed effect revealed that in VM adults, NPL-AP was approximately 1.79 mG/s less than the healthy group (t(371) = 3.60, p = <0.001). In the vertical direction, NPL-Vert in VM adults was approximately 4.56 mG/s greater than the healthy group (t(42.5) = 2.861, p = 0.006). NPL-ML in the VM group was approximately 4.05 mG/s greater than healthy participants (t(46) = 2.65, p = 0.01).
After examining the full-effects model for ISCR, RMS (AP, ML, Vert), and NPL (AP, ML, Vert), non-significant terms and interactions were removed and Linear Mixed Models of time, VM, and virtual environment were specified (Table 2). There were no significant correlations between ISCR and NPL, DHI, or ABC scores. The final model for estimating change in the ISCR included the interaction of group with time because the effect of time was found to be significant (F (1,417) = 23.31, p = 0.001). In the SPACE scene, NPL-ML had the highest effect size during minute 1 (W = 119, p = 0.01, d = 0.83); NPL-Vert demonstrated medium and high effect sizes throughout the 3 min period.
Linear Mixed Model Results of time, VM, and virtual environment
Linear Mixed Model Results of time, VM, and virtual environment
**p < 0.01 ***p < 0.001.
The estimated fixed effect of the group showed that ISCR was approximately 59.5 μS greater in VM individuals than in healthy individuals (t(4.17) = –7.2, p = 0.001). In both visual environments, the VM group showed a lower baseline ISCR level than the healthy group; by the first minute of the SPACE scene, the ISCR phasic response of the VM group then exceeded the healthy subjects in SPACE and was equal to healthy subjects in the STREET scene. While the VM group was able to match the level of healthy individuals at the end of the SPACE scene experiment, in the STREET scene, ISCR levels of the VM group again dropped below the healthy level at the end of the trial (Fig. 5).
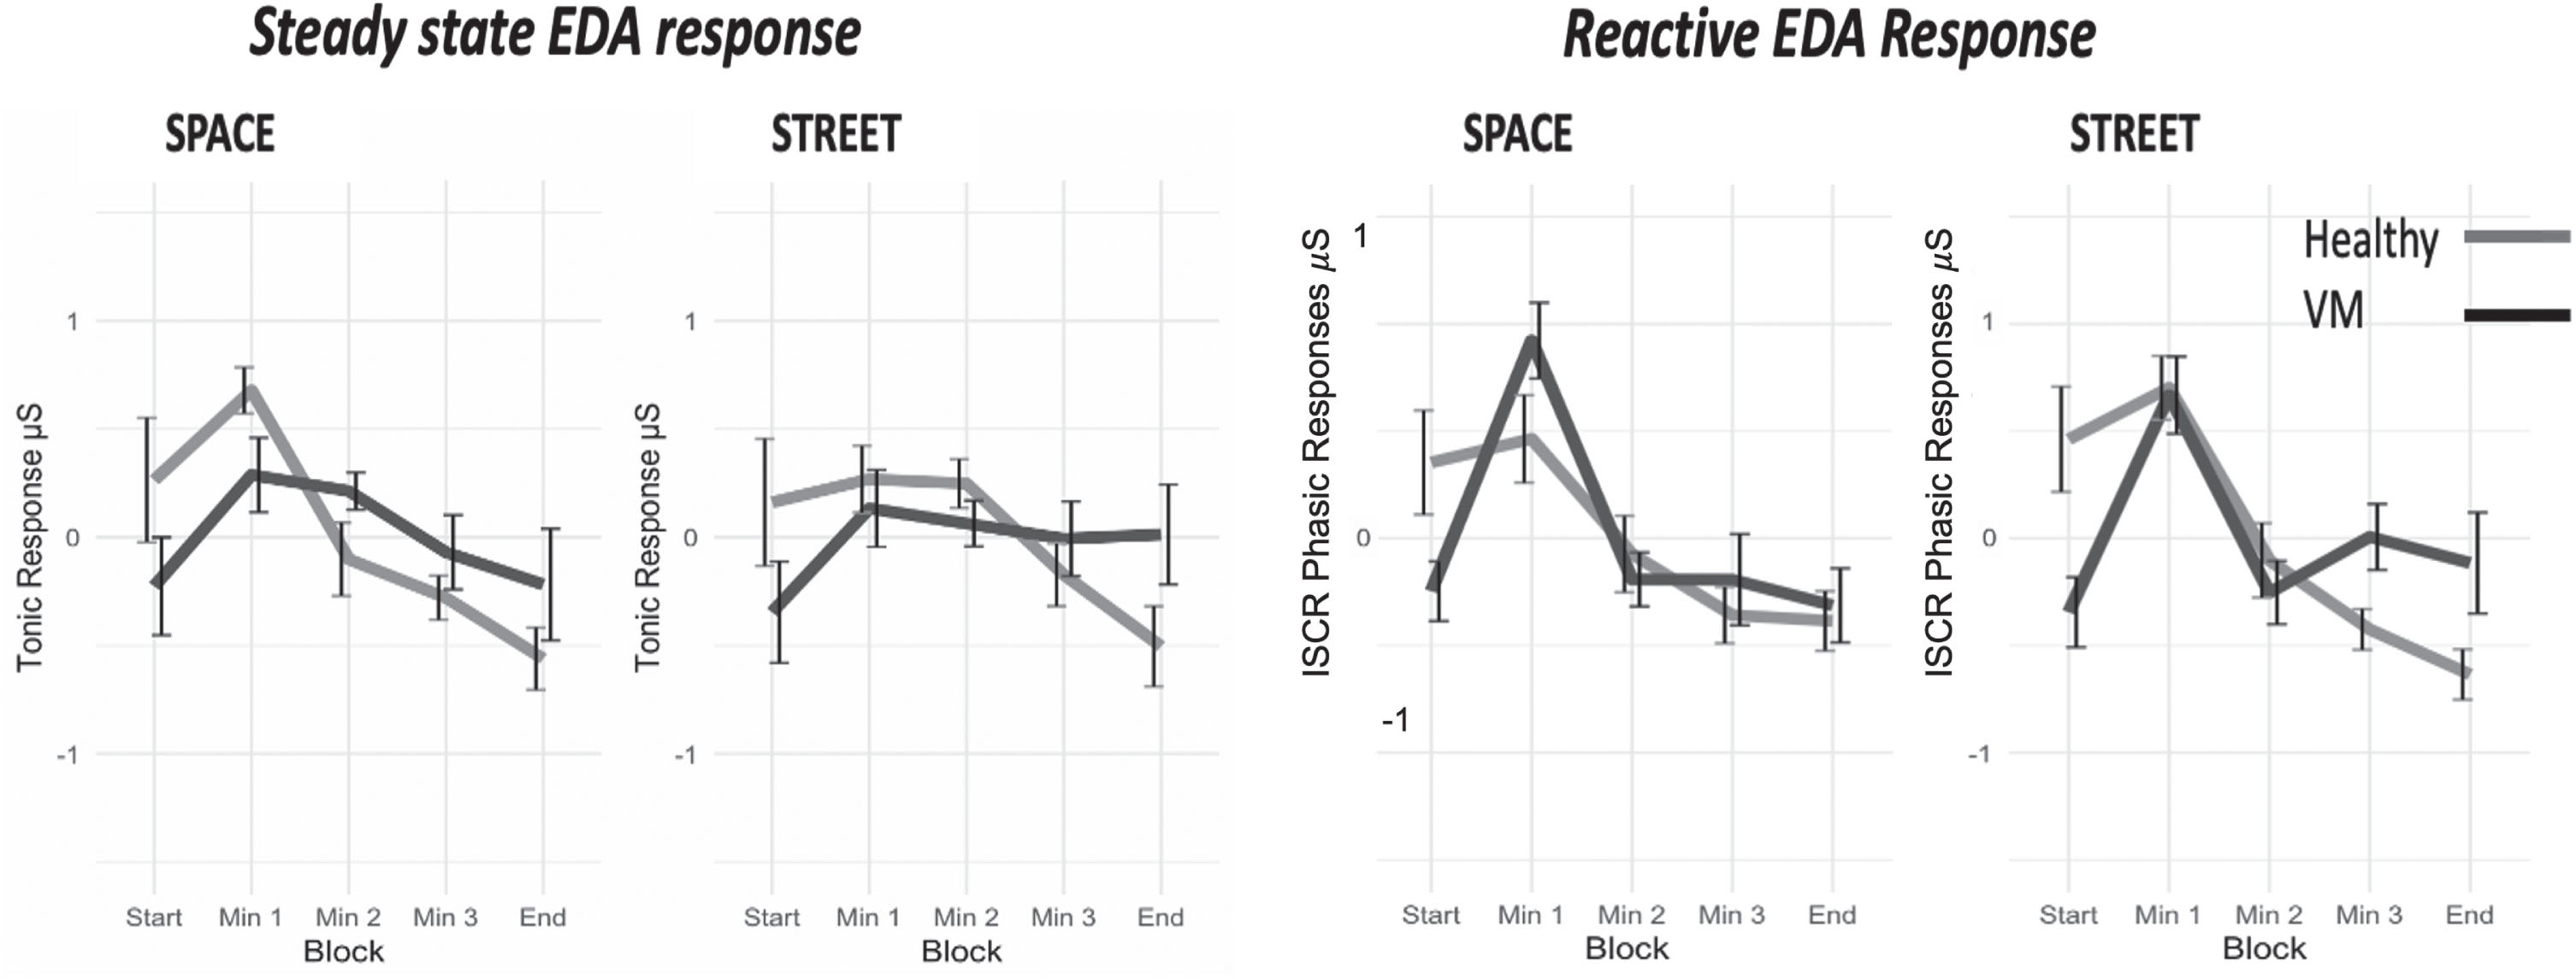
Tonic (
Results of the Pearson correlation across groups indicated a significant association between NPL-Vert, DHI scores, and ABC scores. Further, ABC scores were significantly associated with EDA Tonic responses (Fig. 6). There were no significant associations, however, between NPL in the vertical direction and the ISCR phasic EDA response, DHI, and ABC scores.
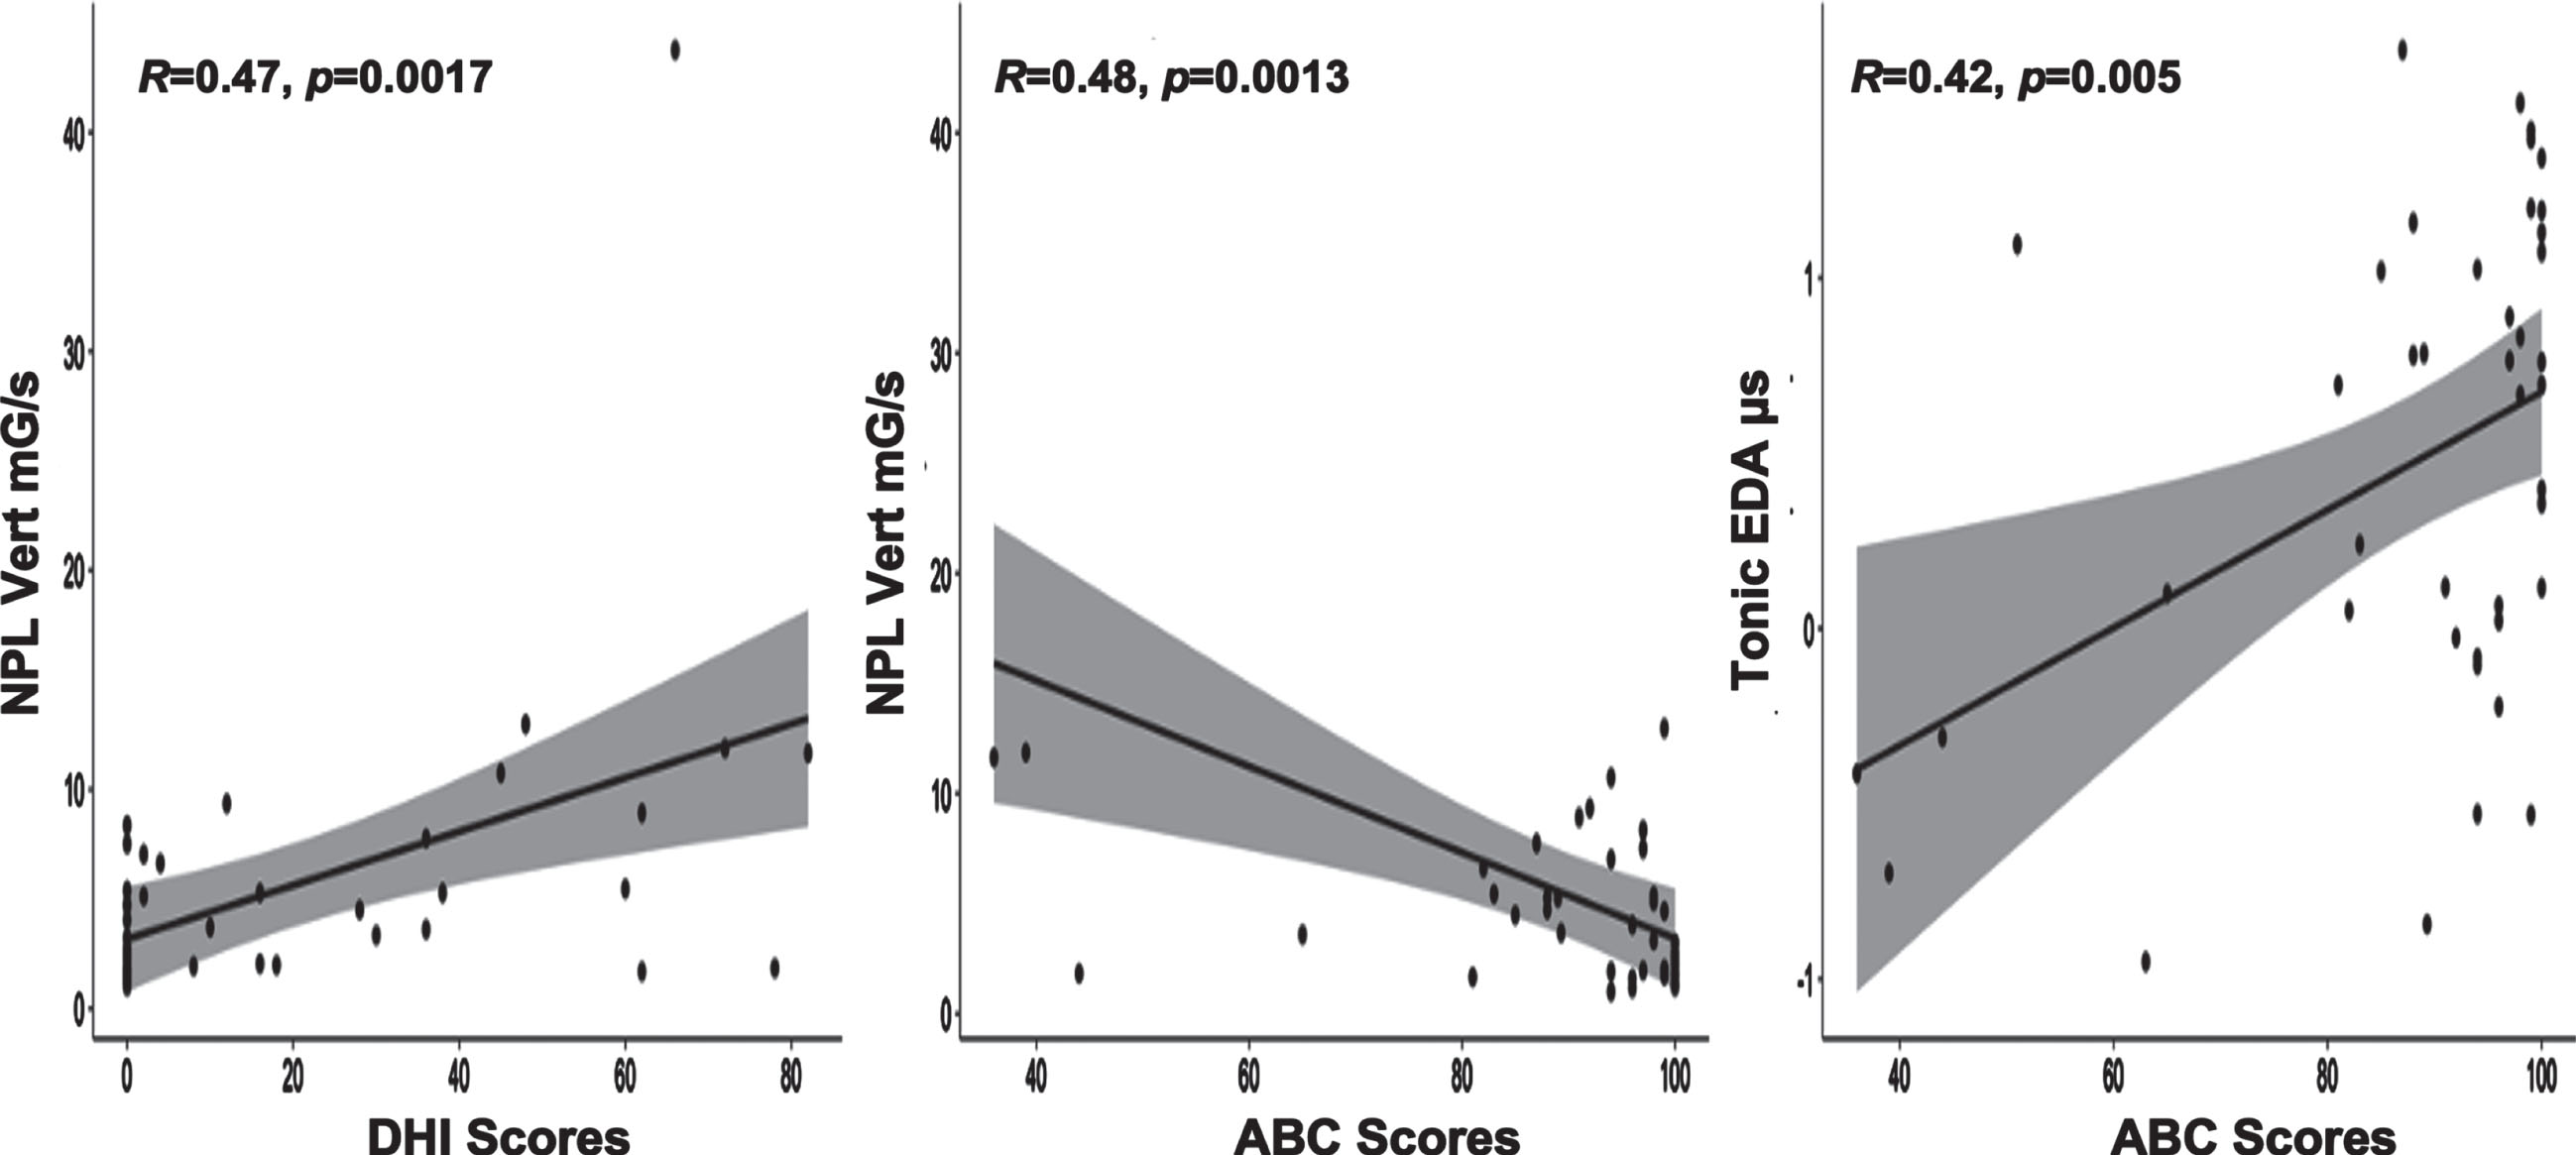
Scatter plots of the association between NPL vertical and DHI scores (
Results of this study suggest that the combined information from EDA and trunk acceleration measures (RMS and NPL) can provide an objective measure for identifying adults with VM that potentially would strengthen diagnostic and prognostic confidence. These measures could then be used in concert with the specific self-reported health outcome measures, including ABC, VSS-SF, VVAS, and DHI, that were identified as reliable for distinguishing between groups of VM and healthy individuals. The ability to quantify symptoms associated with VM is needed because of the challenges presented in this diagnosis [9, 47] and in the ability to reliably document progress during rehabilitation. Our results supported the supposition that EDA activity and the NPL of trunk accelerations do significantly differ between healthy adults and adults with VM when having to accommodate postural disorientation due to visual-vestibular conflict and unreliable proprioceptive information. Furthermore, visual dependence, which can contribute to the symptoms of postural instability and disorientation, was identified as a risk factor with VM.
A novel result in this study was that the measure of trunk acceleration in the vertical plane best distinguished VM adults from healthy individuals. This parameter may not have been revealed as a significant variable in previous studies because postural reactions tend to be examined in a transient fashion rather than as an uninterrupted behavior across time. In this study we explored postural behaviors over a longer period (3 min) and a clear difference emerged in the ability to maintain fluid compensatory behaviors between the two populations. The NPL measure is also likely to be a more sensitive variable than RMS for capturing the time-varying motions that accompany postural instability [2].
VM is predominantly a central vestibular disorder and significant differences in vertical plane displacement are consistent with prior reports about adults with other central nervous system disorders (i.e., Parkinson’s Disease and Alzheimer’s) [26, 38]. An explanation for the indication of increased frequency of trunk acceleration in the vertical plane is that more frequent accelerations in this plane might enhance perception of postural vertical through recurrent stimulation of the otoliths [39]. This explanation is further supported by the combined findings of increased vertical acceleration and a higher occurrence of visual dependency in adults with VM.
Based on empirical observation during our sessions, participants rocked slightly up and down by pressing on their forefoot. We therefore propose that these individuals were attempting to override the impact of the visual-vestibular conflict on spatial orientation by augmenting lower limb proprioceptive input. Participants appear to have used a strategy of augmenting sensory feedback from cutaneous mechanoreceptors inputs from their foot to counteract the induced-postural instability [9, 10]. Our findings of a strong correlation between the RFT results and the magnitude of trunk acceleration in adults with VM provides a compelling physiological basis for vertical segmental adjustments to compensate for canal-otolith dysfunction and maintain their vertical orientation [23].
Of additional importance is that the level of tonic EDA (central threshold) in adults with VM remained lower than that of healthy individuals. Although all participants were informed about the nature of the VR stimuli, only the healthy adults exhibited discernable predictive EDA tonic activity; in fact, tonic EDA levels in healthy adults were highest prior to exposure to the VR environment. Adults with VM demonstrated delayed EDA tonic activity that reached levels equivalent to healthy adults only during exposure to the VR environment.
There is evidence supporting an association between high tonic EDA activity and the production of successful compensatory/anticipatory postural responses to perturbation [52–54]. We propose, therefore, that high tonic EDA activity prior to exposure to the VR in healthy adults provided a level of central excitation (central-set) that made them more efficient in predicting and producing the requisite postural reactions. This would suggest that EDA tonic activity is associated with the feedforward control of compensatory postural responses.
This is the first study we are aware of that evaluates both the autonomic nervous system and postural control responses in adults with VM within VR environments. Results strongly support the hypothesis of an association between the ANS and the vestibular system with VM. These findings have revealed distinct features that would support quantifiable diagnostics of this clinical population. An inability to recruit patients with severe VM symptoms due to their incapacity to endure the experimental visual environments was, however, a limitation in this study. Also, our inability to obtain cervical vestibular evoked myogenic potential (cVEMP) and ocular vestibular evoked myogenic potential (oVEMP) assessments limited our ability to confirm the integrity of the otolith function. Although a diagnosis of VM is highly dependent on the presence of distinguishable clinical features, we contend that being able to quantify specific components of these behavioral symptoms will validate the diagnosis and also enhance a vestibular rehabilitation regiment by objectively quantifying and monitoring changes in symptoms over time.
Footnotes
Acknowledgments
We want to thank Dr. Art Mallinson and Dr. Susan Herdman for their consultation and extremely helpful critiques on previous versions of this work. This work was supported by the Saudi Arabia Culture Mission (SACM), The Graduate Board Fellowship Committee of Temple University- Doctoral Award, and the CPH Visionary Research Award to Dr. AlSharif.