
Abstract
Objective:
The purpose of this study was to determine the extent to which sensory integration strategies via head sway, derived from a Head-Mounted Display (HMD), change in people with vestibular disorders following vestibular rehabilitation.
Design:
Randomized Controlled Trial
Setting:
Vestibular Rehabilitation Clinic
Participants:
Thirty participants with vestibular dysfunction and 21 age-matched controls.
Main Outcome Measures:
Participants experienced two levels of visual surround (static or moving ‘stars’, front to back at 0.2 Hz, 32 mm) and white noise (none or rhythmic) while their head sway was recorded via the HTC Vive. We quantified head sway via Directional Path (DP) and Root Mean Square Velocity (RMSV) in 5 directions: anterior-posterior, medio-lateral, pitch, yaw, and roll and Power Spectral Density in low (PSD 1), medium (PSD 2) and high (PSD 3) frequencies in the anterior-posterior direction.
Interventions:
Participants performed the assessment prior to being randomized into 8-weeks of contextual sensory integration training in virtual reality or traditional vestibular rehabilitation and once again following completion of the intervention. Controls performed the assessment once. Twelve participants dropped out, half due to covid lock-down. We applied an intention to treat analysis.
Results:
We observed significant increases in AP DP, RMSV and all PSDs with change in visual level. Both intervention groups significantly decreased medio-lateral, pitch and roll DP and RMSV and anterior-posterior PSD 2 with no group differences. Vestibular participants were significantly higher than controls on all outcomes pre rehabilitation. Post rehabilitation they were only significantly higher on PSD 2. Sound was not a significant predictor of head sway in this protocol.
Conclusions:
Head sway decreased following vestibular rehabilitation regardless of visual load or type of intervention applied. This change was measured via head kinematics derived from a portable HMD which can serve as a sensitive in-clinic assessment for tracking improvement over time
List of abbreviations
Head-Mounted Display
Contextual Sensory Integration
Root Mean Square Velocity
Directional Path
Simulator Sickness Questionnaire
Individuals with vestibular dysfunction often present with sensory integration deficits; they tend to develop a sensory substitution strategy whereby the remaining sensory inputs (e.g., vision [8, 15], and auditory [47]) are weighted more heavily. Sensory integration deficits, such as visual dependence, are thought to be associated with imbalance, dizziness, and anxiety that individuals with vestibular dysfunction experience in busy environments. Visual dependence is a common finding in vestibular dysfunction and reducing it is often a goal in vestibular rehabilitation [14, 18].
To capture sensory integration deficits and changes following rehabilitation, clinicians who specialize in vestibular rehabilitation typically use self-reported questionnaires such as the visual vertigo analog scale [5, 6], and standing balance tests such as the sensory organization test [40] or the clinical test of sensory interaction for balance (scored based on duration of holding a position) [17]. Portable virtual reality headsets (Head Mounted Displays, HMDs) have been proposed as a sensitive assessment of sensory integration for postural control, particularly for people with vestibular disorders. HMDs provide the ability to manipulate the environment beyond standing with closed eyes and can combine various sensory inputs. HMD assessments can become fully portable allowing for accurate kinematics to be collected outside research laboratories without expensive equipment. Head kinematics derived from HMDs were found to be reliable [44], were validated against motion capture systems [34, 42], and showed strong cross-correlation with postural sway data derived from force plates [24, 36]. Measuring postural behavior at the head during static stance may provide a picture of a whole-body movement. Head sway is not an identical response as postural sway and should not be interpreted as such, however, these behaviors are highly correlated and have been shown to respond similarly to perturbations in healthy adults and individuals with vestibular hypofunction[24, 44].
Head sway is of particular interest in people with vestibular dysfunction. It has been proposed that people with vestibular dysfunction overwork their neck muscles in order to control the head in space which could be manifested in excessive head sway [1, 2]. Indeed, several studies observed differences in head sway between participants with visual sensitivity or vestibular dysfunction and controls in response to visual perturbations [22, 32]. For head sway to become a viable clinical assessment in vestibular rehabilitation, its sensitivity to change with rehabilitation needs to beevaluated.
The purpose of this study was to determine the extent to which sensory integration strategies via head sway change in participants with vestibular disorders following vestibular rehabilitation.
The overarching purpose was broken into 4 specific aims:
We hypothesized that participants with vestibular dysfunction will demonstrate increased head sway, particularly in dynamic visual and auditory environments. We also hypothesized that head sway will be reduced in participants following vestibular rehabilitation but not to the level of healthy controls.
Methods
Participants
We recruited participants with vestibular dysfunction (central or peripheral, acute, subacute or chronic) from the Vestibular Rehabilitation Clinic at the New York Eye and Ear Infirmary of Mount Sinai, and controls from the community. All participants reported no other neurological or orthopedic conditions that may interfere with balance. Controls reported no dizziness or concern about their balance. Participants were screened for normal or corrected to normal vision using the standard EDTRS chart. Adequate vision was considered a visual acuity of 20/60 (the NYS acceptable standard for driving). Normal protective sensation at the bottom of the feet was confirmed by the ability to perceive a 5.07 (10 gram) monofilament [43].
Protocol
This was a randomized controlled trial with a-priori concealed allocation using a randomized block design generated by the study statistician [4]. The study, including all post-covid modifications, was approved by the BRANY Institutional Review Board, the Institutional Review Board of Mount Sinai and New York University Committee on Activities Involving Research Subjects.
For the postural control assessment, participants were standing on the floor barefoot, hips-width apart, wearing the HTC Vive Pro Eye (HTC, Taoyuan City, Taiwan) HMD (portable virtual reality headset). They were asked to look straight ahead and do whatever felt natural to them to maintain their balance. The previously established protocol comprised of a visual surround 3-wall display of a ‘stars’ scene [28, 41] that was either static or moving anterior-posterior (AP) at 0.2 Hz and 0.032 meters with or without rhythmic white noise (intensity increases from 0 to 3 dB at 0.3 Hz). All participants completed the Simulator Sickness Questionnaire (SSQ) [21] before and after the assessment.
Before the covid-19 lockdown, participants were tested at a human motion laboratory and performed 3 repetitions of each condition. All control participants were recruited prior to lockdown and performed one assessment (no post timepoint). When the study resumed in September 2020 the assessment was converted to an in-clinic setup (Fig. 1) and was shortened to 2 repetitions of each condition (for a protocol administration lasting 8 minutes total) with the same headset and testing application (static and moving stars). Following the baseline assessment, vestibular participants were randomized into 8 weeks of contextual sensory integration (C.S.I) training [30] or traditional vestibular rehabilitation. Participants repeated the assessment following the 8 weeks of their assigned type of vestibular rehabilitation. For a detailed description of the C.S.I program (hardware and software) see Lubetzky et al. 2020 [30]. The hardware included a regular HTC Vive Headset (HTC, Taoyuan City, Taiwan) with Bose headphones (Bose Corporation, Framingham, MA, USA) connected with a cable. Participants also completed functional and self-reported outcomes pre and post intervention. These results are reported elsewhere [20].
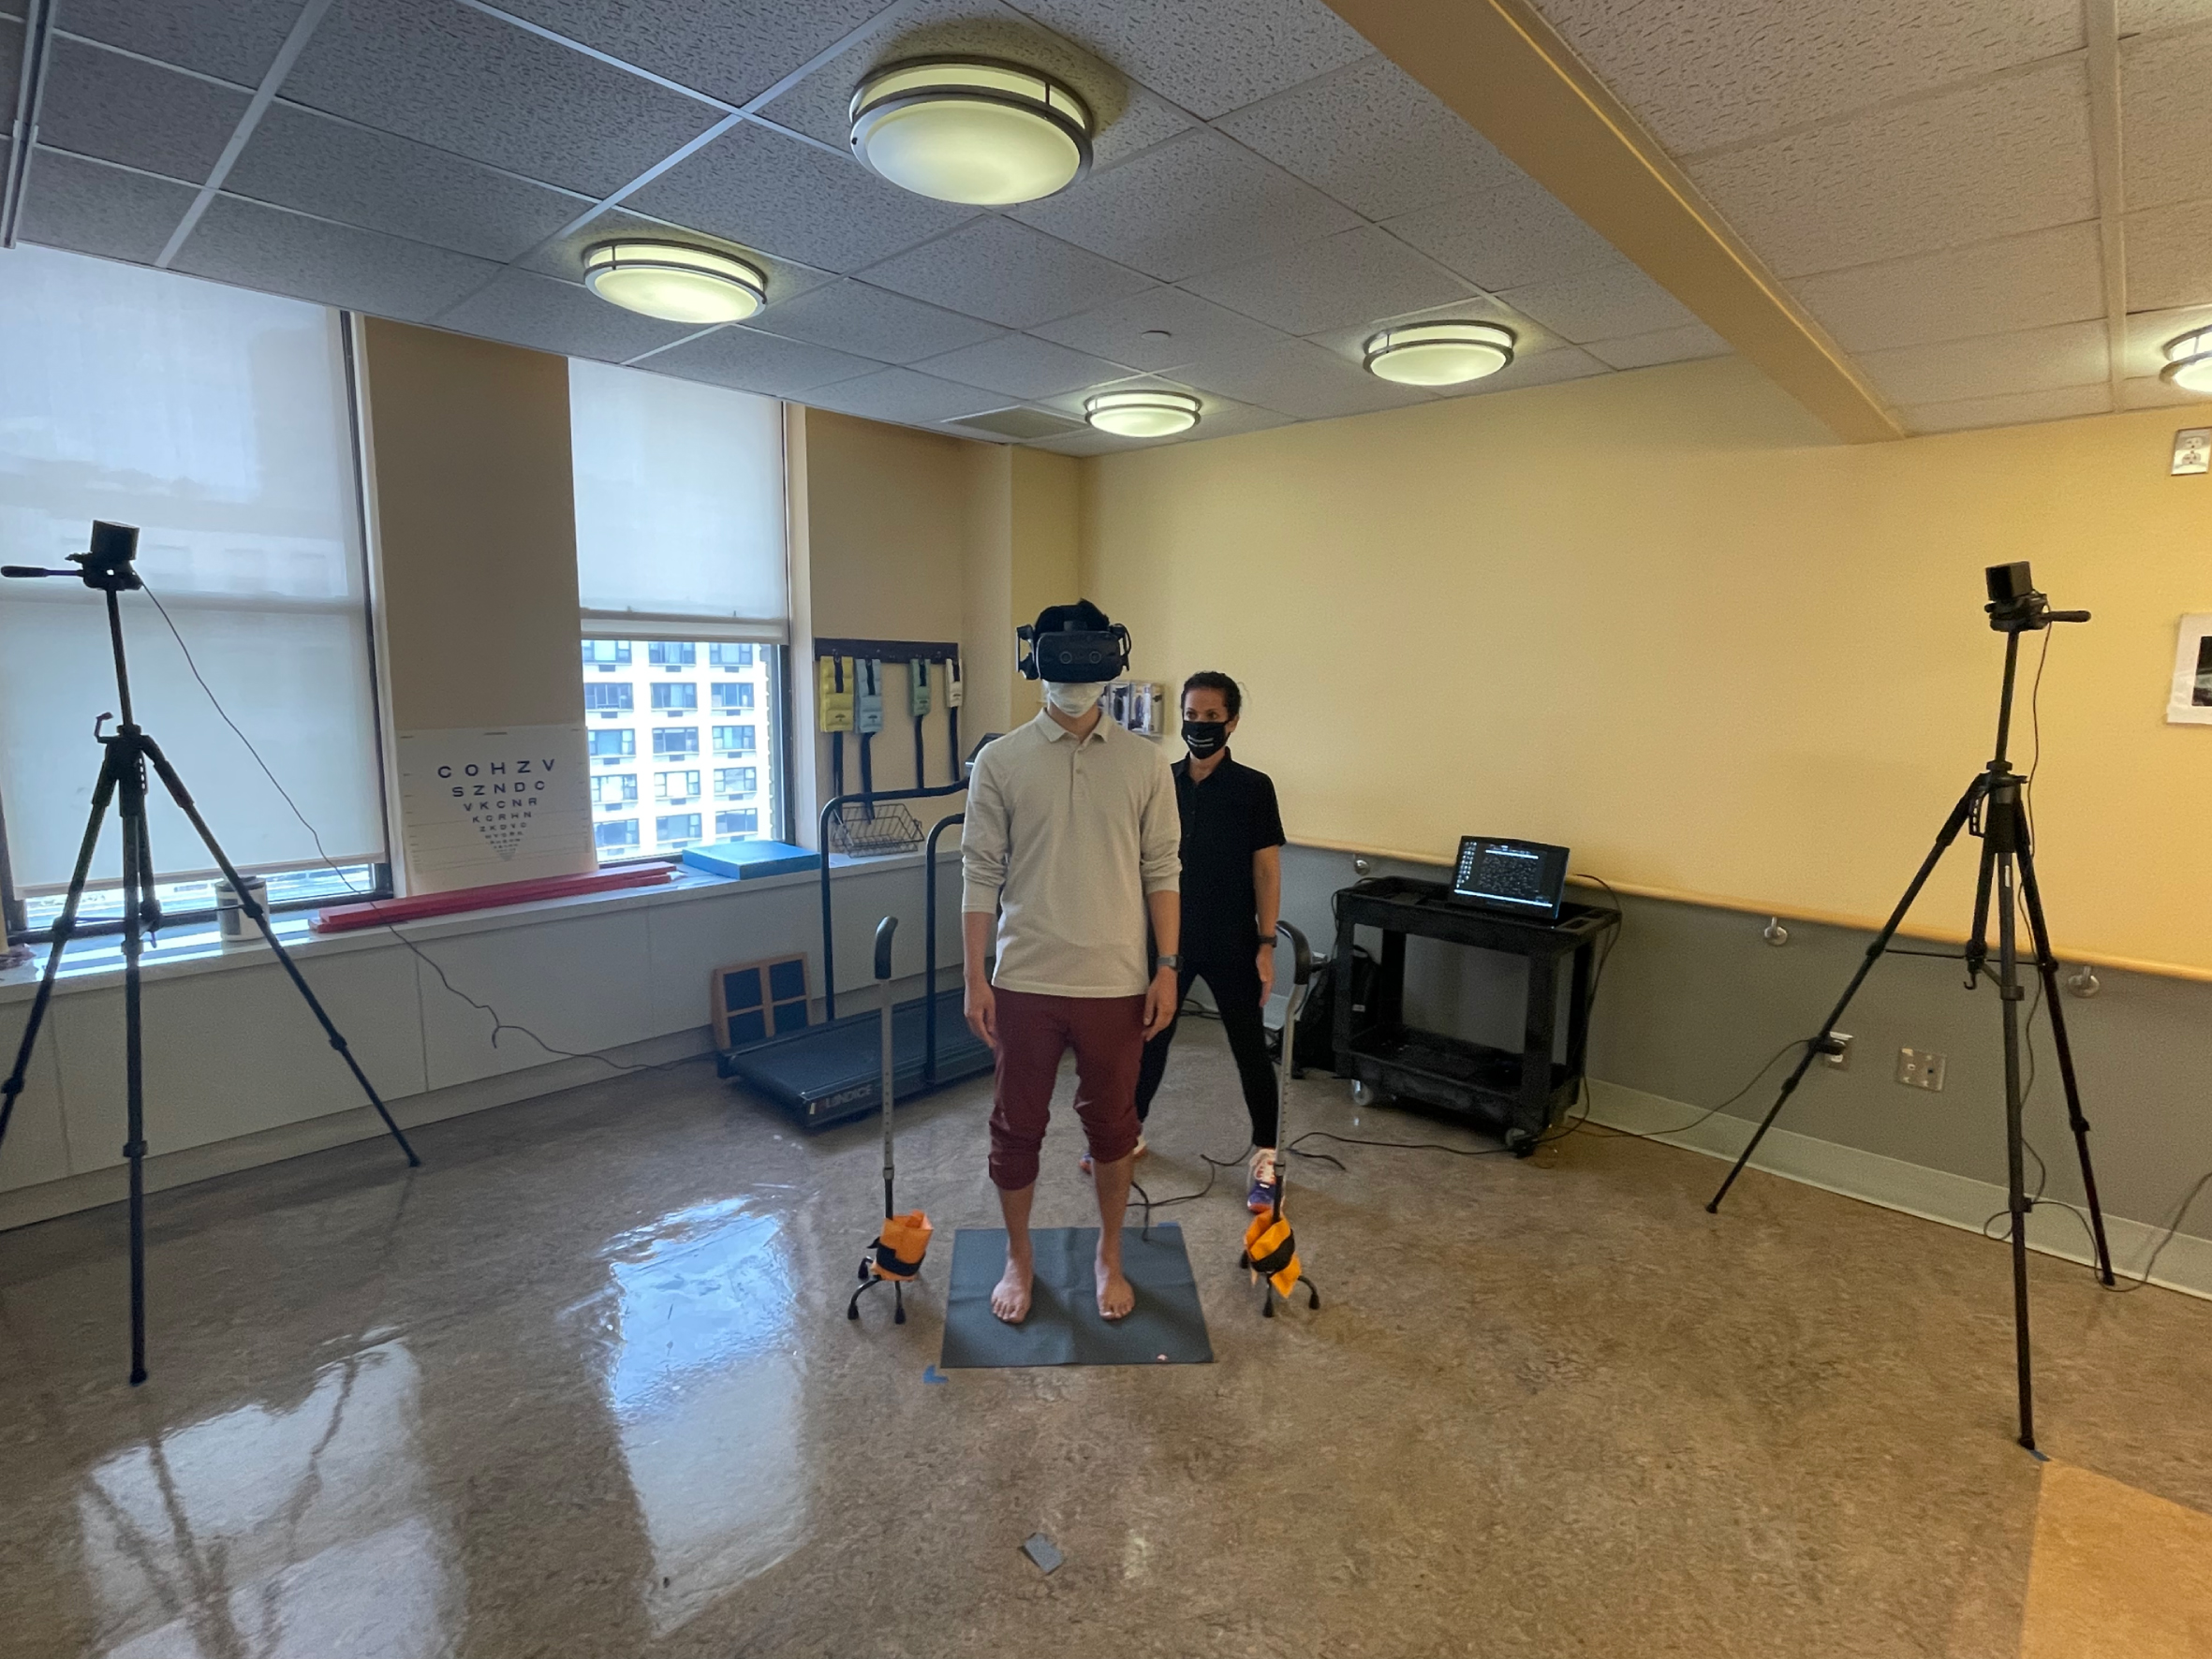
In-clinic Experimental Setup. The HTC Vive Pro Eye and the 2 light houses were placed at the clinic’s gym for the duration of testing.
Head kinematics were recorded via the headset at a frame rate of 90 Hz by custom-made Unity software written for HTC Vive. Data was processed and analyzed in Matlab R2021a (Mathworks, Natick, MA). A low-pass 4th order Butterworth filter with a conservative cutoff frequency at 10 Hz was applied [45]. The last 55 seconds (of the total 60 seconds) were used to quantified head Directional Path (DP, cm or radians) and Root Mean Square Velocity (RMSV, cm/s or radians/s) [37] in 5 directions: anterior-posterior, medio-lateral, pitch, yaw, and roll. DP is defined as the total path length of the position curve in each direction. RMSV is defined as the difference in position between two consecutive data points divided by the average time interval. The velocity at each point is squared and then summed. The square root of the sum is then divided by the number of data points [39]. Power spectral density (PSD, decomposing the signal into its frequency components) of sway in the anterior-posterior direction in 3 frequency segments was derived from the time series of the head sway and serve to explore sensory strategies [9]. In our paradigm, PSD 1 (0 to 0.25 Hz) includes the visual frequency and is considered to indicate visual weighting. These slow frequencies have also been suggested to reflect cortical control of balance. PSD 2 (0.25 to 0.5 Hz) has been suggested to be sensitive to vestibular dysfunction [12]. PSD 3 (0.5 to 1 Hz) reflects small corrective adjustments via somatosensory loops [13]. Based on analysis done in our lab, the head has good agreement with center-of-pressure data derived from a laboratory force platform (Intra-class correlations of about 0.8 for PSD 3 and about 0.9 for PSD 1 and 2).
Statistical analysis
This was a pilot study aiming to generate pilot data for a sample size calculation for a properly powered RCT. We calculated descriptive statistics (mean, min, max, standard deviation [SD]), and generated plots to inspect model assumptions for all outcome and descriptive measures. Visual inspection showed no differences between sound conditions. To confirm this observation, we fit two linear mixed effects models for each outcome. The first included interactions of sound by time, visual condition and group, as well as all main effects. The second included only the interactions time by visual condition by group and the corresponding main effects. In all cases, the Akaike Information Criteria (AIC) was lower for the model that did not include sound, therefore, justifying the removal of this variable in all other models. The final models used for subsequent analyses did not include sound as main effect, nor interacted with any other variables.
We used a linear mixed effects model with intention to treat. This model maximizes the information we can obtain from the data by accounting for the inherent multi-level study design (person, conditions, repetitions). That is, since each person completes various trials for each condition, the linear mixed effects model accounts for these sources of variability [11]. P-values for the fixed effects were calculated through the Satterthwaite approximation for the degrees of freedom for the T-distribution [19]. Visual inspection of the fitted vs. residual plots in the response scale showed heteroskedasticity and therefore we log transformed the outcome measures.
To test for changes among participants before and after intervention, the linear mixed effects model included a main effect of group (C.S.I/ traditional), time (pre/ post rehabilitation) and visual condition (static/ dynamic) as well as their 2- and 3-way interactions. Because there were no significant differences between intervention groups, we then combined the 2 intervention groups for the comparison to controls. These models included a main effect of group (control, vestibular pre rehabilitation, vestibular post rehabilitation), and visual condition (static, dynamic) as well as their 2- way interactions.
We report the P value derived from the models using log transformed outcome measures, point estimates for each group at each visual condition and time point in the units of measurement through the calculation of the estimated marginal means with their 95% confidence intervals. We also report differences in means (DIMs) that can be interpreted as an effect size. Analyses were conducted using R version 4.1.2 (2021-11-01, The R project for Statistical Computing).
Results
Sample
We recruited 9 participants before the covid-19 pandemic: 2 completed (1 traditional, 1 C.S.I), 1 dropped out (traditional, this patient also had no head kinematics data due to a technical malfunction), 6 participants were unable to complete because the study shut down in March 2020 due to covid restrictions in New York City. These participants did not return to the study. We resumed recruitment in September 2020 and recruited 21 additional participants. Ten were randomized to the C.S.I group and 11 to the traditional group. We had 2 additional dropouts in the traditional group and 3 in the C.S.I group. In total, 18 participants completed the study (10 traditional, 8 C.S.I). There were no statistically significant differences on any demographic or outcome variables between participants pre and post covid, between participants who dropped out or completed, and between intervention groups in attrition %. Using intention to treat modeling, we used data from 29 participants (1 drop out not accounted for due to aforementioned technical malfunction) and 21 controls. See Fig. 2 for recruitment flow and Table 1 for the sample description.
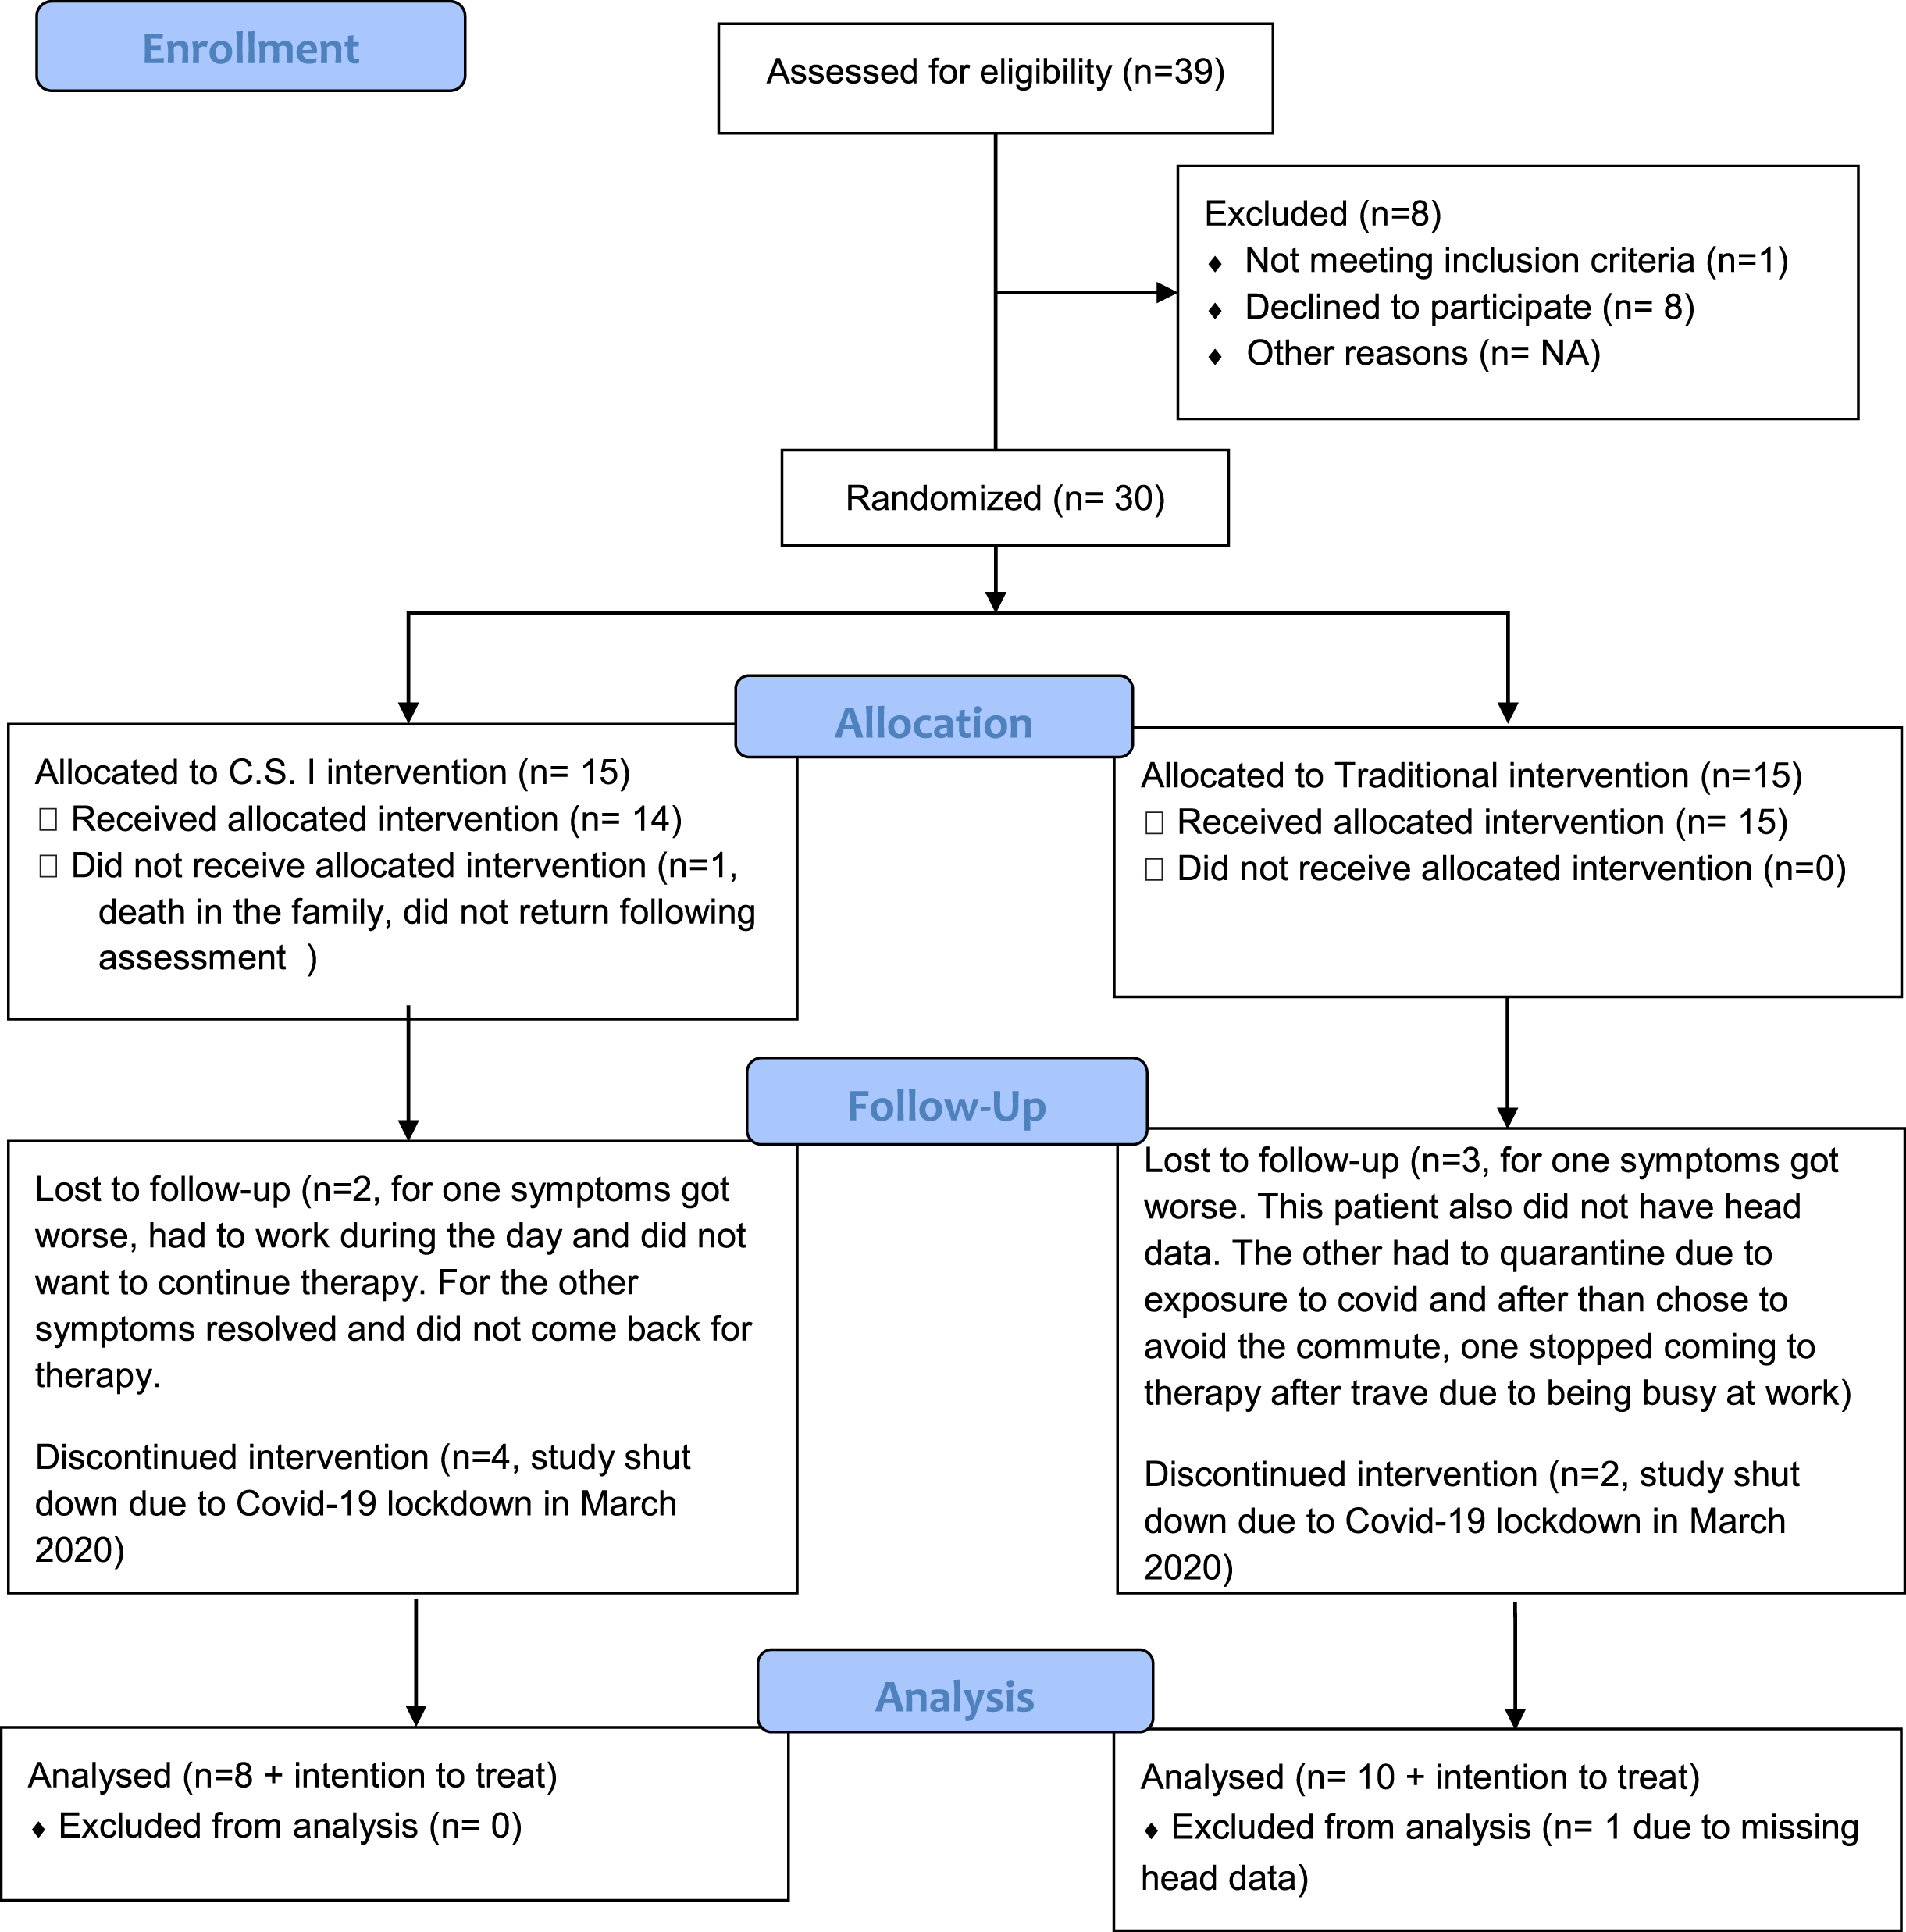
Recruitment flow diagram.
We planned the program as 10 weeks (baseline, 8 weeks of intervention, post) but several participants tested on the same day as intervention and others had to take a break in the middle due to covid-related quarantine. The average time between pre and post assessment was 11 weeks (SD = 2.69). Table 2 outlines the intervention programs for both groups.
Sample demographics (total sample N = 50) pre-intervention values
A significant increase between static and dynamic visual conditions across groups with no interaction was observed for the following outcomes (reported DIMs are for the increase between static and dynamic visual conditions): ML RMSV (P = 0.04, DIM controls: 0.03 cm/s, vestibular pre rehabilitation: 0.07 cm/s), AP DP (P < 0.001, DIM controls: 5.57 cm, vestibular pre: 7.00 cm) AP RMSV (P < 0.001, DIM controls: 0.17 cm/s, vestibular pre: 0.21 cm/s), pitch RMSV (P = 0.014, DIM controls: 0.002 cm/s, vestibular pre: 0.003 cm/s). See Table 3 for model estimates and 95% CI pre group and condition.
NT: Not Tested. NA: Not Applicable.
C.S.I and traditional vestibular rehabilitation programs
There was no main effect of group (Traditional / C.S.I) for any outcome measure and no group by time or group by visual condition 2-way or 3-way interactions. We only observed a significant increase between static and dynamic visual conditions in the AP direction for both outcomes: DP (P = 0.0002, DIM for the change between static and dynamic visual conditions for the traditional group: 6.90 cm, C.S.I: 7.33 cm) and RMSV (P = 0.0001, DIM for the traditional group 0.21 cm/s, for the C.S.I group 0.22 cm/s).
We observed a significant main effect of time (both groups decreased significantly) for the following outcomes (reported DIMs are for the differences between vestibular post and pre rehabilitation on the static scene): DP ML (P = 0.006, DIM: traditional: –3.50 cm, C.S.I: –3.43 cm), RMSV ML (P = 0.013, DIM: traditional: –0.09 cm/s, C.S.I: –0.08 cm/s), DP pitch (P = 0.004, DIM: traditional: –0.15 rad, C.S.I: –0.11 rad), RMSV pitch (P = 0.003, DIM: traditional: –0.005 rad/s, C.S.I: –0.002 rad/s), DP roll (P = 0.008, DIM: traditional: –0.09 rad, C.S.I: –0.08 rad) and RMSV roll (P = 0.009, DIM: traditional: –0.003 rad/s, C.S.I: –0.001 rad/s).
A significant increase between static and dynamic visual conditions across groups with no interaction was observed for the following outcomes (reported DIMs are for the increase between static and dynamic visual conditions for vestibular post rehabilitation, Table 3): ML RMSV (P = 0.04, 0.03 cm/s), AP DP (P < 0.001, 3.87 cm) and AP RMSV (P < 0.001, 0.12 cm/s), pitch RMSV (P = 0.014, 0.002 cm/s).
Model estimates and 95% confidence intervals for static and dynamic visual controls, patients pre and patients post
No significant differences were observed comparing the vestibular group post rehabilitation to controls, i.e., following rehabilitation with either intervention the vestibular group was no longer significantly higher than controls on any outcome measure (Table 3, Figs. 3 & 4).

Anterior-posterior (AP) Directional Path (left-hand side, cm). Root Mean Square (RMS) Velocity (right-hand side, cm/s). The groups are displayed on the X axis: healthy controls, participants with vestibular dysfunction pre rehabilitation, participants with vestibular dysfunction post rehabilitation. Each group has estimates and their corresponding 95% confidence intervals per level of visual load (static and dynamic). A significant increase was observed between static and dynamic visual load for all groups. The vestibular group was significantly higher than controls regardless of visual load pre rehabilitation but not post.

Root Mean Square (RMS) Velocity in the medio-lateral direction (ML, cm/s, top left-hand side), Pitch (Radians/s, top right-hand side), Yaw (Radians/s, bottom left-hand side) and Roll (Radians/s, bottom right-hand side). The groups are displayed on the X axis: healthy controls, participants with vestibular dysfunction pre rehabilitation, participants with vestibular dysfunction post rehabilitation. Each group has estimates and their corresponding 95% confidence intervals per level of visual load (static and dynamic). The vestibular group was significantly higher than controls regardless of visual load pre rehabilitation but not post.
Pre rehabilitation, we observed a significant increase between static and dynamic visual conditions across groups with no significant interaction for PSD 1, 2, and 3 (P < 0.001). DIMs for the increase between static and dynamic visual conditions: PSD 1 = 0.082 cm2; PSD 2 = 0.01 cm2; PSD 3 = 0.003cm2.
We observed a significant main effect of group comparing the vestibular group pre rehabilitation to controls (vestibular group was significantly higher) regardless of visual condition for PSD 1 (P = 0.004, DIM on static scene = 0.185 cm2), PSD 2 (P < 0.001, DIM on static scene = 0.03 cm2), and PSD 3 (P = 0.015, DIM on static scene = 0.003 cm2)
There was no main effect of group (Traditional / C.S.I) for any PSD outcome measure and no group by time or group by visual condition 2-way or 3-way interactions. We observed a significant main effect of time for PSD 2 (both interventions groups decreased significantly, P = 0.03, DIM: traditional: –0.016 cm2, C.S.I: –0.015 cm2),)
Post rehabilitation, we observed a significant main effect of group for PSD 2 only (P = 0.049, DIM on static scene = 0.015 cm2). See Fig. 5 andTable 4.
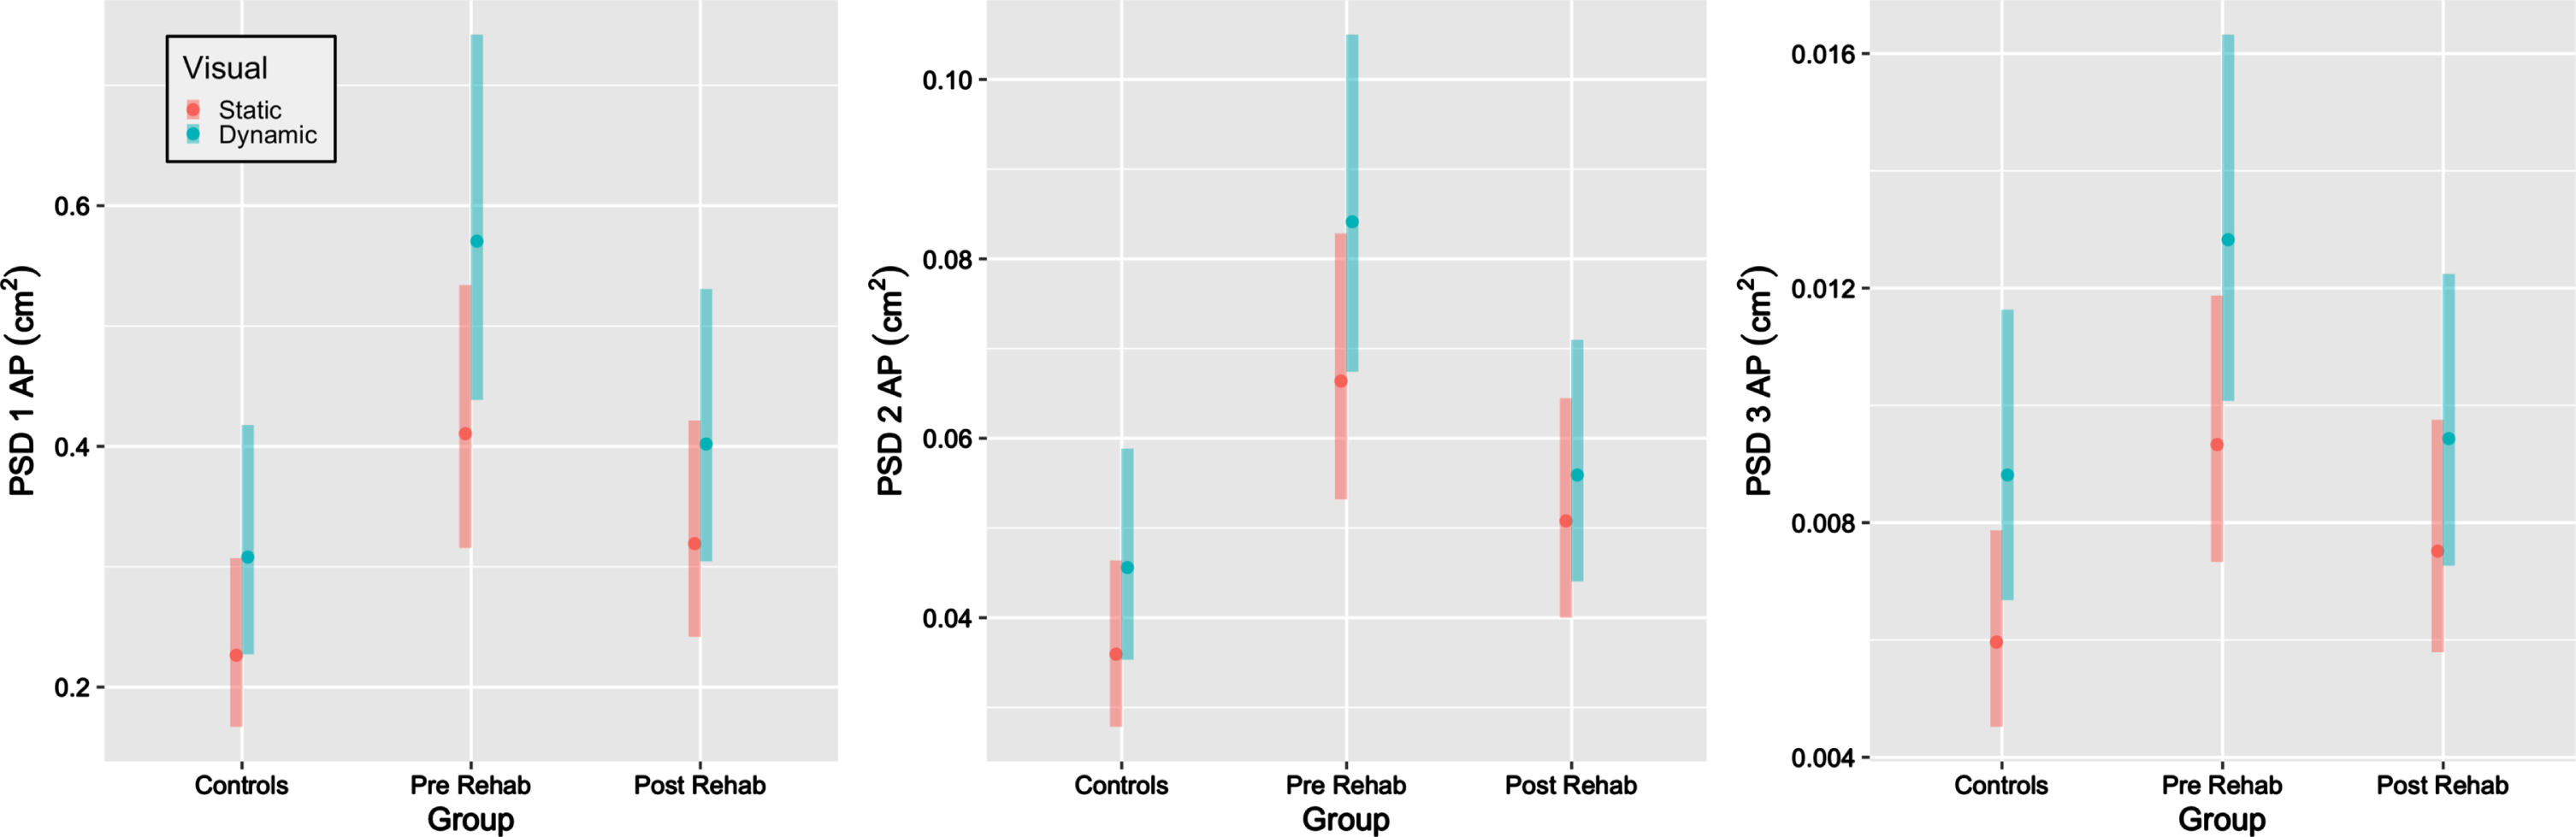
Power Spectral Density (PSD, cm2) in the anterior-posterior direction in low (PSD 1), medium (PSD 2) and high (PSD 3) frequencies. The groups are displayed on the X axis: healthy controls, participants with vestibular dysfunction pre rehabilitation, participants with vestibular dysfunction post rehabilitation. Each group has estimates and their corresponding 95% confidence intervals per level of visual load (static and dynamic). The vestibular group was significantly higher than controls regardless of visual load pre rehabilitation on PSD 1,2 and 3 and post rehabilitation on PSD 2.
Power Spectral Density (PSD): Model estimates and 95% confidence intervals for static and dynamic visual controls, patients pre and patients post
This study investigated whether sensory integration strategies, measured via head sway, changed following vestibular rehabilitation and whether changes depended on the rehabilitation approach taken: traditional vestibular rehabilitation or contextual sensory integration training via HMD. Our key findings were that pre-rehabilitation, participants with vestibular dysfunction moved their head significantly more than healthy, age-matched controls in every measured direction, and that participants showed a significant decrease in head sway following rehabilitation regardless of the intervention applied at a level that was no longer significantly different from controls. In a companion manuscript [20] we observed that other functional outcomes measures (Functional Gait Analysis, Activities Specific Balance Confidence Scale, Dizziness Handicap Inventory) changed in a similar manner to the head outcomes (both groups improved significantly with no main effect of group or time by group interaction) suggesting that head sway provides results consistent with functional improvement.
In contrast to our expectation, that the differences between vestibular participants and controls will be magnified on the dynamic (vs. the static) visual scene, participants pre rehabilitation displayed significantly larger head sway regardless of the visual load. In a prior study, individuals with unilateral peripheral hypofunction increased postural sway with dynamic visual scenes more than age-matched controls, with significant differences when standing on a compliant surface but not on the floor [29]. In another study, differences in head sway emerged between a small sample of participants with vestibular hypofunction and young controls only on the dynamic scene [33]. One difference between the current study and others is that in previous studies people with vestibular dysfunction were recruited at different stages of vestibular rehabilitation or long after completing it [29, 33]. In the current study, however, participants were tested right before beginning a vestibular rehabilitation program and immediately post completion. This suggests that we tested participants at their ‘worst’ and their ‘best’. Our results show that head sway can be reduced following vestibular rehabilitation in the short term to a level similar to healthy controls. This suggests that HMD provide an objective, quantitative assessment of static balance pre and post rehabilitation that cannot be seen with the naked eye. In addition, the perturbations were mild and did not induce more than minimal cybersickness. The participants were standing on the floor, hips-width apart and the assessment was short. Importantly, this instrumented assessment was fully implemented in a clinical setting. Longitudinal follow up studies are needed to evaluate how head sway changes in people with vestibular dysfunction over time and whether this could become a marker for the need for continued rehabilitation.
Head sway was reduced in both treatment groups, but were participants less visually and auditory dependent at the end of the intervention? We did not observe changes in head sway for differences in the rhythmic white noise perturbations we created for this study. It is possible that this specific auditory perturbation, delivered via headphones, did not provide spatial cues to be used as an auditory anchor. Note that these findings should not be generalized to the overall involvement of auditory cues in postural control that has been shown in several other studies [23, 47]. Post rehabilitation, the difference between static and dynamic visual load did not change, but rather the overall amount and velocity of sway decreased. Changes in the C.S.I group that trained in dynamic visual environments were comparable to those observed in the traditional group that trained with eyes closed exercises. While we originally considered the change between static and dynamic conditions as a proxy to visual dependence [7], it is possible that the effect of wearing the headset is stronger than the one of static vs. dynamic stars because transitioning to a completely different visual world is a novel enough sensory experience. In that sense, the overall reduction in head sway could be interpreted as reduced visual dependence [3, 16]. It is also possible that participants achieved compensation and better stability that was not mediated via reduced visual dependence. This possibility is supported by the PSD results. Overall, frequency analysis of head sway showed similar results to traditional measures of sway. Movement in the head in all frequency segments was higher in participants pre rehabilitation than healthy controls and this difference was reduced post rehabilitation regardless of the intervention approach. Based on these results, it appears visual or somatosensory loops did not change, but rather the overall amount of movement was reduced. Interestingly, the only component that remained significantly higher in participants post rehabilitation vs. controls was PSD2. It has been suggested that movement in middle frequencies reflects vestibular dysfunction [9, 25]. While this interpretation is intriguing and consistent with the postural sway literature, we also acknowledge that we used a small sample and given the number of models tested, it is possible that this is a type I error. We therefore suggest interpreting this finding with caution until it is replicated in larger studies.
We expected a unique pattern of pitch, yaw, and roll head sway in response to perturbations not observed in controls that may remain post rehabilitation [26]. However, in the current static balance assessment all 5 directions of sway looked similar with visual influence particularly in the AP plane as expected since the dynamic stimulus is in that plane. Note that participants were asked to look straight ahead and were standing on the floor. It is possible that differences in other head directions (e.g., ML) will emerge when standing on a compliant surface or (e.g., pitch, yaw) in a dynamic postural assessment, such as avoiding a virtual ball thrown towards the participant [27]. From a measurement standpoint, we did not observe meaningful differences in how velocity and path functioned indicating that either one of these metrics could be used in future studies.
Limitations
This study is limited by its small sample size and the immense challenges posed to in-person human motion research, particularly that with a follow up, interventions, and randomization during the covid-19 era. We had to terminate the study mid-way for 6 participants. The original plan was to test participants in the lab twice on a 1-hour assessment prior to commencing rehabilitation using a headset and a force platform. However, research labs were shut down and we decided to test a subset of the protocol in the clinic using the HMD alone. These modifications, however, further support the translation potential of this short (8 minutes and potentially could be shorter), portable, in-clinic assessment. During the in-clinic assessment, participants were standing comfortably hip width apart. This position likely did not change within a session but was not measured and so it is possible that there were slight changes in stance width from pre to post rehabilitation for each individual. Originally, we had planned to recruit chronic vestibular participants only but following the pandemic we opened up recruitment to acute vestibular participants as well. Eventually, however, all but 2 vestibular participants were chronic (3 months or longer) and the result of randomization was that the 2 acute participants (1 month) were evenly distributed between the intervention groups.
Conclusions
Head sway in all directions on both static and dynamic visual scenes decreased following vestibular rehabilitation (either virtual reality C.S.I or traditional training) to a level that was no longer significantly different than healthy age-matched controls. Head sway, derived from HMDs, provides a viable, portable and sensitive assessment of postural control in vestibular disorders that can be conducted in the clinic with affordable, simple equipment. Future studies should investigate longitudinal fluctuations in head sway relative to the patient’s overall condition and functional complaints.
Suppliers
HTC Vive Pro Eye by HTC Vive Virtual Reality was used in this study. This headset is commercially available, and HTC Vive had no involvement in the study.
Source of funding
This study was funded by the National Institutes of Health National Rehabilitation Research Resource to Enhance Clinical Trials (REACT). Drs. Lubetzky, Harel and Cosetti were funded by an R21DC018101 Early Career Researcher grant from the National Institute on Deafness and Other Communication Disorders (NIDCD). The sponsors had no role in the study design, collection, analysis and interpretation of data; in the writing of the manuscript; or in the decision to submit the manuscript for publication. The content is solely the responsibility of the authors and does not necessarily represent the official views of the National Institutes of Health.
Conflicts of interest
The authors declare no conflict of interest. KP reported a research grant from Unity. MC reported unpaid participation in research on cochlear implants and other implantable devices manufactured by Cochlear Americas, MED-El, and Oticon Medical. Neither is related to the submitted work.
Clinical trial registration
This study was registered on clinicaltrials.gov at the following link: http://clinicaltrials.gov/ct2/show/NCT04268745.
Clinical Trial Registration Number: NCT04268745.
The complete dataset is available at
Lubetzky, Anat (2022), “REACT RCT”, Mendeley Data, V2, doi: 10.17632/m78msrfhnj.2 http://data.mendeley.com/datasets/m78msrfhnj.