
Abstract
BACKGROUND:
Individuals after a vestibular schwannoma resection (VSR) experience significant vestibular symptoms that can be provoked with turning. Vestibular rehabilitation assists in recovery of function and symptom relief, however turning response is unknown.
OBJECTIVE:
Examine peak turning speed response to surgery and rehabilitation.
METHODS:
Eight participants with a vestibular schwannoma (PwVS) and five healthy controls (HC) participated in this study. Peak turning speed (PTS) was captured with inertial measurement units (IMU) at the head and/or trunk during turning tasks at a pre-operative, post-operative and post-treatment assessment. Vestibular rehabilitation was provided twice weekly for six weeks. Linear mixed models were used to assess change in PTS across time points.
RESULTS:
PwVS performed slower PTS than HC prior to surgery. PTS was significantly slower post-operatively compared to pre-operative during walking with head turns (B = –61.03, p = 0.004), two-minute walk test (B = –37.33, p = 0.015), 360° turn (B range from 50.05 to –57.4, p < 0.05) and complex turning course (CTC) at the trunk (B = –18.63, p = 0.009). Post-treatment PTS was significantly faster than pre-operative during CTC at the head (B = 18.46, p = 0.014) and trunk (B = 15.99, p = 0.023).
CONCLUSION:
PwVS may have turning deficits prior to surgical resection. PTS was significantly affected post-operatively, however improved with rehabilitation.
Introduction
Vestibular schwannoma (VS) is a benign, slow-growing tumor on the 8th cranial nerve [5]. Following surgical excision, patients often report dizziness, oscillopsia, and imbalance due to the acute asymmetry of vestibular output resulting from damage to the vestibular nerve during removal of the tumor [11]. This vestibular deficit can lead to a fear of falling and decreased overall mobility for patients. Based on the American Physical Therapy Association’s (APTA) Clinical Practice Guideline (CPG) for vestibular hypofunction, there is strong evidence in support of vestibular rehabilitation for acute vestibular hypofunction to improve balance function, symptom complaints and quality of life [6]. The CPG defines vestibular rehabilitation as a therapeutic approach that includes but is not limited to exercises targeted at gaze stabilization, static and dynamic balance, as well as habituation of dizziness. Because of their dizziness, and unsteadiness symptoms, active rotational motion of the head and trunk are impaired in this population [12, 19]. While head and trunk rotation are important components of mobility in daily life and important drivers of compensation of the vestibular system, tracking improvement of head and trunk turning is difficult with traditional clinical assessments; assessments of turning requiring head and trunk rotation are not established, but needed in this population.
Turning comprises one third of the steps taken throughout the day [4] and is a complex movement requiring precise intersegmental coordination for smooth execution [1, 31]. Turning is often affected in clinical diagnoses with postural deficits such as patients after a vestibular schwannoma resection(VSR) [8, 26]. Following VSR, patients tend to ambulate with less postural control [12] and turn slower and less often [19]. However, gait speed is preserved compared to age-matched healthy controls [18]. The discrepancy between gait speed and turning characteristics in this population provides an impetus to examine the turning behaviors in individuals with vestibulopathies and to what degree they recover with rehabilitation. One study [8] has found an improvement in turn performance during the Timed Up and Go (TUG) in patients recovering from VSR, however these patients still took significantly more steps to complete their turns compared to healthy controls. The TUG includes a 180° turn and therefore, we cannot determine if larger or smaller turns would show similar improvement during the recovery from VSR. A range of turn angles would better represent the variety of turns taken throughout the day. Furthermore, without baseline pre-surgical TUG performance, we cannot determine if these patients returned to their pre-surgical turning performance.
Peak turning speed is an essential turning characteristic that contributes significantly to quantifying the quality of turning performance. Unlike turn quantity, turn quality holds substantial value in assessing fall risk within clinical populations [14]. We selected peak turning speed as our primary outcome of interest due to its established reliability [18] and ability to discern differences between a healthy cohort and those affected by vestibular pathology [18, 29].
The purpose of this study was to describe the effects of VSR and vestibular rehabilitation on peak turning speed (PTS) of the head and trunk during a range of turning tasks. In addition to comparing cohorts using inferential statistics, we chose to report the specific characteristics of individual participants over time, therefore providing greater insight regarding individual within-participant changes. We expected participants with a vestibular schwannoma (PwVS) to have a pre-surgical deficit in turning speed compared to the range of performance of healthy controls. In addition, we expected there would be a reduction in PTS at the head and trunk post-operatively compared to pre-operative assessment. Lastly, we expected PwVS to improve with vestibular rehabilitation yet still demonstrate reduced performance relative to the range of performance of healthy controls.
Methods
Data from 8 PwVS were pulled for this analysis from a planned larger study (Clinical trials.gov #NCT04594057) that was disrupted by the emergence of the COVID-19 pandemic. The participants selected for this analysis completed three time point assessments: pre-surgery, post-surgery (within 2weeks of surgery), and post-treatment (after 6 weeks of vestibular rehabilitation). Inclusion criteria for this study required participants to be between the ages of 18-85, have received a diagnosis of VS by a neurologist and scheduled for surgical resection. Exclusion criteria included any other central or peripheral nervous system diagnosis, orthopedic, neurologic, or cognitive comorbidities that would affect participation in gait and balance assessment or vestibular rehabilitation, blindness or internuclear ophthalmoplegia, unable to tolerate up to 5 minutes of continuous head movement. Five vestibular healthy, age-matched participants were also selected for comparison. Participants provided written consent prior to data collection. This study was approved by the University of Utah Institutional Review Board (IRB# 00125069).
Participant demographic and diagnostic information collected at pre-operative assessment included age, sex, height, weight, side of VS, and duration of symptoms. At each assessment, participants completed the Dizziness Handicap Inventory (DHI), Activity-Specific Balance Confidence Scale (ABC), video Head Impulse Test (vHIT), and a series of turning tasks while wearing inertial measurement units (APDM Inc., Portland, OR, USA). The DHI and ABC are reliable and responsive questionnaires used to assess the severity of dizziness and unsteadiness and balance confidence [7, 21]. Scores on the DHI range from 0-100, with a higher score representing more severe disability. Scores on the ABC are reported as a percentage, however, a higher ABC score represents more balance confidence. Gaze stability metrics (vestibulo-ocular reflex (VOR) gain, compensatory saccades latency) were measured using vHIT goggles (GN Otometrics, Denmark). This method has been validated in people with vestibular deficits [13, 27].
After calculating the large effect sizes derived from Paul et al. [18] utilizing TUG turning speed acquired from a vestibular hypofunction cohort and healthy control group, a power analysis was conducted. A total sample size of 6 participants was determined to be sufficient to attain a statistical power of 95%.
Turning tasks
The suite of turning tasks chosen for this analysis were selected because they represented a range of head and trunk turning demands spanning independent head-on-body turns to sequenced and coordinated head-and-body reorientations that would be present during mobility in every-day life. The tasks included: Walking with Horizontal Head Turns, Two-Minute Walk Test (2 MW), 360° turn test, and complex turning course (CTC).
Walking with horizontal head turns
Taken from the Functional Gait Assessment (FGA) [32], this task (Item 3 from the FGA) instructs participants to walk at a comfortable pace along a 20 ft path and when directed, dissociate their head from their trunk by turning their head to the left or right while continuing to walk straight. Participants maintain their head turned until instructed to turn their head in the opposite direction. Two horizontal head turns in each direction were performed during this task.
Two minute walk test
The 2 MW is a reliable test used to measure functional mobility [2]. Participants are instructed to walk along an 82 ft pathway, turning 180° at a tape marking at both ends, and cover as much distance as they can in two minutes.
360° turn test
The 360° turn test is a test of dynamic balance and has been validated in people with Parkinson’s (PwPD), patients post-stroke and people with multiple sclerosis [22–24]. For the 360° turn test, participants begin in a standing position and when instructed, perform a 360° turn and stop. The test is repeated in the opposite direction.
Complex turning course
The CTC is a walking course designed to mimic turn angles (45°, 90°, and 135°) performed throughout daily life and has been used in previous studies assessing turning [17]. Participants performed five laps of the CTC at a comfortable walking pace.
Vestibular rehabilitation
Vestibular rehabilitation was initiated after participant’s post-surgical assessment and consisted of twice weekly in-person physical therapy for a six-week period. Treatment sessions were scheduled for 45 minutes and included gaze stability exercises, static and dynamic balance exercises consistent with recommendations made in the CPG for vestibular hypofunction [6]. Each week progressions to their treatment program were made based on participant’s subjective reports of symptoms during exercises and by researchers’ observation of performance. Participants were given a home exercise program (HEP) to be performed 3 times per day on the days they did not attend in-clinic sessions. HEP included one gaze stability exercise, one static balance and one dynamic balance exercise. At-home sessions were monitored with weekly exercise flow sheets.
Outcomes and data acquisition
Average PTS was the primary outcome of interest in these turning tasks. PTS has demonstrated sensitivity in discerning between populations with postural instability [4, 25] and healthy controls and between and fallers and non-fallers [14]. Turns of interest were: head turns during the walking with head turns, 180° body turns during the 2 MW, head and body turns during the 360° turn and 45°, 90°, 135° turns at the head and body during the CTC. To capture PTS, data were collected simultaneously by two Opal inertial measurement units (IMUs; APDM Wearable Technologies, a Clario company, Portland, OR) at the forehead and sternum during turning tasks. After data collection, angular motion data for the transverse plane movements was exported and processed using custom MATLAB (Mathworks, Natick, MA, USA) algorithms. Yaw angular velocity data extracted from walking with head turns, 2 MW, and 360° turn were filtered using a 2nd order, 6 Hz Butterworth filter. CTC yaw angular velocity data were filtered using 4th order, 0.5 and 1.5 Butterworth filters.
Walking head turns processing
For walking with head turns, data processing involved identifying whether the peaks in the angular rotation data constituted a turn. To identify which peak corresponded with a turn, the mean amplitude of peaks with an angular velocity greater than 100°/s was calculated. Then, if a peak was greater than 35% of the calculated mean peak amplitude, it was considered a turn for that participant. Once individual turns were identified, the direction and velocity were gathered for each head turn. Given the instructions of the task, face validity was confirmed by identifying the expected two left head turns and two right head turns in each trial. The absolute values of each head turn’s velocity were calculated, and the overall mean was calculated to represent the average peak velocity of head turns occurring for each participant during the walking with head turns task.
2 MW turn processing
For 2 MW, peaks were selected from the sternum gyroscope data that corresponded to the subject turning around at the end of the walking path. The total number of turns (N) was manually input by the researcher and the script found the N largest amplitude peaks in the sternum gyroscope data. In some instances, there were irregular movements that were initially counted as a turn. In this case, the user was able to select turns that should not be included and the script found the next largest turn. The absolute values of each turn’s velocity were calculated, and the overall mean was calculated to represent the average peak speed of trunk turns occurring for each 2 MW trial.
360° turn processing
Only one peak, or turn, should occur during the 360° turn test. Therefore, the largest peaks in the head and sternum gyroscope data were identified, and the corresponding angular velocity and direction of turn were gathered. The direction of the 360° turning task was reported as a turn towards the lesion or turn away from the lesion depending on each participant.
CTC turn processing
To identify laps during the CTC trials, data were filtered using a 4th order, 0.5 Hz low pass Butterworth filter and yaw angular velocity was integrated to generate angular displacement. A 15° change in displacement to the left marked the beginning of a lap and lap completion was determined by a 200° change in displacement. Each lap was matched with an algorithm template to identify the peaks that occurred during the course. The algorithm and template used to analyze turns in the CTC was created using healthy control participants [17]. A 4th order, 1.5 Hz low-pass Butterworth filter was then applied to the yaw turning velocity data to determine the turning speed. With the exception of the first and last lap, peak turning velocity was taken for the 45°, 90°, and 135° turns in each completed lap. The absolute values of the turning velocities for each turn angle were averaged to provide an average peak turning speed for 45°, 90°, and 135° turns.
Summary of participant performance
Descriptive data (mean and confidence intervals) of PTS at the head and trunk were calculated for each task at each time point. Similarly, descriptive data of the participants’ vestibular rehabilitation performance was reported. Individual participant trajectories on each of the turning tasks are graphically presented. The 95% confidence interval around mean turning speed collected from our healthy controls was calculated and reported. Percent change of PTS for each participant at the post-operative and the post-treatment assessment from the previous time point assessment is reported in the Supplemental Material, Table A and B. To assess whether PTS differed between time point assessments, linear mixed models were fit for each outcome with a random intercept for each subject. For the CTC task, turn angle was controlled for in the linear mixed model. Significance was set at p < 0.05.
Results
Demographic characteristics of the 8 participants and their surgical and study assessment timelines are listed in Table 1. VSR19 did not perform vHIT testing post-surgery as they wore a protective eye shield due to facial nerve palsy. Table 2 presents the average PTS calculated from each task during the three assessments timepoints. A summary of vestibular rehabilitation performed by participants is provided in Table 3. Although the treatment goal for this study was to provide 12 sessions of vestibular rehabilitation, 2 participants did not receive all treatments. VSR2’s treatment timeline was cut short due to the emergence of the COVID-19 pandemic. VSR14 performed 8 sessions of vestibular rehabilitation prior to the 6-week follow-up assessment and subsequently leaving the area. The results of the mixed linear models are reported in Table 4. Figures 1–3 display the PTS (°/s) each participant achieved during the task at each assessment. VSR08 did not perform the CTC trial during the pre-operative assessment. Therefore, CTC was left out of the data collection at follow-up assessments.
Demographic characteristics of study participants
Demographic characteristics of study participants
*Percent change was relative to the previous time-point assessment. DoS = date of surgery, negative numbers indicated days prior to surgery and positive numbers indicated days after surgery; VS = vestibular schwannoma; vHIT = horizontal video head impulse test; gain is calculated as eye velocity/ head velocity; DHI = dizziness handicap inventory, scale ranges from 0-100% with higher percent represents greater symptoms; pre = pre-surgical; postop = post-operative; posttx = post-treatment; na = not available.
Mean and confidence intervals of peak turning speed for participants at each time point assessment
2MW = two minute walk, CTC = complex turning course, CI = confidence interval. *indicated turns toward the side of the lesion; + indicated turns away from the side of the lesion.
Summary of vestibular rehabilitation performed by participants
All values, unless otherwise indicated, are mean/standard deviation. VOR = vestibulo-ocular reflex; bpm = beats per minute.
Beta coefficients, 95% confidence intervals, and p values from mixed linear models for peak turning velocities (°/s)
Pre-operative assessment and 45° angle are the reference group. HHT = horizontal head turns; 2MW=two-minute walk test; CTC = complex turning course; B = beta coefficient; SE = standard error CI = confidence interval.
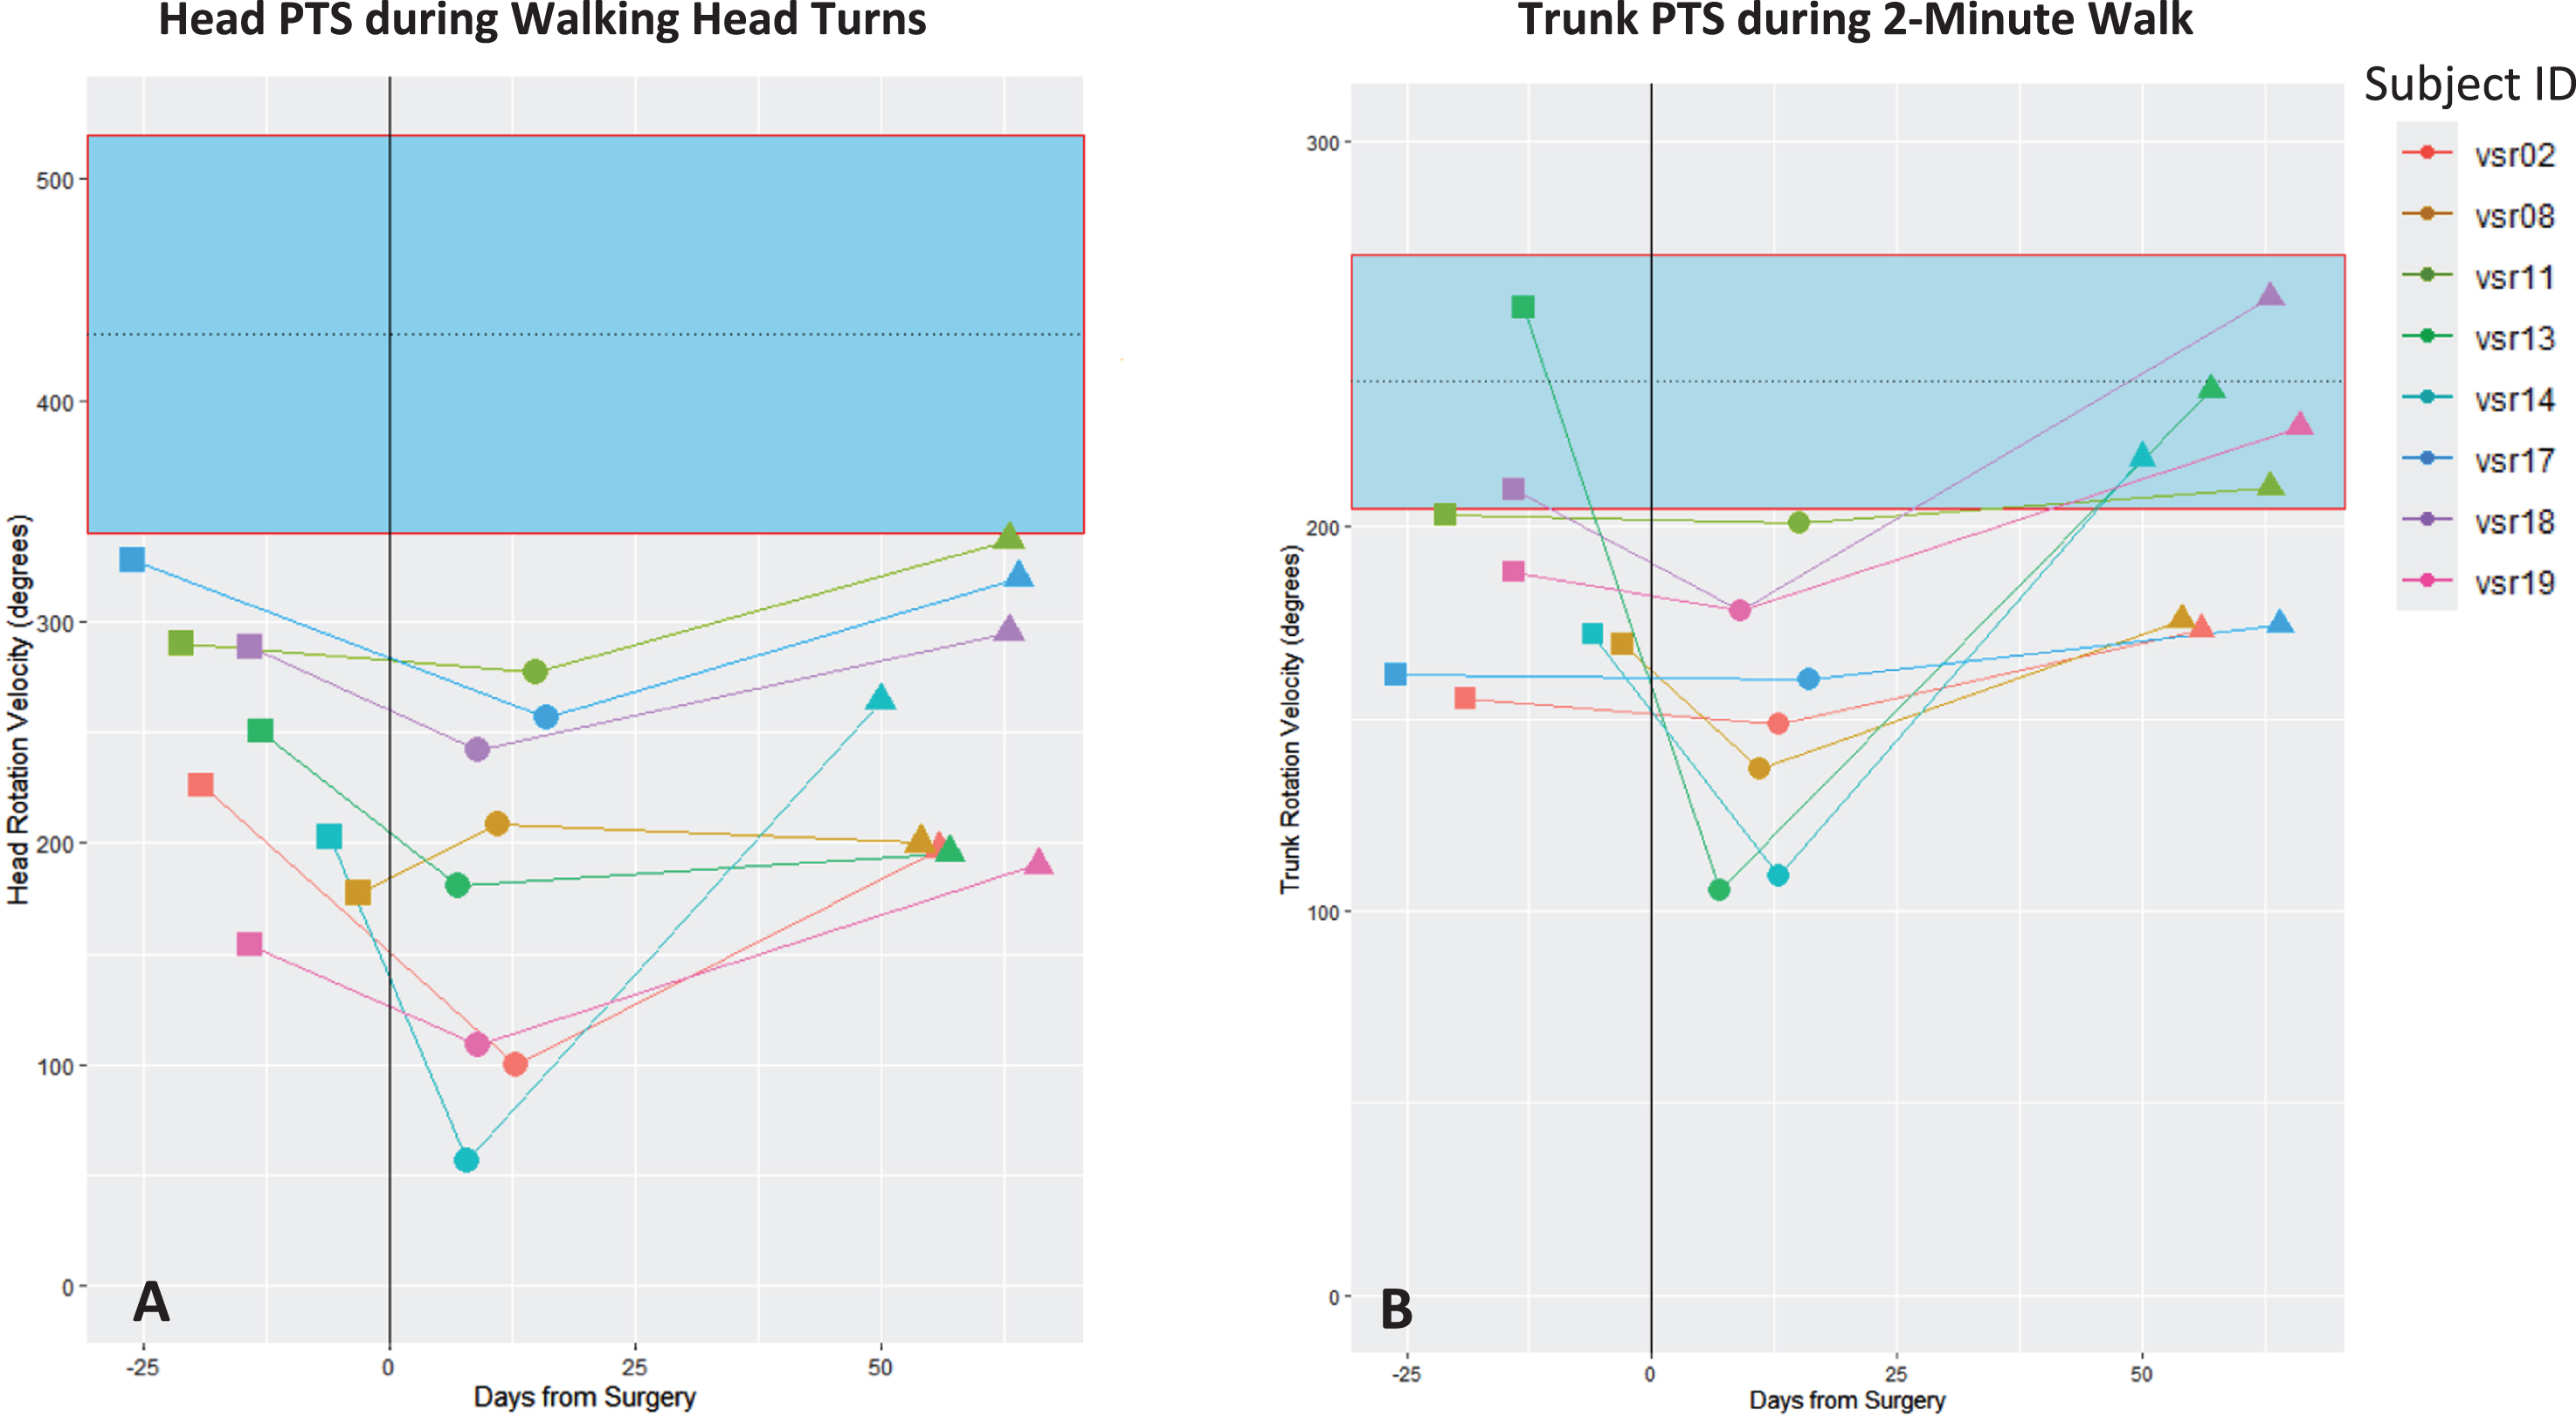
A-B. Peak turning speed (PTS) at the head during walking with head turns (1A) and at the trunk PTS during two-minute walk (1B). Solid black vertical line represents date of surgery. The dashed horizontal line represents the mean PTS of the healthy control and the 95% confidence interval of the healthy controls is represented by the blue band. Mean head PTS of healthy controls during walking with head turns was 351.85. Mean head PTS of healthy controls during two-minute walk was 237.56. Timepoint assessments: ■ pre-operative, •post-operative, ▴ post-treatment.
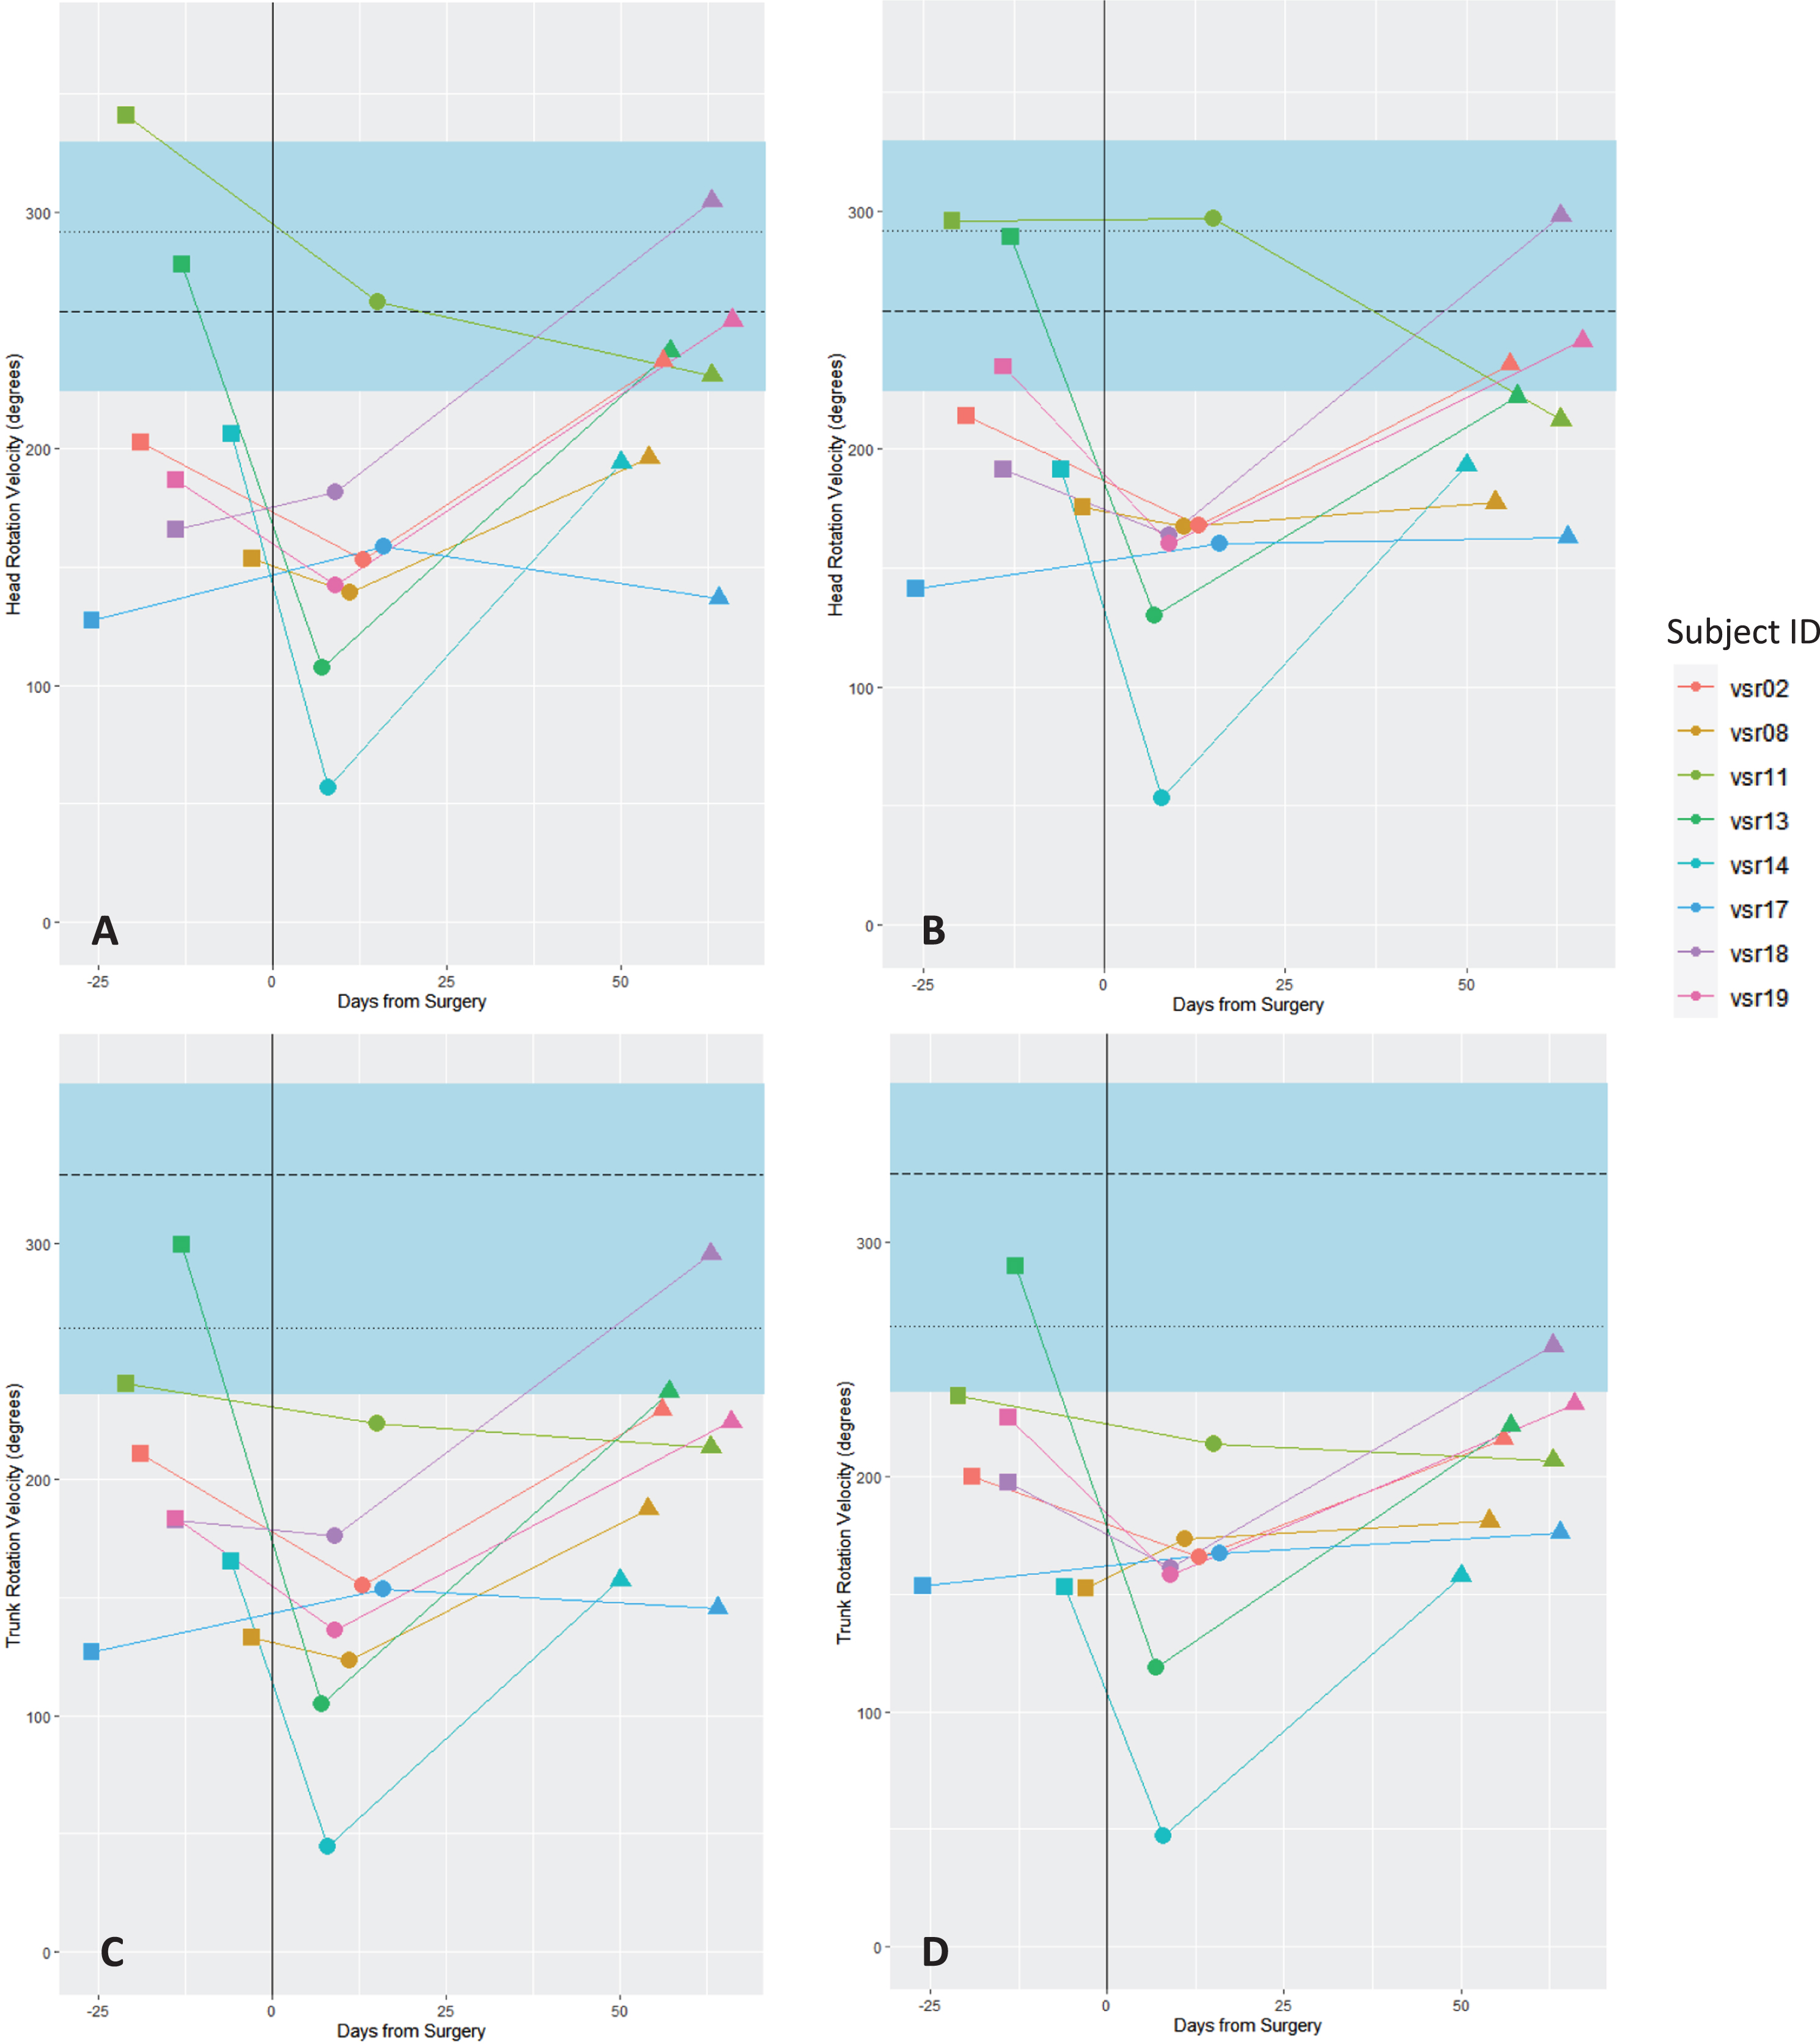
A-D. Peak turning speed (PTS)at the head (2A) and trunk (2 C) during 360° turns toward the side of the lesion and PTS at the head (2B) and trunk (2D) during 360° turns away from the side of the lesion. Solid black vertical line represents date of surgery. The dashed horizontal lines represents the mean PTS of the healthy controls (HC) and the 95% confidence interval is represented by the blue band. Mean head PTS of HC during 360° turns to the right: 292.03, left: 257.71. Mean trunk PTS of HC during 360° turns to the right: 263.85, left: 328.66. Timepoint assessments: ■ pre-operative, •post-operative, ▴ post-treatment.
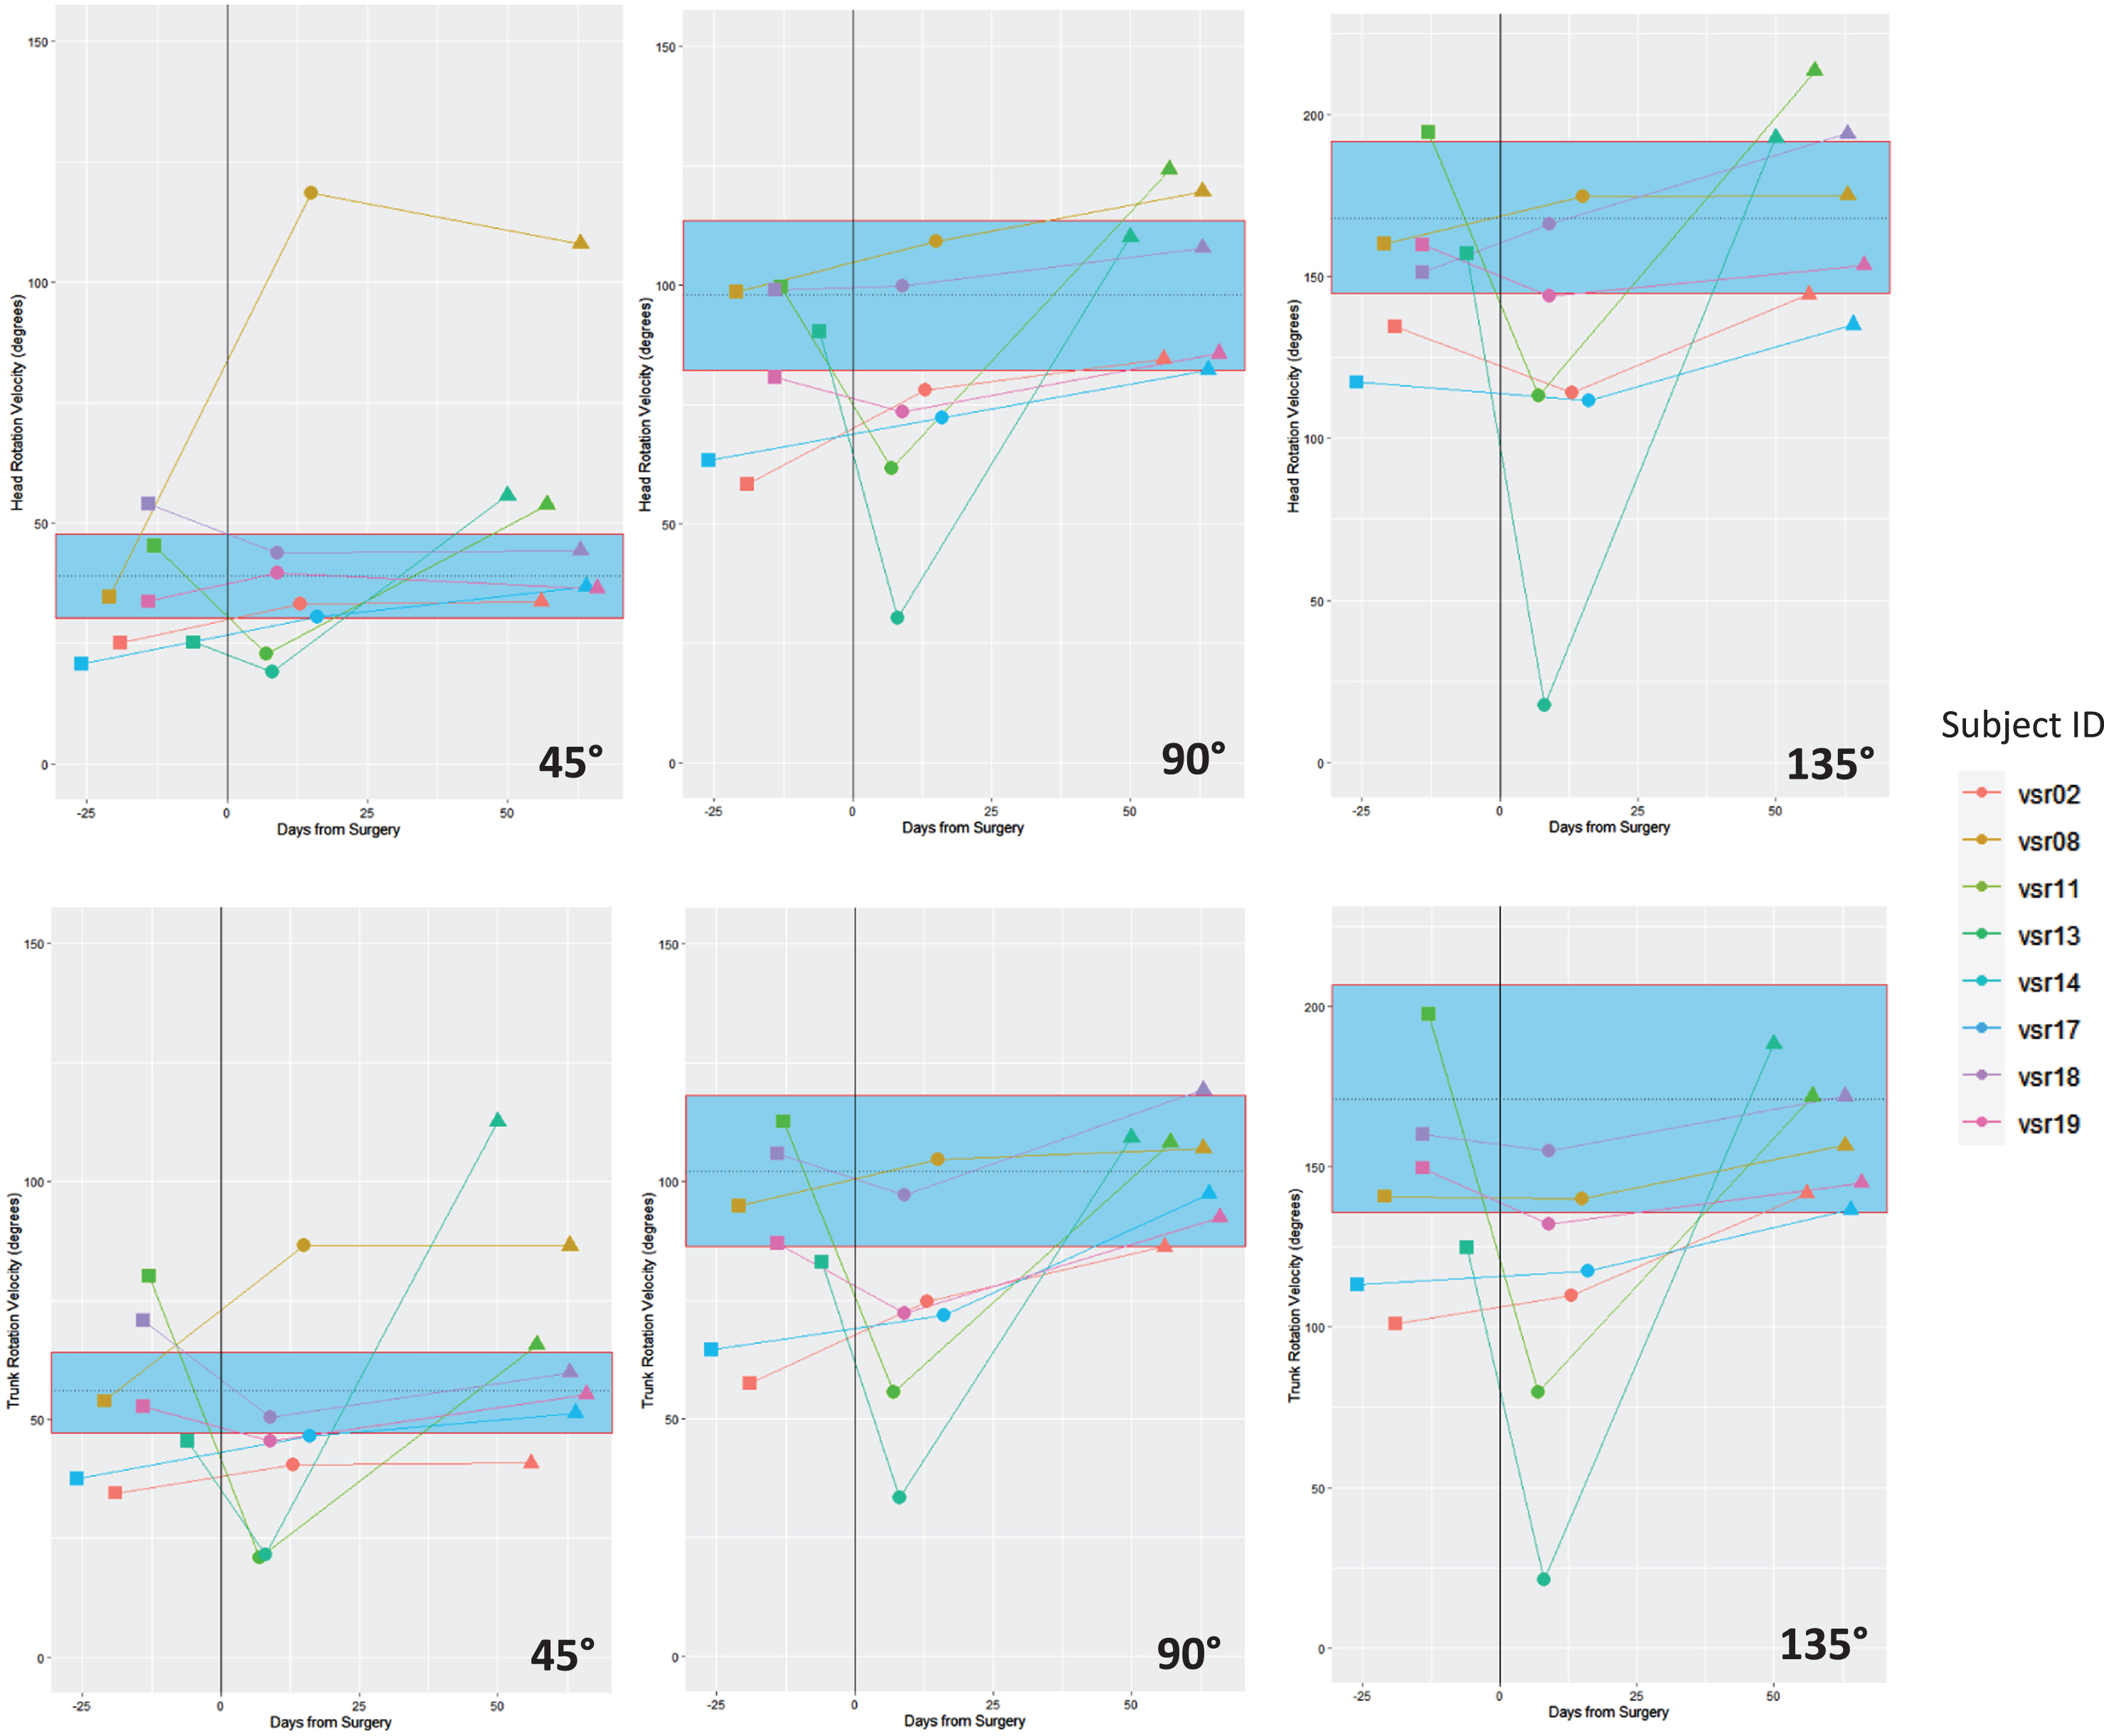
Peak turning speed (PTS) at the head (top row) and trunk (bottom row) during the 45°, 90°, and 135° turns of the complex turning course (CTC). Solid black vertical line represents date of surgery. The dashed horizontal line represents the mean PTS of the healthy controls (HC) and the 95% confidence interval is represented by the blue band. Mean head PTS of HC during CTC for 45° turns was 38.93, for 90° turns was 97.90 and for 135° turns was 168.31. Mean trunk PTS of HC during CTC for 45° turns was 55.61, for 90° turns was 102.26 and for 135° turns was 171.17. Timepoint assessments: ■ pre-operative, •post-operative, ▴ post-treatment.
During walking with head turns, 2 MW and 360° turn, we found that the majority (6/8 for 2 MW and 5/8 for 360° turn) of the VS group performed turning tasks with a slower PTS prior to surgery compared to healthy controls. This pre-operative PTS deficit was not as evident in the VS group during the CTC. Additionally, the VS group demonstrate a slight reduction in VOR function on the lesion side compared to the non-lesion side (average VOR gain 0.89 and 1.00 respectively).
Post-operative assessment
PTS was significantly slower at the post-operative assessment compared to the pre-operative assessment during walking with head turns (B=-61.03, p = 0.004), 2 MW (B=-37.33, p = 0.015), 360° turns (B coefficients range from -50.05 to -57.4, p-values range from 0.009 to 0.027) and CTC at the trunk (B=-18.63, p = 0.009). No difference was found between pre-operative and post-operative PTS at the head during the CTC when controlling for turning angles. The average reduction in PTS at the post-operative assessment compared to the pre-operative assessment was 26.30% for walking with head turns (PTS at the head), 17.68% for 2 MW (PTS at the trunk), and ranged from 22.45-23.37% for 360° turn (PTS at the head and trunk). Although not as evident as the former tasks, there was still an overall decrease in PTS during the CTC at the post-operative assessment compared to pre-operative assessment. Reduction in head PTS was 7.76% and 20.18% for 90° and 135° turns and trunk PTS ranged from 9.61% to 20.82% for all turn angles. There was a 35.19% increase in PTS at the head and a 9.61% decrease at the trunk for 45° turns during the CTC. A reduction in vestibulo-ocular reflex gain collected using vHIT was also present at the post-operative assessment, with a reduction of 50.26% on the surgical side and 12.49% on the non-surgical side compared to pre-operative results.
Post-treatment assessment
There was a significant increase in PTS at the post-treatment assessment compared to the pre-operative assessment at both the head (p = 0.014) and trunk (p = 0.023) during the CTC when controlling for the turning angles. No difference was found between pre-operative and post-treatment PTS during walking with head turns, 2 MW, and 360° turns. Significant differences between pre-operative and post-treatment assessment were found in the CTC at both the head (p = 0.014) and trunk (p = 0.023) when controlling for turning angle. vHIT results at the post-treatment assessments showed an improvement compared to post-operative assessment, with an average improvement of 65.79% on the surgical side and 8.59% on the non-surgical side.
Discussion
This study sought to describe the pre-operative performance and recovery trajectories of ecologically valid head and trunk turning behaviors by providing detail on individuals that underwent surgical resection of a VS followed by vestibular rehabilitation. When assessed using a suite of head-specific and whole-body turning tasks, several themes emerged from the individual participant’s performance: 1) pre-operative deficits in PTS exist relative to healthy controls; 2) VSR induces substantial reductions in PTS at the head and trunk after surgery compared to pre-surgery; 3) PTS improves following rehabilitation compared to the post-surgery assessment, however, post-rehabilitation, PwVS demonstrated persistent PTS deficits relative to healthy controls on most turning tasks.
Possible pre-surgical deficits
A slower PTS compared to vestibular healthy individuals prior to schwannoma resection could indicate a turning deficit caused by the presence of a vestibular schwannoma. Dynamic gait and turning deficits are not common complaints of patients newly diagnosed with a vestibular schwannoma [5]. Its slow growth allows for adaptation in response to changes from vestibular input and therefore patients may not see a sudden onset of symptoms early on. However, our PwVS reported elevated DHI scores compared to our healthy controls suggesting mild to moderate handicapping effects of dizziness prior to surgery. Dizziness might contribute to the reduction in PTS. PTS during walking with head turns showed the largest discrepancy between the PwVS participants and the healthy control average. This was the only task performed in this study that requires the dissociation of head and trunk. Such results may indicate that PTS of yaw plane head rotations during gait may be sensitive to pre-surgical alterations in vestibular function. Similar alterations have been reported by Wang et al., in which altered kinematics of head movement were observed during the FGA in a sample of individuals prior to VSR [26].
Sensitivity of tasks to surgical procedure
We expected a drastic decrease in turning speed after surgery due to the abrupt change to the vestibular output. We saw a significant decrease in PTS during the 2 MW (p = 0.015), walking with head turns (p = 0.004), 360° turns (p values range from 0.009 to 0.027) and CTC at the trunk (p = 0.009). However, changes in PTS at the head during the CTC did not appear to respond to surgical status. Instead, the CTC PTS appeared to be sensitive to the differences between the individuals. Across our sample there was a reduction in PTS during the CTC, however if a participant generated relatively high PTS at the head during the post-operative CTC, the trunk PTS was similarly fast. Additionally, the turning speed across the difference turn angles were similar relative to the healthy control turning speed confidence intervals. If a participant turned relatively slow during 45° turns compared to the healthy control average, then they likely turned slow at the 90° and 135° turns. The average post-operative DHI score of 63.5 indicates a high level of handicap due to dizziness [30]. The alteration in vestibular input, affecting dynamic gaze stability, and an increase in dizziness likely contributed to the reduction in turning speed [20] however slower turning speed was more pronounced in some turning tasks (walking with head turns, 2 MW, 360° turn test).
Response to vestibular rehabilitation/evidence of recovery of turning
Vestibular rehabilitation is aimed at recruiting the vestibular system into adapting and compensating for the asymmetrical vestibular output [6, 10] and should focus on static and dynamic stability and gaze stability exercises [6]. As hypothesized, turning performance at the post-treatment assessments show a marked improvement of PTS compared to the post-operative assessment and the majority of participants performed turns at speeds comparable to their pre-surgery state. However, PTS generated by most of the participants during these turning tasks (walking with head turns, 360° turns and 2 MW) at the post-treatment assessment remained slower than average PTS generated by healthy controls. Although improved, the average DHI score was 30.75 at post-treatment assessment. This suggests continued dizziness symptoms which may contribute to the persistent slower turning speeds.
The improved turning speed, gaze stability and dizziness symptoms demonstrated by our participants are consistent with the recovery of turning in patients after VSR described previously [8]. Although they did not report turning speed, Kim et al [8] observed a decrease in the time spent in turning in relation to time spent walking during the 180° turn in the TUG after rehabilitation. Our results expand and strengthen the evidence base that recovery of turning speed after rehabilitation occurs across multiple turning angles and multiple tasks.
Limitations and directions for future research
By design, this study reports on the individual data of a small sample of patients with VSR and therefore the variability of each person’s recovery is apparent. Such a design capitalizes on the data available for individual participants and provides specific insights into the trajectory of recovery of turning behaviors that would not be available in a cohort design. We acknowledge that this presentation was dictated by the difficulties we experienced conducting a prospective study during the COVID-19 pandemic in a population undergoing what was considered a non-emergent surgery.
While we presented values for PTS relative to a group of vestibular healthy controls, normative values for PTS on the turning tasks utilized have yet to be established. Although we provided control values for reference, no statistical comparisons of our PwVS to our healthy controls was performed. Additionally, without longer-term follow-ups, the long-term effects of VSR and the persistence of turning deficits following rehabilitation are unclear.
Our study design only allowed the observation of the recovery trajectories of individuals who underwent rehabilitation and prevents a comparison to the recovery of untreated individuals. Future case series should observe the recovery of head-trunk kinematics during turning tasks after a VSR without vestibular rehabilitation. Such a design would allow for greater insight into the natural history of turning behaviors following the onset of vestibular hypofunction and the influence of vestibular rehabilitation on individuals’ post-operative recovery trajectories of turning behaviors. In addition, study designs examining head and trunk turning outcomes with greater controls for threats to internal validity (i.e. prospective cohort studies and randomized clinical trials) are warranted to determine if more focused rehabilitation may aid in recovery of turning tasks that remained impaired in our study. Exploring additional turning metrics that evaluate the quality of turning performance, such as turn duration, throughout the phases of recovery, is needed for a comprehensive understanding of turning in clinical populations. Lastly, this report focused solely on yaw plane rotations, leaving investigations of the effect of VSR on pitch and roll plane motion to future studies.
Conclusion
This study examined a variety of turning tasks in a population with a known vestibular loss to better understand change in performance as a result of surgery and recovery with vestibular rehabilitation. Although impaired dynamic stability is not commonly reported pre-surgically, PwVS performed turning tasks with a slower turning speed compared to healthy controls. In addition to the postural deficits and vestibular symptoms that arise from the VSR, patients also had profound difficulty in turning which resulted in a slower turning speed. Turning speed recovered across different turning angles and turning tasks after vestibular rehabilitation however, in this sample, turning deficits persisted.