
Abstract
Many people share their daily events and opinions on Twitter. Some tweets are beneficial and others are related to such aspects of a user’s real-life as eating, traffic conditions, and weather. In this paper, we propose an inference method of the real-life aspect distribution of tweets using labeled tweets. Our method infers the aspect probability distributions by a hierarchical estimation framework (HEF), which is hierarchically composed of both unsupervised and supervised machine learning methods. In the first phase, it extracts topics from a sea of tweets using Latent Dirichlet Allocation (LDA). In the second phase, it builds associations between topics and real-life aspects using a small set of labeled tweets. The probability distribution of aspects is inferred using the associations based on the bag of terms extracted from unknown tweets. Our sophisticated experimental evaluations with a large amount of actual tweets demonstrate the high efficiency and robustness of our inference method. Especially in the case of single-label training, HEF showed significantly lower JSD values than other baseline methods, such as Naive Bayes, SVM, and L-LDA.
Introduction
Twitter,1
Thus, Twitter posts are often both useful and timely because they typically discuss current events. For example, tweets about traffic jams or traffic accidents are quite valuable for users who will pass those places. Supermarket sales and bargain information are also helpful for neighborhood consumers. Such tweets, which are highly regional, up-to-date, and beneficial to others, are called
Aspects of real life
The Great East Japan Earthquake Disaster, which occurred in March, 2011,3
Depending on the tweet, we might have to designate several aspects per tweet. For example, a tweet such as “A heavy snowstorm caused a traffic accident near the JFK airport” mentions heavy snowfall and a traffic accident. Its main topic is the traffic accident, but it also provides weather information. Therefore, we label it as both Traffic and Weather. In our previous research, we proposed a hierarchical estimation framework (
An approach that estimates several aspects of a tweet can clearly provide real-life information for specific users. On the other hand, exhaustive-oriented users might expect broad information that includes the specific aspects. In other words, accuracy-oriented users might desire strictly selected real-life information on specific aspects. When we visit sightseeing locations, for example, we want information about them. Multi-label classification methods [29] failed to achieve such tightly associated aspects with the same weight.
In this paper, we propose an inference method of the real-life aspect distribution of tweets. The aspect distribution is represented by the probability distribution in each tweet. Accurately inferring the probability distribution of the aspects means supporting either the strict or broad associations between tweets and aspects. As an inference method of probability distribution, we extend HEF, which is composed of both unsupervised and supervised machine learning techniques. In the first phase, it extracts topics from a sea of tweets using Latent Dirichlet Allocation (LDA). In the second phase, it calculates the relevance scores between topics and aspects using a small set of labeled tweets to build associations among them. Aspect scores for unknown tweets are calculated using the associations between topics and aspects based on the terms extracted from them. As the most important feature in this paper, we propose an optimal association building method based on t-test, which is an efficient strategy to manage the relationships between topics and aspects. In this paper, we assume that the training data are not given as the probability distributions of the aspects based on a training model of a typical classification method. Our challenge is to train from labeled tweets and infer the probability distribution of the aspects of unknown tweets based on a natural extension of HEF.
The reminder of our paper is organized as follows. In Section 2, related works are discussed. In Section 3, we explain the details of the extended HEF mechanism that infers the probability distribution of aspects. In Section 4, the experimental evaluations for inferring the probability distributions are described, including JS divergence and Euclidean distance. In Section 5, we discuss the effectiveness of our inference method. We conclude the paper and briefly describe future works in Section 6.
Information extraction from Twitter
The study of information extraction from Twitter is flourishing. Sakaki et al. [19] assumed that Twitter users act as sensors that discover an event occurring in real time in the real world. Mathioudakis et al. [13] extracted burst keywords in automatically collected tweets and found trends that fluctuated in real time by creating groups using the co-occurrence of keywords. Zhao et al. [32] extracted tweets about information needs using a Support Vector Machine (SVM) to discover real-world trends and events. Wang et al. [24] estimated user interests using posted tweets to discover effective users for tweet diffusion. Rajadesingan et al. [16] detected the sarcasm on Twitter to help improve the company’s customer services. They introduced psychological studies and sentiment score of term into the modeling framework to discover the sarcasm. Bollen et al. [12] analyzed sentiment on Twitter based on a six-dimensional mood (tension, depression, anger, vigor, fatigue, and confusion) representation, and determined that on Twitter, it correlates with such real-world values as stock prices and coincides with cultural events. In this paper, we infer the real-life aspect distribution on unknown tweets.
Extracting information related to user’s life
Many studies have extracted beneficial information for the lives of users. Extracting traffic information from social media has been particularly widely studied. Sakaki et al. [20] extracted real-time driving information from social media to provide current traffic situations to users. Their system incorporated geographically related terms into geographical coordinates. When the number of tweets satisfying their three defined rules exceeded their threshold, they judged that a target railway was running late. Aramaki et al. [1] predicted influenza epidemics using Twitter. They extracted tweets related to influenza based on an SVM modeled by tweets that literally mention influenza patients. Ishino et al. [9] extracted both information on souvenir and tourist spots as travel information from travel blog entries. Moreover, they built a collection of travel information links by extracting hyperlinks from travel blog entries.
Although these studies extract beneficial information in particular life aspects, our research concurrently estimates several aspects of unknown tweets based on probability distribution.
Topic model
Topic model studies widely use LDA [2], which is a latent topic extracting method devised for a probability topic model. LDA supposes that a document has a mixture distribution of plural topics, each of which is expressed by the probability distribution of the terms. Zhao et al. [31] proposed a model called Twitter-LDA, based on the hypothesis that one tweet expresses one slice of a topic’s content. They classified tweets by topics and extracted keywords to express their contents. Diao et al. [6] detected bursty topics using Time-User-LDA, which is an extension of LDA. They evaluated the accuracy of topic detection among three LDA models and clarified that Time-User-LDA detects with the highest accuracy.
Topic models are being applied to many studies. Zhang et al. [30] recommended bands and musicians to music lovers using LDA by calculating the degree of artist similarity based on generated topics. Riedl et al. [18] found the change-points of topics using LDA by calculating the similarity between sentences that express topic frequency vectors. Ma et al. [11] automatically annotated hashtags to tweets. Their PLSA-style models include user, time, and tweet content factors and achieved higher precision than other methods. Based on these previous studies, we applied LDA for building associations between aspects and topics as a part of HEF.
Multi-label classification
Multi-label classification studies are widely known methods based on SVM, Naive Bayes classifiers, and LDA. SVM, an identification method that performs supervised learning, has high generalizing capability and classification performance [5]. Chang et al. [3] developed an SVM library called LIBSVM, which achieves multi-label classification by building models by combining several labels. A Naive Bayes classifier assumes that the term occurrence in a document is independent, and label probabilities are calculated from these terms using Bayes rules. It estimates labels with the highest probability for a document [7]. Wei et al. [25] proposed multi-label classification based on Naive Bayes classifiers and estimated several labels with a probability that exceeds the average scores calculated by all the label probabilities. Ramage et al. [17] proposed a model called Labeled LDA (L-LDA) that expanded LDA to supervised learning. To extract latent topics, it assumes that the labels are the contents of documents. L-LDA can extract a one-to-one correspondence between LDA’s latent topics and document labels. Kase and Miura [10] estimated the new labels for an existing news-corpus. They calculated the occurrence probability of each feature in each class from a multi-label dataset and estimated an additional label with high probability using an EM algorithm based on the multinomial mixture model.
These methods show the high estimation performance of such long documents as blogs and newspapers using sufficient training data. However, tweets consist of fewer terms because their length averages 45 characters [14]. Moreover, as training data, fresh tweets are preferred because they are easily influenced by the real world. In these conditions, conventional multi-label classification methods fail to produce adequate performance to estimate several aspects of unknown tweets.
Our approaches
In this paper, we propose an inference method of the probability distribution of real-life aspects for unknown tweets by extending HEF, which was proposed in our previous work [29], to estimate several aspects of unknown tweets. HEF is composed of two-phase training: First, many topics are extracted using unsupervised topic models. Second, associations between topics and aspects are built based on supervised learning using labeled data. In our previous work, the association building had to explore an optimal parameter in each aspect using tuning data to enhance estimation performance of aspects. The main extension in this paper is to automatically build the optimal associations between many topics and aspects.
Probability distribution inference
Overview of HEF
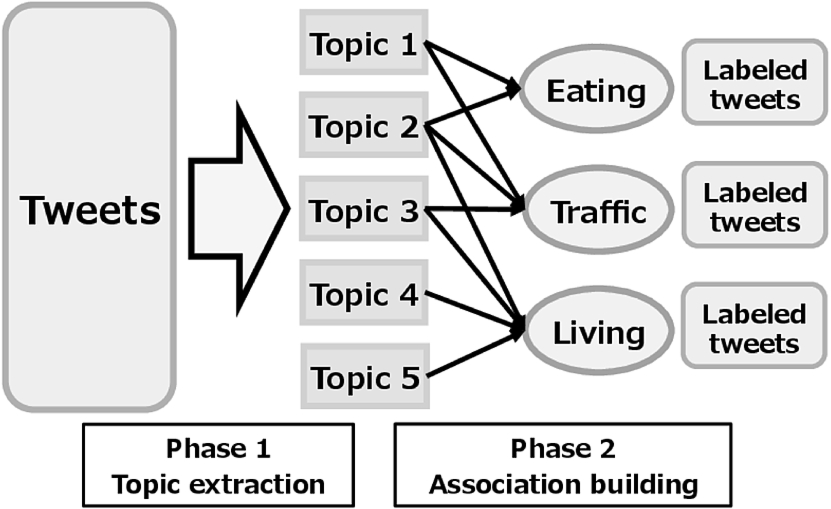
The hierarchical estimation framework (HEF), which is a multi-label classification model that we previously proposed [29] (Fig. 1) is composed of two phases in a hierarchical manner. In the first phase, many topics are extracted from a sea of tweets using LDA. In its second phase, associations between topics and aspects are constructed using a small set of labeled tweets. We calculated the aspect scores for unknown tweets using the associations based on the terms extracted from them. Appropriate aspects are used to label unknown tweets by particular thresholds.
Hierarchical estimation framework.
Typical supervised machine learning methods directly calculate the term likelihood from labeled training data. The terms in unknown tweets, which do not appear in the training data, can’t play an effective role in the estimation of conventional methods. In contrast, HEF is composed of a triple hierarchy: Tweet-Topic-Aspect. The terms in a tweet are expanded using co-occurrence terms in appropriate topics. As a result, we clarified that HEF can estimate several appropriate aspects from a small set and the short sentences of labeled data: i.e. tweets.
In this paper, we extend the second phase of HEF to infer the probability distribution of the aspects of unknown tweets and propose an optimal association building method to manage topics extracted by LDA.
To build associations between many topics and fewer aspects in the second phase of HEF, we calculated the relevance as joint probability
Association building
We make associations between topics and aspects based on relevance
Topic set
Here, we focus on the relationship between topics and aspects. As mentioned above, each aspect consists of many topics. The importance of topic t in each aspect a is calculated as conditional probability
The conditional probabilities are calculated as follows:

Probability distribution inference method.
To infer the probability distribution of real-life aspects for unknown tweets, we use the associations between topics and aspects. The inference flow using the associations is shown in Fig. 2. First, terms are extracted from tweets. Second, the occurrence probabilities of all the terms are calculated for each topic. After that, the aspect score is calculated based on the term’s probabilities and associations. Aspect scores
Experimental evaluations
To clarify the effectiveness of our proposed method that infers the probability distribution, we evaluated the JS divergence (JSD) and the Euclidean distance (ED) between each method’s inferred and correct probability distributions. As baseline methods, we adopted Naive Bayes, SVM, and L-LDA.
Dataset and parameter settings
Collecting many regional tweets
Our method requires many tweet datasets for generating topics using LDA. We used the Twitter Search API and collected 2,390,553 tweets4
To construct associations and evaluate our method, we prepared a small set of 1,500 labeled tweets, each of which has “Kyoto” as the Japanese location information. We used three examinees: examinee E1 is the first author, and E2 and E3 are university students living in the city of Tsukuba. During the labeling process, the examinees freely consulted Table 1 and viewed the example tweets in each aspect and why they were classified as such. They selected the most suitable aspect for each tweet as the first aspect and the next two most suitable aspects as the second and third aspects. If no suitable aspect remained, they selected “other” to identify it as a non-real-life tweet.
We evaluated the κ coefficients among the top level candidates, i.e. the top ones of the examinees [4]. When the κ coefficient is high, the classification agreement rate among the examinees is high. The κ coefficient between examinees E1 and E2 was 0.687, 0.595 between E1 and E3 and 0.576 between E2 and E3. The average was 0.619, which shows a substantial match rate.
Single-label dataset for training
To identify the most appropriate aspect for each tweet, we extracted the aspect selected as the top candidate assigned by two or three examinees. The number of labels of each aspect is shown in the “Single-label” column in Table 2. The Eating aspect received the most labels: 136 out of 1,500 tweets. Eight aspects were labeled by 100 tweets. The total number of aspects labeled by tweets was 1,345. The tweets that didn’t completely match by the three examinees numbered 155 (
# and probability of labels by aspect
# and probability of labels by aspect
The appropriate several aspects for each tweet are given at least once as the first candidate aspects selected by one of the three examinees. Therefore, the multi-label dataset is a superset of the single-label dataset. The number of labels of each aspect is shown in the “Multi-label” column in Table 2. The aspects of Eating and Event are the most labeled ones. The aspects of Contact, Event, Expense, and Locality increased to over twice the number of labels compared with the single-label dataset.
Probability distribution dataset for evaluation
To give the probability distribution of the aspects for each tweet, we used all of the candidate aspects assigned by the three examinees. Based on the reciprocal rank (RR) [23], which is one evaluation metric for search engine effectiveness, we assumed that the aspects selected with a higher rank have greater weight for the tweets. Correct probability distribution
Parameter settings
LDA requires hyperparameters. Based on related works [8], we set α to
Evaluation metrics
To correctly evaluate our method’s performance, we used 10-fold cross validation. We evaluated the JSD and ED between the inference and correct probability distributions. JSD is a metric that measures the similarity among probability distributions [15]. When both metrics are low, our method accurately infers the probability distribution of tweets. JSD and ED between the probability distributions of x and y are calculated as follows:
Baseline methods
We extracted nouns, verbs, and adjectives using a Japanese morphological analyzer called MeCab5
As the simplest comparison method, we prepared the uniform distribution of aspects, each of which has
Prior distribution (PD)
Prior distribution is calculated from the ratio of the number of aspects in the training dataset. UD and PD do not depend on the set of words appearing in the tweets.
Naive Bayes (NB)
A Naive Bayes classifier [5], which is one of the most typical and effective classification methods, classifies the labels with the highest posterior probability for a document. In our experimental evaluations, we used the normalized posterior probability of each document.
Support vector machine (SVM)
We used LIBSVM [3] as a support vector machine library. LIBSVM provides a probability estimation tool [27] for each class in addition to document classification. As SVM parameters, we chose a linear kernel and set parameter C to 1.0, indicated by a grid search in the LIBSVM tools.6
Labeled LDA is an LDA extended model proposed by Ramage et al. [17]. L-LDA sets the hyperparameters of both α and β, as in LDA. We experimentally set α to 0.1 and β to 0.1, and the iterative calculation count in L-LDA was 100.
Experimental results
Comparison of number of topics
We evaluated the micro-average value of JSD between the inference and correct probability distributions in both the single and multi-label cases (Table 3). In both cases, according to an increasing number of topics, JSD decreased. Its decrease stabilized from 500 topics because the JSD difference at 500 and 1,000 topics is slight. A minimum JSD was achieved at 1,000 topics in both the single and multi-label cases. Therefore, we used 1,000 as the optimal number of topics for HEF.
JSD scores in each # of topics in HEF
JSD scores in each # of topics in HEF
We show the number of topics associated to each aspect in the
We show the relevance and the t-test distributions of the Disaster and Event aspects in Figs 3 and 4. The horizontal axes of both figures are the topics rankings that are arranged in descending order of the relevance strength. The left and right vertical axes of both figures are the relevance and t-test values. The Disaster aspect achieved the maximum t-test value from 300 to 400 topics. On the other hand, the Event aspect achieved the maximum from 200 to 300 topics.
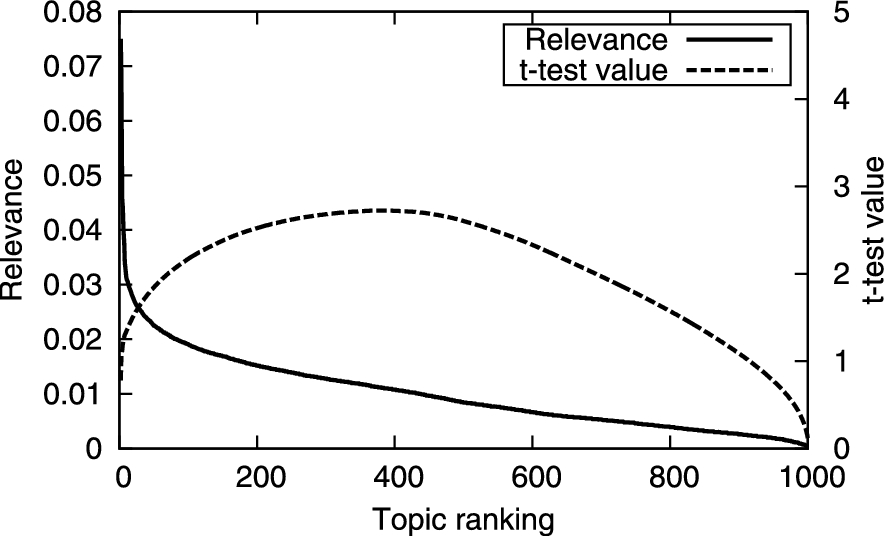
Relevance and t-test value distribution of Disaster.

Relevance and t-test value distribution of Event.
To evaluate the effectiveness of our association building method, we implemented three simple methods to build associations. First, we associated a topic with the highest relevance to each aspect; second, we associated ten topics with higher relevance to each aspect; finally, we associated all topics to each aspect.
JSD by each association building method
JSD by each association building method
The JSD value by each method is shown in Table 4. The minimum JSD value was achieved by t-test topics. The first and second methods showed higher JSD values than the third method. Based on these results, the aspect architecture is insufficient for just a few topics. However, to build refined associations, the architecture needs to delete extra topics from the third method’s result.
We show the micro-average value and the standard deviation of JSD and ED by each method in Figs 5 and 6. The vertical axis shows the JSD and ED values. We took a one-sided t-test of HEF’s JSD and ED values against the baseline method’s values. That result was drawn on the top of each baseline method as “
From the t-test results, our method efficiently estimated the probability distributions against all the baseline methods in the single-label case. In the multi-label case, HEF performed significantly better than every baseline method except SVM. The JSD value of HEF that was trained by multi-label datasets is significantly better at 10% against single-label training.

JS divergence.

Euclidean distance.
From Figs 5 and 6, the multi-label dataset achieved lower JSD and ED values than the single-label dataset, except for the uniform distribution. The reason is clear because the multi-label dataset has more detailed training information than the single-label one to infer the probability distributions. SVM especially decreased the JSD values of 0.04 (
Our method showed the lowest JSD and ED values in both the single and multi-label cases. In the single-label case, HEF showed significantly higher performance than the other methods. We can see an optimal example tweet that explains this reason in Table 5 and Fig. 7. Table 5 shows the example tweet sentence and its labels. The main topic of this tweet is open campus, and two examinees selected the School aspect as its top candidate. Therefore, this tweet received the School aspect label. On the other hand, examinee E3 selected the Event aspect as its top candidate because he defined open campus as an event. In fact, examinee E1 selected the Event aspect as his second highest candidate. In multi-label cases, this tweet was labeled by School and Event aspects.
Effectively inferred probability distributions of aspects by HEF
Effectively inferred probability distributions of aspects by HEF

Probability distributions of aspects estimated by each method for Table 5’s tweet.
Figure 7 shows the correct probability distributions of Table 5’s tweet as a solid black line. The School and Event aspects have higher probability than the other examinee labeling results. In addition, we show the probability distributions estimated by each method that was trained by a single-label dataset. We focus on the probabilities of the Event and School aspects. The inferred probability of the School aspect by each method is higher than the other aspects. NB inferred a higher probability than 0.50. SVM and HEF showed a lower probability than the correct one. Next, in the inferred probabilities of Event by each method, HEF successfully estimated the most approximate probability.
High-occurrence-probability terms in highest relevance topic associated with Event
Here, we show the high-occurrence-probability words in the topic associated with the highest relevance to the Event aspect by HEF in Table 6. This topic includes terms related to the Event aspect: “participation”, “held”, and “conference”. On the other hand, such terms as “lecture”, “campus”, and “university” are also included in the topic, suggesting that they often appear together in many tweets. Therefore, such terms as “campus” and “university” are frequently mentioned in connection with Event aspect terms, including “held”. Our method can build associations between this topic and the Event and School aspects because it can use such terms as “held” to assign the Event aspect and “lecture” to assign the School aspect. Although Table 5’s tweet includes many terms that suggest the School aspect such as “university”, “professor”, and “lecture”, the only term for estimating the Event aspect is the verb “held”. For these reasons, the estimations of NB, SVM, and L-LDA, all of which directly calculate the likelihood of terms, were not appropriate. On the other hand, HEF inferred the Event aspect with high probability for Table 5’s tweet because it associated the Event aspect with high relevance to topic #387, which includes “held”, “lecture”, and “university” with high occurrence probability by LDA.
Finally, we show the number of average labels (Mean), its standard deviation (SD), and the assigned labels for a tweet by each examinee in Table 7. The mean and standard deviation of examinees E1 and E3 are approximate values. The number of assigned labels for them is also shown as similar distributions. However, the number of average assigned labels by examinee E2 shows greater values than E1 and E3. E2 tended to assign many labels for a tweet from the values in the “Three labels column”. These results suggest that the criteria of the users for assigning aspects are different. For example, E1 and E2 are more accuracy-oriented users and E3 is an exhaustive-oriented user. A multi-label classification approach has difficulty accommodating an individual user’s requirements or various situations. However, the representation of probability distribution on tweets can be applied to these users.
Average number of labels for a tweet by each examinee
In this paper, we proposed an inference method of real-life aspect distribution of tweets by a hierarchical estimation framework (HEF) using a small set of labeled tweets. To evaluate our method’s effectiveness, we prepared a small set of labeled tweets based on the classifications of three examinees. From our experimental evaluation results, our prototype system demonstrated that HEF can appropriately infer the probability distribution of the aspects of all unknown tweets.
The main contributions of this paper are as follows: First, although the aspect architecture is insufficient for just a few topics, the architecture needs to delete extra topics with low relevance by t-test to build refined associations. Second, in the case of single-label training, HEF showed significantly lower JS Divergence and Euclidean Distance values than every baseline method based on sharing topics by several aspects.
These results show that our scheme is an effective inference method of the probability distribution using a small labeled dataset for such short sentences as tweets. In the future, we will confirm the effectiveness of our method using other datasets, such as newspapers and blogs.
Footnotes
Acknowledgements
This work was supported by Grants-in-Aid for Scientific Research No. 25280110 and No. 15J05599 and by NII’s strategic open-type collaborative research.