
Abstract
The standard paradigm in Affective Computing involves acquiring one/several markers (e.g., physiological signals) of emotions and training models on these to predict emotions. However, due to the internal nature of emotions, labelling/annotation of emotional experience is done manually by humans using specially developed annotation tools. To effectively exploit the resulting subjective annotations for developing affective systems, their quality needs to be assessed. This entails, (i) evaluating the variations in annotations, across different subjects and emotional stimuli, to detect spurious/unexpected patterns; and (ii) developing strategies to effectively combine these subjective annotations into a ground truth annotation. This article builds on our previous work by presenting a novel Functional Data Analysis based approach to assess the quality of annotations. Specifically, the bivariate annotation time-series are transformed into functions, such that each resulting functional annotation then becomes a sample element for analysis like Multivariate Functional Principal Component Analysis (MFPCA) that evaluate variation across all annotations. The resulting scores from MFPCA provide interesting insights into annotation patterns and facilitate the use of multivariate statistical techniques to address both (i) and (ii). Given the presented efficacy of these methods, we believe they offer an exciting new approach to assessing the quality of annotations.
Introduction
In the past two decades, the number of gadgets that humans interact with has been on the rise. This trend continues as the next generation of gadgets (e.g., personal robot-companions, autonomous cars) enter our lives. This ever-increasing technologisation brings numerous challenges pertaining to effective and continuously engaging user-interaction. Addressing these challenges effectively is the goal of Affective Computing (AC), which aims to develop systems that can recognise and process human emotions [26], such that they continuously adapt to the user’s needs [31]. To this end, researchers in this field often investigate how, e.g., physiological signals [32,40], speech [2,32], facial expressions [32,36] and other modalities [31], act as markers for emotional experience. The aim being, that if the relation between these signals and emotions can be robustly modelled, then machines can ‘learn’ to recognise and adapt to their users’ emotional state. Given the far-reaching impact such a technology would have on user-interaction, interest in the field of AC has been steadily growing. Accordingly, in recent years, several interesting research/applications in AC have come to the fore. These include, among others, an affective music player that adapts the music being played to user’s emotional state [39], an investigation on the role of AC in monitoring workplace health and safety [38], and a study on the use of AC methods for continuous pain intensity assessment [21].
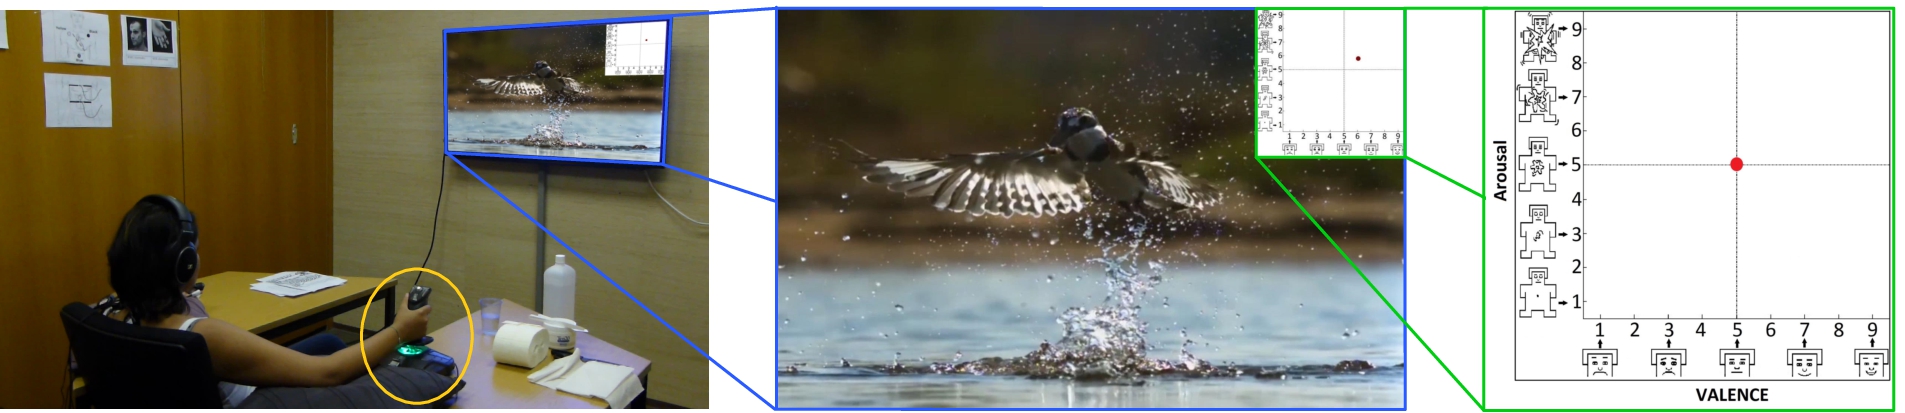
Typical annotation setup using JERI with the joystick circled (left). A video-stimulus with the embedded annotation user-interface (center), where the Self-Assessment Manikin (SAM) were added to valence-arousal axes (right).
In spite of the burgeoning interest and research efforts, several hurdles restrict a more widespread utilisation of AC. Principal among these is the internal nature of human emotions that leads to them not being easily accessible to external entities [40]. To address this, the link between measurable emotion modalities and internal emotions needs to be established. This is still largely an unsolved problem, but a commonly followed approach in laboratory settings involves eliciting emotional response from humans using stimuli like pictures [25], videos [33,40], music [25], etc., while simultaneously acquiring modalities and annotations pertaining to the emotional experience. These annotations are usually provided in form of either discrete emotion categories [31,40] (e.g., fear, joy, etc.) or in terms of Valence and Arousal (V–A) values as per the continuous 2-dimensional Circumplex model of Affect [30]. Traditionally, these annotations were manually acquired using Likert-scale based questionnaires, where a single emotional-label or V–A pair-value represents the emotional response to the stimulus. However, in recent years, there has been a growing realisation that this approach does not adequately represent the emotional response elicited by dynamic stimuli (e.g., videos) [20,25,36]. Thus, greater emphasis is now placed on continuous annotation of emotional experience using specially developed interfaces like FEELTRACE [7], GTrace [8] and EmuJoy [25]. While these interfaces laid the groundwork for continuous annotation, in recent years, several shortcomings with respect to their setup, annotation-strategy and usability, have been widely reported [3,23,24,43]. To improve upon these, we developed a new Joystick-based Emotion Reporting Interface (abbreviated as DLR–JERI or JERI) [33], that: (i) uses a joystick instead of the less ergonomic (and commonly used) mouse (see Fig. 1), (ii) unlike some current interfaces, allows for simultaneous V–A annotation, and (iii) guides users through more widely interpretable Self-Assessment Manikin (SAM) [4]. This interface has also been formally evaluated through a user-study, where it was rated as having ‘excellent’ usability [33].
Irrespective of the annotation interface used, a common issue is the quality of the acquired subjective annotations [20,24,41]. This issue can be best summarised in form of the following questions: (a) given an emotional stimulus, do the annotations exhibit some agreement?, (b) do different stimuli with similar intended V–A attributes lead to similar annotations?, (c) how do annotation patterns vary across different stimuli and are they discriminable from each other?, and (d) given multiple annotations, how to best determine the underlying ground truth annotation? Addressing these questions is highly relevant when collecting emotional corpora and/or developing emotion prediction models, as undesired effects, such as diverging annotator behaviour, ill-chosen stimuli, etc., can be detected and mitigated [20,28]. For continuous annotations, addressing these quality issues is analytically more challenging [20]. Existing approaches to the same, including our previous work [1,33,34], fall into the following two categories. In the first, the continuous aspect is ignored. Accordingly, (a) and (b) are addressed using inter-rater reliability measures [24,43], (c) using ANOVA (or MANOVA for multivariate case) models [29,33], and (d) by simply calculating point-by-point arithmetic mean [14,37]. The approaches in the second category account for the continuous nature, but only for the univariate case. Thus, (b) and (c) can be addressed using univariate sequence analysis [33], and (d) using regression-based approaches [33,35]. For Likert-scale or univariate continuous annotations, these approaches are often sufficient. However, for continuous and bivariate annotations (as for JERI), approaches that account for the inherent correlation between valence and arousal need to be developed.
The type, label, source, intended valence-arousal attributes and duration of each video used in the experiment
To this end, in this work we extend our previous effort [33] by presenting a novel Functional Data Analysis (FDA) based approach to address the aforementioned quality issues. The main advantage of FDA techniques is that, unlike the aforementioned discretised approach, they are applied to complete bivariate annotations. The contribution of this work is twofold. First, a foundational framework for converting annotations into functions is presented. Second, several FDA based approaches to evaluate the quality of annotations are developed. To the best of our knowledge, this is the first attempt at using FDA for analysing continuous annotations in AC.
The rest of the paper is organised as follows. In Section 2, the experiment setup, annotation data, processing steps for converting annotations into functions and a theoretical background for Multivariate Functional Principal Component Analysis (MFPCA), are presented. Section 3 presents the results of the analyses undertaken on functional annotations. Namely, (i) MFPCA analysis to investigate the variance, (ii) a distance-based measure to showcase concordance of annotation patterns, (iii) the use of Fisher Discriminant Ratio and (iv) Gaussian Support Vector Machines to discern the discriminability between annotations, and (v) an approach to ascertain ground truth annotations, are presented. A discussion of the results is also presented. Lastly, in Section 4, the conclusions and the outlook from this work are presented.
Setup
To test and validate annotations from JERI, an experiment involving 30 volunteers (15 males, age
Annotation data
The raw annotation data acquired from the experiment is in form of 2-D sequence of points within the interval
Basis expansion using P-splines
The fundamental notion of FDA is that discrete data points
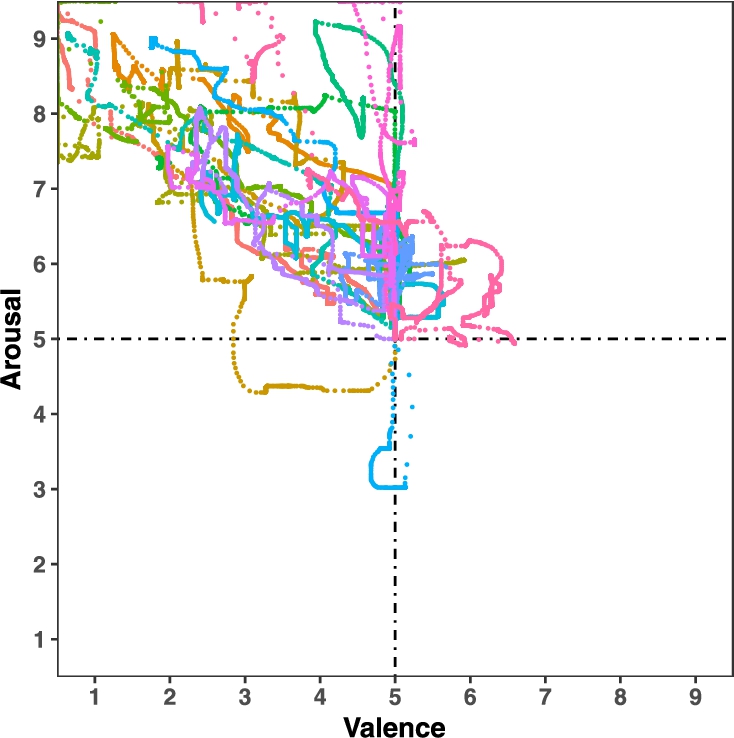
Annotations from 15 subjects (different colours) for video sc2.
B-splines were used for the given dataset because of their efficacy in representing non-linear and non-periodic data [17]. B-splines are a form of piecewise-polynomials representation, whereby the input data is divided into contiguous intervals and local polynomials are used to represent the underlying function in that interval [9]. Thus, B-splines representation is contingent to the ‘knots’ defining the intervals and the degree of the polynomials used. A basis function
Given the discrete data and the basis functions, Least Squares minimisation [11] is used to compute the estimated model parameters
As is evident from Eqs (8) and (9),
By substituting the value of
From Eqs (9) and (12) it is evident that the functional representation is contingent to three parameters: (i) the degree l of the basis-splines, (ii) the number d of basis functions, and (iii) the smoothing parameter λ. Optimal values of these parameters are required to obtain a ‘good’ and denoised approximation of the underlying function
To this end, splines of order 4 (degree
Multivariate Functional Principal Component Analysis (MFPCA)
Functional-PCA (FPCA) is analogous to PCA as the main aim of both these methods is to determine the dominant modes of variation in the data [19]. FPCA is however applied to functions, instead of multi-dimensional vectors as in PCA [27]. Standard FPCA approaches are not suitable for the given dataset, as they – (i) only operate on univariate functions, (ii) require that all functions are of same time-duration. Therefore, for the annotation functions, the state-of-the-art MFPCA [16] was used. MFPCA is an advanced statistical method and its thorough presentation is beyond the scope of this article. The rest of this subsection presents an abridged introduction to MFPCA, such that an intuition about it can be developed. More details on MPFCA can be found in [15,16].
At its core, the used MFPCA method is based on the truncated Karhunen–Loève expansion. According to which, a function can be approximated by a finite sum of its functional principal components [22], so the basis expansion defined in Eq. (3) can be modified as:
Results
MFPCA on all annotations
Based on methods presented in Sections 2.3 and 2.4, 240 (30 subjects × 8 videos) bivariate annotation functions were generated. Similar to PCA, the MFPCA method is contingent to the number of principal components M used for the representation [16]. To this end, the optimal M was determined based on how much of the total variance is explained by the different principal components [19]. For the annotation functions, M was set to 10, as based on scree plot analysis the subsequent increase in explained variance for
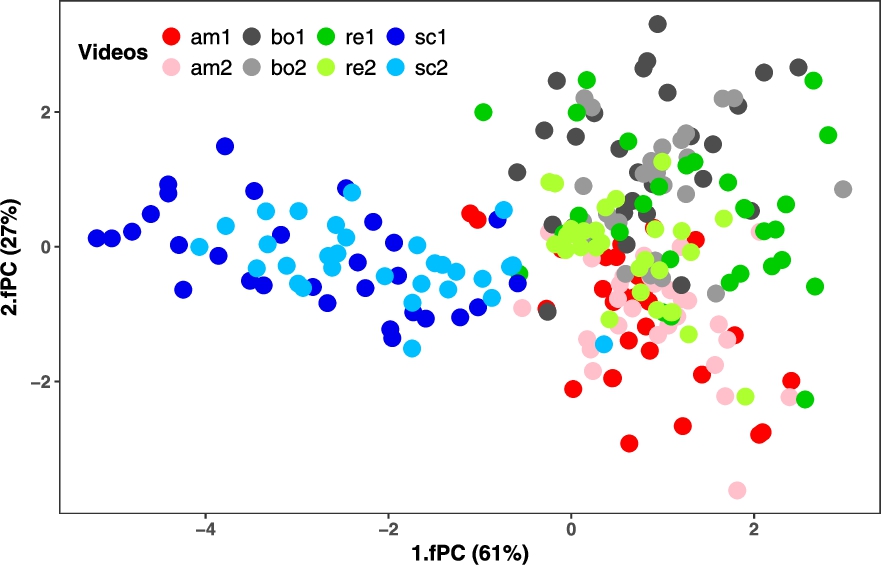
Scatterplot of the MFPCA scores on the first two fPC for all annotations of the videos (see Table 1) used in the experiment.
To determine the efficacy of both, the used stimuli and the annotation strategy, in eliciting desired V–A response from the participants, an analysis of concordance in annotations is necessary. To this end, the Euclidean distances between the MFPCA scores of annotations on the first 4 fPC (95% explained variance) were used. Such that, relatively higher distance values signify low concordance between the annotations. For the given 240 bivariate annotation functions, this analysis evaluates the pair-wise distance between annotations resulting in
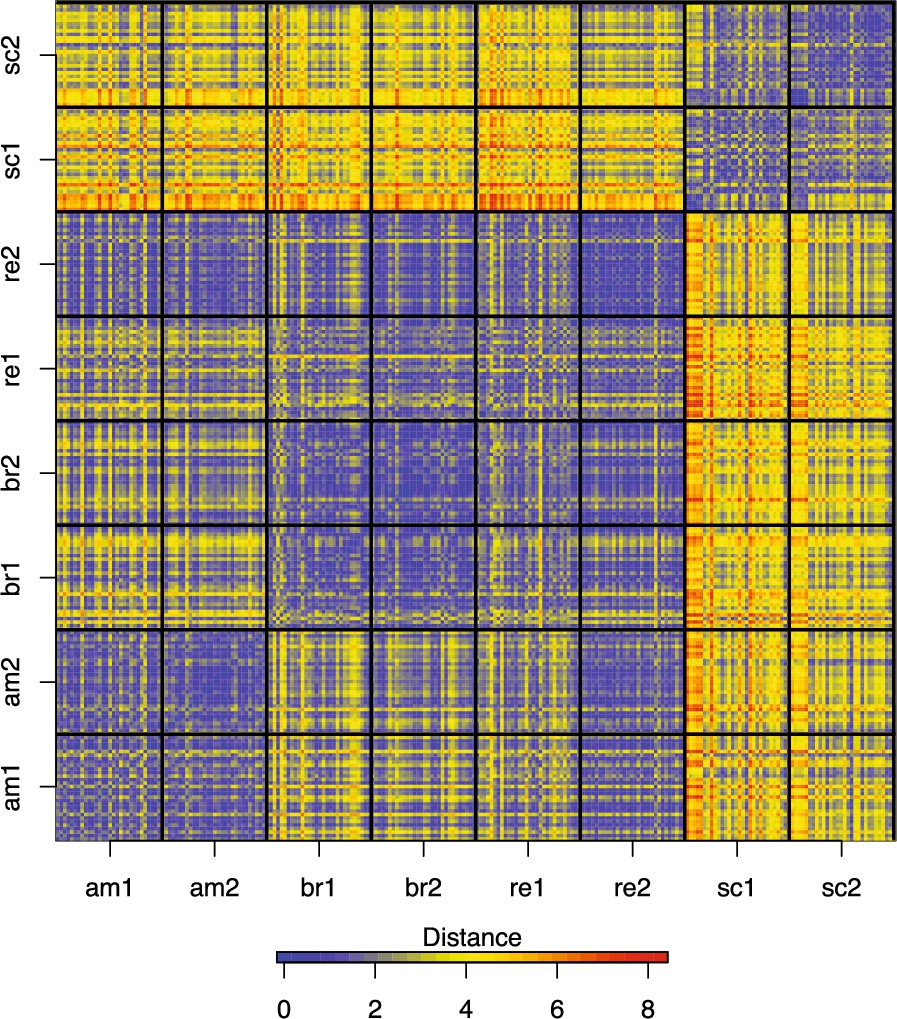
Distance-heatmap for all annotations, where distances are inversely related to concordance between annotations.
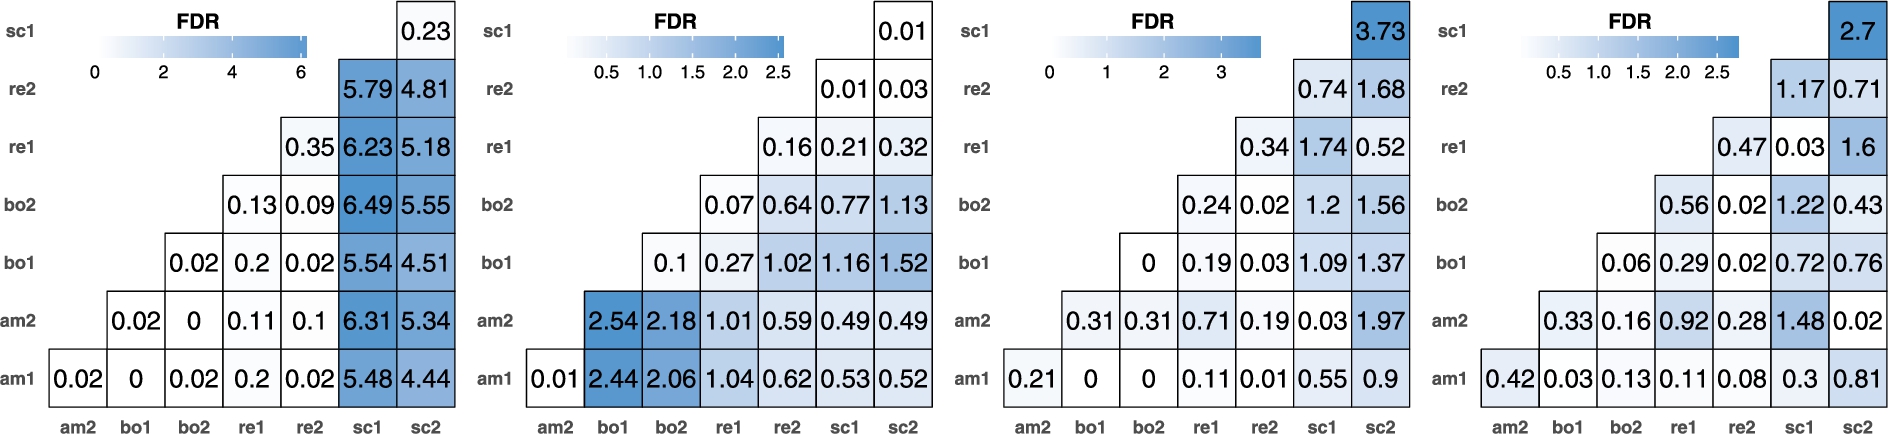
FDR values from the first four fPC (left to right).
The analyses in Sections 3.1 and 3.2 present an intuition about the separability of annotations, which can now be formally evaluated using discriminant analysis. To this end, we used Fisher’s Discriminant Ratio (FDR) to determine the relative cluster separability between the scores of all videos on different fPC [10]. FDR between two videos for each fPC is calculated as:
Classification balanced accuracy [%] and number of Support Vectors, per video type and overall, for the 25/5 training/testing set [33], and for the leave-one-subject-out (LoSo) schema (mean values ± one standard deviation, all percentages rounded to the nearest integer)
Classification balanced accuracy [%] and number of Support Vectors, per video type and overall, for the 25/5 training/testing set [33], and for the leave-one-subject-out (LoSo) schema (mean values ± one standard deviation, all percentages rounded to the nearest integer)
The results presented in Sections 3.1 and 3.3 indicate that two (in turn, four) principal components of the annotations can already be used for a qualitative analysis of the characteristics of each type which are invariant across subjects. We now turn to a quantitative analysis of separability using a standard classification method. To this aim, we use the complete score vector (10-D) for the annotations as the input space to a Support Vector Machine (SVM, [5]) with Radial Basis Function kernel, while the label of each annotation is the type of clip. As a measure of accuracy we employ the balanced classification accuracy, defined as one minus the balanced error rate (average of the classification errors for each type of clip). We employ the standard SVM library libsvm [6] and let it perform one-versus-one multiclass classification [18]; notice that, since the problem has four classes, a balanced classification accuracy of
We perform two kinds of analyses, each characterised by a different way of generating the training and testing set. In the first analysis, analogously to what is done with characteristic time sequences in [33], the training set consists of the annotations from the 25 participants chosen in that paper (200 annotations), whereas the testing set consists of the data from the remaining 5 participants (40 annotations). The optimal hyper-parameters of the SVM, C and γ, are found via grid search [5] within ranges of
Secondly, we perform a deeper analysis, namely a Leave-one-Subject-out (LoSo) classification: for each of the 30 subjects in turn, her annotations are used as the testing set, and the annotations of the remaining 29 subjects constitute the training set. The ranges for the grid search of the optimal parameters are as above. The balanced classification accuracy is
Calculation of the characteristic annotation for videos used in the experiment: The video label, the number of fPC required to account for 95% explained variance, the variance explained (in %) by the first two fPC and the number of annotations detected to be outlying based on robust mahalanobis distance
Calculation of the characteristic annotation for videos used in the experiment: The video label, the number of fPC required to account for 95% explained variance, the variance explained (in %) by the first two fPC and the number of annotations detected to be outlying based on robust mahalanobis distance
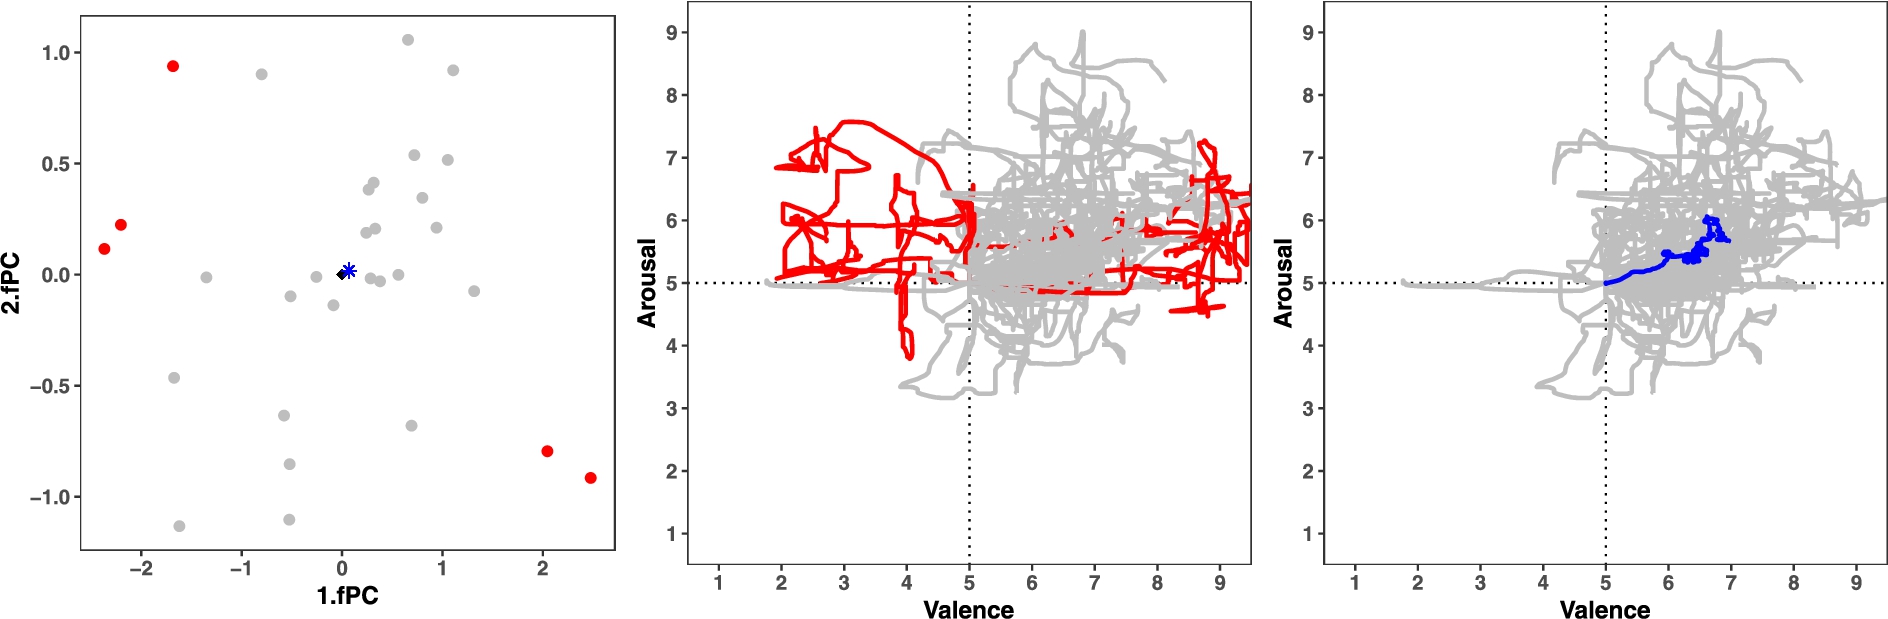
Calculation of characteristic annotation for am1. (Left) scores in the first 2 fPC: Outliers (red), original-mean (black) and adjusted-mean (blue star). (Center) the outlying (red) and non-diverging (gray) annotations in the original valence-arousal space. the resulting characteristic annotation (blue) in the valence-arousal space.
Given multiple subjective annotations pertaining to an emotional stimulus, a major challenge in AC is to determine a ground truth (also known as characteristic) annotation for that stimulus. To this end, the aforementioned MFPCA approach can be used. This entails, first, undertaking the MFPCA analysis separately for each video stimulus. The M used for this analysis was determined to be 10, which is the same as used for the MFPCA analysis for all annotations (see Section 3.1). However, the number of fPC that account for 95% explained variance varies across videos (see Table 3). Second, in the resulting fPC space, robust Mahalanobis Distance (
Conclusions
A major goal of AC is to develop systems that can detect, and react to, human emotions. Yet, as emotions are personal and intimate, it is hard to define what such systems are supposed to detect, that is, what a sensible annotation of emotions can possibly be. The problem is even harder when these annotations are acquired continuously. In this work, a FDA approach that addresses these challenges was presented.
The fundamental challenge of how to best acquire comprehensive, continuous annotations of the emotional experience is addressed by our Joystick-based Emotion Reporting Interface (JERI). This approach, involving continuous and simultaneous annotation by the subject, can lead to increased cognitive load; but we have shown in our previous work that the use of joystick mitigates this issue to a large extent. Secondly, given that valence and arousal are inherently related, our approach of simultaneous annotation is advantageous over existing commonly-used approaches. The next challenge pertains to the continuous (and in our case, bivariate) nature of the annotations. The approach presented in this work focusses on converting these annotations into functions for further processing. This adds an extra data processing stage (see Sections 2.3 and 2.4) that is computationally intensive. However, we believe the benefits here outweigh the costs. As, firstly, this approach also ‘smoothens’ the data by removing perturbations, hence it comprises of the pre-processing stage that needs to be undertaken on this data. Secondly, this conversion into functions retains the time component of annotations, which is often ignored by commonly used analytical methods that ignore auto-correlation conspicuous in this data.
The intended overall emotional (Valence–Arousal) attributes of different video types and labels are shown in Table 1. Accordingly, it is desired that the subjective annotations pertaining to these videos exhibit these attributes. Such that, the annotations for different video types are distinct, and of same video label are similar to each other. These desired properties encompass the next challenge associated with subjective annotation of emotional experience, which was addressed using MFPCA. Accordingly, Section 3.1 presents an exploratory analysis of annotation patterns which was then formalised through concordance analysis presented in Section 3.2. In fact, this analysis also facilitates a comparison of annotations across all videos. The separability of annotations was then initially investigated using FDR in Section 3.3 and later formalised through SVM-based classification analysis in Section 3.4. Most results of these analyses are along expected lines and they demonstrate how MFPCA scores can be successfully used to address the aforementioned challenge.
The unexpected results, specifically for video re2, can be attributed to improper selection of this media as it fails to evoke the desired V–A attributes. Nevertheless, these unexpected results are a testimony to the benefit of the presented analyses, as they demonstrate how undesired effects can be detected and removed. They also demonstrate the benefit and efficacy of MFPCA technique in transforming a complex bivariate function into a 10-D score vector, which in turn facilitates the application of commonly-used statistical techniques on this data.
The MFPCA approach can indeed be used to determine the ground truth (or characteristic) for the different videos, which is another major challenge in AC. To this end, diverging (or ‘outlying’) annotations for a video were determined using robust MD and removed from the data. Subsequently, characteristic annotation for that video was determined by evaluating the mean functional representation for the remaining annotations. While this approach works as expected for most videos, for some (like br1 and sc1) the MD method doesn’t find any outlying annotations. This unexpected result can be attributed to high within-video variances and demonstrates a limitation of this approach. Nonetheless, these results might improve by choosing a different distance measure or changing the criterion used to determine outliers.
At the onset of this paper, we introduced several challenges and current approaches to continuous annotation in AC. The use of our annotation interface (JERI) and the subsequent FDA-based analyses presented here address most, albeit not all, of these challenges. For example, the issue of inter-annotator delay is another major issue faced in continuous annotations. Also, as presented above, our approach has some shortcomings. Nevertheless, given that this is one of the initial, if not the first, attempts at using FDA methods for solving common problems in AC, we plan to further develop on these methods to improve their performance. Also, other FDA methods, such as landmark registration, can be extended to this type of subjective data to address inter-annotator delay in annotations.