
Abstract
Burst phenomena are caused by such social events as flaming on the internet, elections, and natural disasters. To understand people’s thoughts and feelings, we must classify their opinions from burst phenomena. Therefore, classification methods that categorize tweets are critical. However, since most classification methods focus on text mining, they cannot classify tweets by topics because each tweet has poor linguistic similarities. We used a non-text-based method proposed by Baba et al. that groups tweets by topics, even if they have poor linguistic similarities, and verified its validity by comparing it with a text-based method in two different evaluations: full data and sampled data. In the full data evaluation part, we did a questionnaire survey and validated the suitability of the topic clusters created by both classification methods using our full dataset. In the sampled data evaluation part, we focused on the robustness of each method against data reduction. Since collecting the whole data of burst phenomena is very costly due to the vast amounts of available social media data, robustness against data reduction is an important index to evaluate classification methods. After these evaluations, we found that the non-text-based method more effectively classified tweets than the text-based method.
Introduction
Burst phenomena [11], which frequently occur on social media during a specific topic, are caused by such social events as flaming1
This phenomenon generally occurs when a specific topic is controversial.
When burst phenomena occur, various opinions are posted and shared on social media. For example, before an election, the posted views and thoughts will reflect support for particular political parties. During an earthquake, the sufferers, the rescue/support personnel, and others will post different types of information. If flaming occurs, both negative and positive posts will comment on the topic.
To reveal how social events are received by a society as a whole, we must understand the thoughts and feelings of its citizens. For instance, if we consider a case on social media that addressed a defective product, the company must distinguish actual users who are flaming the product from those who just enjoy trolling. In other words, the opinions in burst phenomena must be categorized.
Many approaches [10,16,17,23,25,27] have analyzed social media data, but since most classification methods focus on text mining, they cannot group tweets by topics because each tweet has poor linguistic similarities. For example, tweets with only a URL cannot be correctly classified by text-based methods.
We use the non-text-based classification method proposed by Baba et al. [3], which groups tweets by topics even if they have poor linguistic similarities. Since this method originally just classified natural disaster information, we adapted it to other burst phenomena and verified its validity in a comparison with a text-based classification method. We conducted two evaluations: full data and sampled data.
In the former, we did a questionnaire survey using our full dataset and validated the suitability of the topic clusters created using both the non- and text-based methods. Since evaluating the similarity of every pair of tweets in each topic is difficult, we evaluated the similarity between the sampled pairs in our survey.
In the sampled data evaluation, we focused on data reduction and evaluated the robustness and the suitability of each method against data reduction. Many different approaches analyze social media data, especially because collecting data from social media is comparatively easy. However, collecting the whole data of burst phenomena is very costly due to the vast amounts of social media data, and in many cases, we cannot obtain complete data on social media.
If we could obtain the same knowledge from clustering even if we reduced the data size, we could simplify the analysis of burst phenomena. Therefore, robustness against data reduction is a critical index to evaluate classification methods.
It is also important to obtain suitable clustering results in the sampled data. Hence, we also validated the suitability of each clustering method using the sampled data by a questionnaire survey.
LDAs[5] have recently become more common in text clustering [1,4], and much research has focused on them for clustering tweets. Ramage et al. [17] characterized each tweet using labeled LDA. Another tweet clustering method uses TweetMotif [16]. Tumasjan et al. [23] analyzed mentions in tweets that referred to political parties and politicians and showed that Twitter basically provides a discussion forum function for politics. Other previous studies proposed aggregating all the tweets of a user as a single document [10,25]. These approaches are called author-topic models [20] where each document has a single author. Zhao Wayne Xin et al. [27] proposed a LDA for Twitter based on this author-topic model under the presumption that a single tweet is usually just addressing a single topic. Yan et al. [26] proposed a topic model for short text data called the Bitterm topic model (BTM). Sridhar [19] used word2vec [14] to vectorize short texts and classified them with a Gaussian mixture model (GMM). Murata et al. [15] used proper nouns to improve the grouping results of tweets about breaking news.
These methods of extracting information from Twitter are based on textual information and show the difficulty of addressing short tweets with URLs. For example, some tweets with URLs omit their main topics. A web page cited by URL contains the main topic. Some researchers cluster tweets without textual information. Rosa et al. [9] automatically clustered them using tweet hashtags, and Davidov et al. [8] created sentiment classifiers for tweets by supervised learning, which uses hashtags and face characters as teacher data. Baba et al. clustered tweets based on retweeting2
The retweet function allows users to share posts with their followers.
In this section, we explain the network clustering method that extracts the topics included in each burst example. In this method, user retweets are critical. With the overlap rate of the list of users whose tweets have an information id, we can classify tweets by similarity based on user interest. A summary of the network clustering method is presented as follows.
We cluster the posts included in a burst based on the similarity of the users who spread them by calculating the similarity between a pair of tweets. The similarity is based on overlapped users who retweeted them, and we construct a tweet network using the similarity. Although the method was first proposed to classify disaster information [3], we applied it to extract burst topics. Figure 1 shows an overview of network clustering.
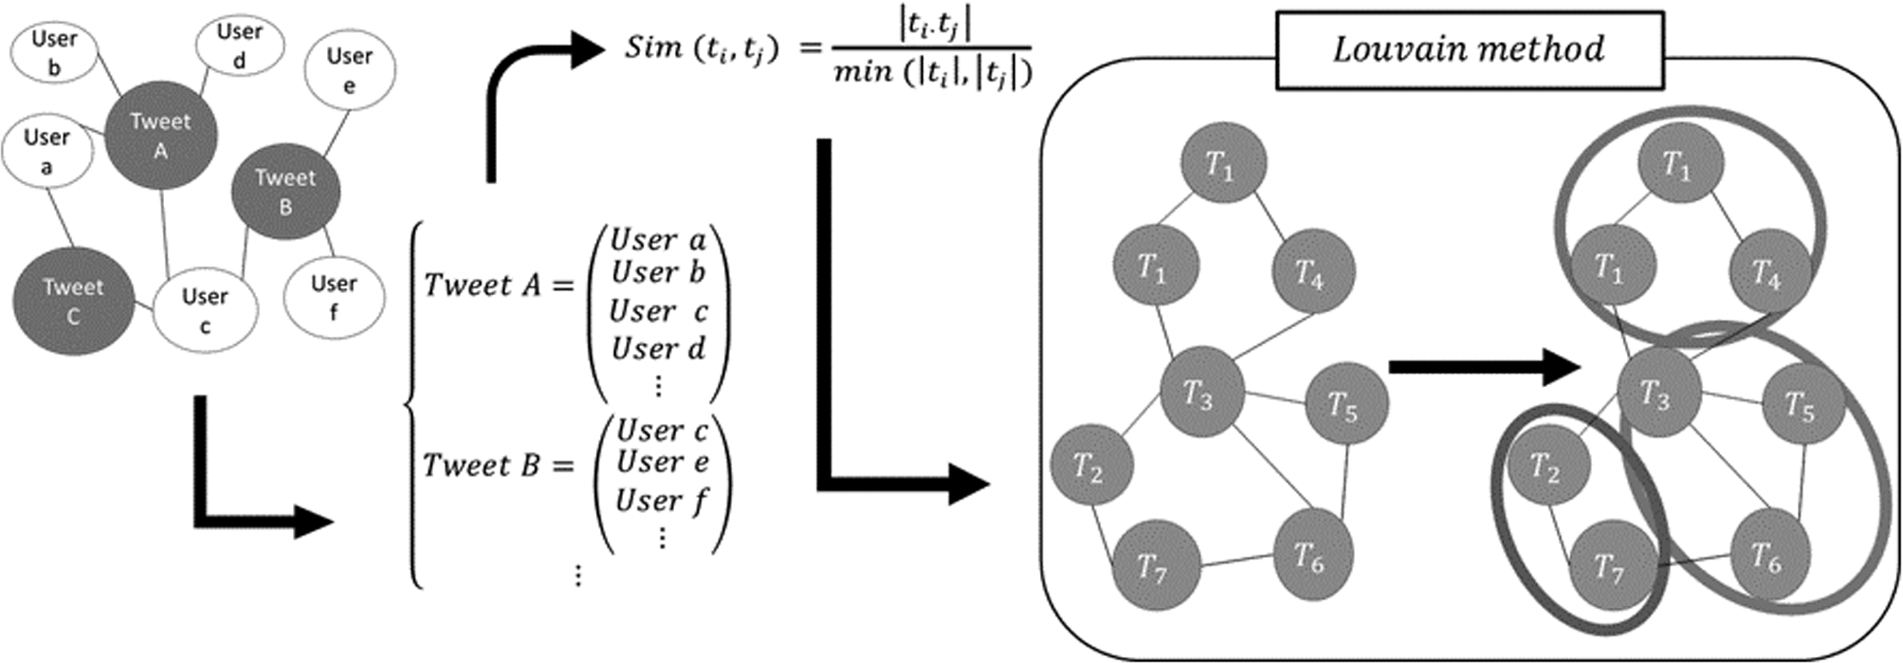
Overview of network clustering.
Information diffusion in Twitter is performed with the retweet function. First, network clustering method specifically examined tweets that are retweeted more than once and clustered them by the similarity of the users who retweeted them. Although some document clustering methods are based on textual information [2], applying such methods to tweet clustering is difficult because tweets are limited to 140 characters. Baba et al. calculated the similarity of a pair of tweets based on the overlap rate of users who retweeted them, constructed tweet networks by linking tweets whose similarity exceeded a certain threshold, and clustered them by applying a clustering method to tweet networks [3]. If multiple users simultaneously retweet a pair of tweets, then that pair is probably addressing similar contents. Consequently, the goal of this method is to cluster tweets based on the similarity of the users who are interested in them using retweet relationships because it is difficult to calculate such similarity from textual information.
Similarity calculation between tweets
Here we define the degree of similarity between a pair of tweets to construct a tweet network. As described above, we use the overlap rate of users who retweeted two tweets as the degree of similarity.
Compose matrix R of the characteristics of the relationship between the tweet and the user:
Set a row vector of R that corresponds to tweet i as a feature vector of tweet
Calculate the degree of similarity between two tweets
Other indices measure such similarity as well as the Simpson coefficient, e.g., the Jaccard and Dice coefficients. Baba et al. used the Jaccard coefficient for similarity, but we applied the Simpson coefficient because it is appropriate for expressing the degree of relationships based on co-occurrence [13].
Tweet network construction
After calculating the similarity between each two tweets, we construct a network of them. We linked the top Nth similar tweet pairs based on the degree of similarity and constructed a weighted undirected network. If the degree of similarity between Calculate similarity Extract the top Nth pairs of tweets in the degree of similarity from all pairs. Link the pairs of tweets extracted at step 2 in the tweet network.
Network clustering
Next we classify the tweet network obtained above and acquire a set of similar tweets. The tweet network weighs each link based on degree of similarity
The Louvain method has two phases that are repeated iteratively [6]. In the first, all of the nodes are assigned to each community at a weighted network. In the first phase, for each node i, we consider neighbor nodes j of i and calculate the gain of modularity that would take place by removing node i from its community and by placing it in the community of j. Node i is placed in the community when the gain of the modularity is maximum and positive. In the second phase, the nodes in each community are aggregated to one node and a new network is built. The network size fell by this phase. Phases 1 and 2 are iterated until the modularity is maximized and converged.
Example
We present example results of tweet clustering by applying our network clustering method to the burst case of the Mt. Ontake eruption. The details of burst cases are explained in Section 4. We set a minimum retweet count of k for the specific examination of just the topics that were diffused to a certain number of users. We also used the top-Nth links in the Simpson coefficient to construct a tweet network to remove the influence of links with a small Simpson coefficient. Here the parameters were changed to
Top 10 topics about Mt. Ontake eruption
Top 10 topics about Mt. Ontake eruption
The “Tweets” row expresses how many types of tweets are found in the cluster. The “RT cnt” row expresses the total retweet count of all the tweets in it. Topic T1 is a cluster about a victim who posted a photo of Mt. Ontake’s crater just before the eruption. The victim eventually safely climbed down from Mt. Ontake. Topic T2 is a cluster of topics about disaster relief technology. In this cluster, people expressed their admiration for such rescue technology. T3 and T7 comprise a cluster about the real-time condition of the Mt. Ontake eruption from different victims who took many photos and posted them on Twitter. T4 is a cluster about Japan’s volcano eruption history. T5 is a cluster about news. People posted their impressions about the eruption from corporate media. T6 is a cluster of photos taken by corporate media, including some aerial photography. T8 is a cluster discussing disaster prevention and predictions. Many experts were explaining why predicting eruptions is almost impossible. In cluster T9, there were posts and photos about the disaster relief mission of the self-defense forces. Topic T10 is a cluster of apocalyptic posts about disaster predictions. Predictions about the Mt. Ontake eruption were supposedly posted in Yahoo Answers in Japan before it erupted.
For our evaluations, we used three actual burst examples collected from Twitter as datasets. All of the datasets only included tweets that were shared at least once. In other words, all of the tweets in our dataset were retweeted. The tweet data structure is shown in Table 2.
Data structure of tweet data
Data structure of tweet data
We collected tweets of actual burst examples from Twitter to confirm that our topic clusters are appropriate and reasonable. We selected a natural disaster, a flaming incident on Twitter, and a social movement as examples of burst phenomena for our experimental datasets because these themes often become important on Twitter. We present the basic information related to the target burst phenomenon data in Table 3 and explain these examples below. Since there are various definitions of burst phenomena, we selected topics that have over 100,000 related tweets as a burst. In this research, we used Twitter data and analyzed the burst phenomena of the following three topics:
Dataset
Dataset
Mt. Ontake eruption: This volcano’s eruption on September 27, 2014 killed 58 mountaineers and was the worst volcanic disaster in Japan since World War II.
ALS Ice Bucket Challenge in Japan: In this social movement, participants had to choose whether to have a bucket of ice water dumped on them or to donate to the American Amyotrophic Lateral Sclerosis (ALS) Association. Thousands of celebrities embraced this activity, which started in the United States in 2014, although it did receive some criticism.
Foreign objects in McDonald’s food [12]: A human tooth, pieces of plastic, and a strip of vinyl were among the objects found in food served by McDonald’s in Japan. The incidents were widely disseminated to the public at the beginning of January 2015, and many people posted on social media.
We allocated information ids to groups of tweets that obviously have identical information, for example, to retweets and their sources. To each information id, we linked the preprocessed tweets that eliminated unnecessary symbols and characters from the original tweets and the list of users grouped by the information ids of their tweets. The details of the eliminated symbols and characters are shown in Table 4.
Eliminated symbols and characters
Eliminated symbols and characters
We used these preprocessed tweets to examine opinions about burst phenomena and defined the whole data collected from Twitter as full data (100% data) whose size is shown in Table 3. The data structures of the preprocessed tweets are shown in Table 5. For verification of the sampled data evaluation (6), we did a random sampling from these full data. The unique tweets in Table 6 all exceed the minimum retweet count that we determined in Section 3.5,
Data structure of preprocessed tweet data
Number of unique tweets (information ids)
In the second evaluation part, we compared the network clustering method with Hierarchical Dirichlet Process Latent Dirichlet Allocation (HDP-LDA), which is often used for topic modeling from text documents, as a comparative text-based method. HDP-LDA [21] is an LDA applied to a nonparametric Bayesian model. The characteristic differences of the two methods are summarized in Table 7.
HDP-LDA
In the HDP-LDA method, we morphologically analyzed the preprocessed tweets in each information id (the details are in Section 4.2) and classified them with HDP-LDA. We used Mecab3
Summary of two methods
The following is the sentence-generation process in HDP-LDA. j is the index of the sentence and n is the index of the words in each sentence.
Generate a probability distribution for the topic:
Select the probability distribution of sentence j from the generated probability distribution of the topic:
To generate N words, select topic
Generate all words

Three-group example of HDP mixture model, cited from [21].
We validated with evaluation experiments the propriety of the topic clusters created using a network clustering method. It is difficult to judge the similarity of every pair of tweets in each topic. Therefore, we evaluated the similarity between the sampled pairs. In this evaluation experiment, examinees judged the similarity by performing the following task.
First, we randomly selected two topics,
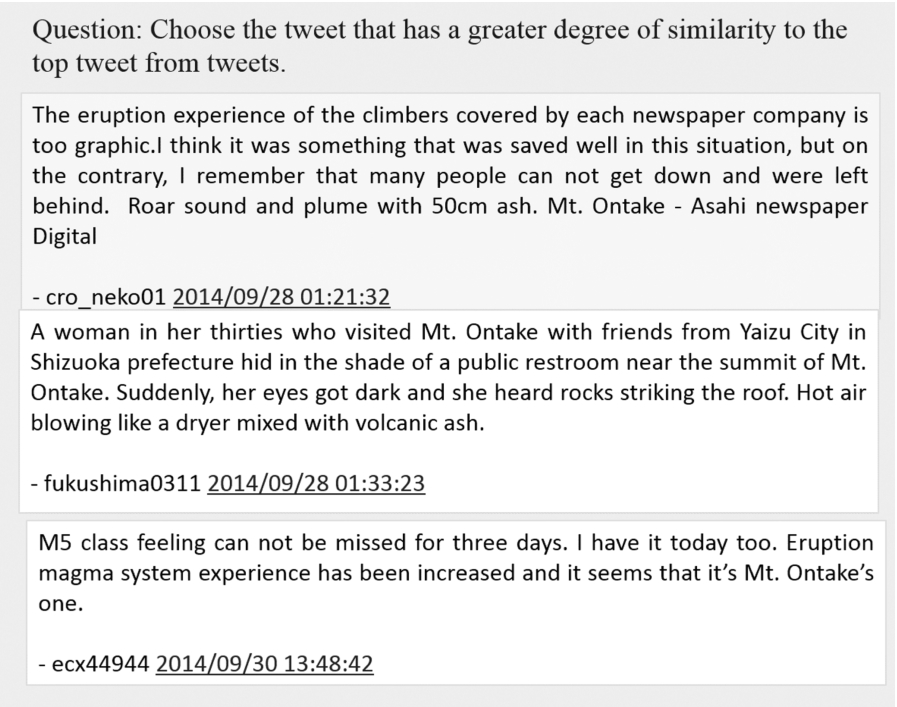
Sample screen of questionnaire survey: Mt. Ontake eruption case.
We prepared 100 triplets of tweets from one dataset for the network clustering method and 300 tasks (100 tasks × 3 datasets) and gave ten examinees the above task. If more than six examinees chose
We recruited examines from crowdsourcing services.4
The evaluation experiment result is shown in Fig. 4.

Precision of both network clustering and HDP-LDA in three datasets. X-axis shows each case. Y-axis shows precision. Asterisks ∗,
Statistical tests were performed to verify whether there is a significant difference in the precision of each clustering method.
Verification was performed using a partition table (Table 8) and we used an independent chi-squared test. Asterisks ∗,
Result of independent chi-squared test in full data evaluation
Since the network clustering method’s precision (network clustering) outperformed HDP-LDA (hdp-lda) in all cases, the non-text-based method acquired better tweet clustering performance than the previous text-based method, HDP-LDA.
Quantitative experiment
In this subsection, we evaluated robustness against data reduction. Both clustering methods (network clustering and HDP-LDA) were conducted on full and sampled data. For the sampled data, the data size was reduced to 10–90%. The clustering result of the full data was compared with the clustering result of all of the sampled data, and the comparison was evaluated using the Rand Index (RI) [18] and precision, recall, and F-values. RI measures the concordance rates of two clustering results. Table 10 shows the details of these indexes.
Details of RI, precision, and recall
Details of RI, precision, and recall
To understand burst phenomena, the critical point is the information obtained in the qualitative aspects from clustering. Therefore, the “big picture” supersedes the details. Recall is the most important index because it attaches weight to how many correct combinations of tweets in the full data are included in the sampled data. We conducted both clustering methods on each example case ten times and the values in the following figures are the means of those results.

Case of McDonald’s: index transition in method using both network clustering and HDP-LDA. X-axis shows data size. Y-axis shows each evaluation value. Data size of 90% shows a case when 10% of tweets were ignored. Data size of 100% is not 1 because we conducted identical clustering twice and compared them to data size of 100%.
The results for the McDonald’s case are shown in Fig. 5. The network clustering method (upper graph of Fig. 5) has higher robustness to data reduction than HDP-LDA (lower graph of Fig. 5). With the network clustering method, 60% of the pairs of tweets in the same cluster are also included in the same cluster even when the data were reduced to 10%. On the other hand, fewer than 40% of the same topic tweet pairs are in the same cluster when the tweets were reduced to 90% by HDP-LDA. Moreover, the network clustering method shows higher robustness than HDP-LDA from other evaluation values.
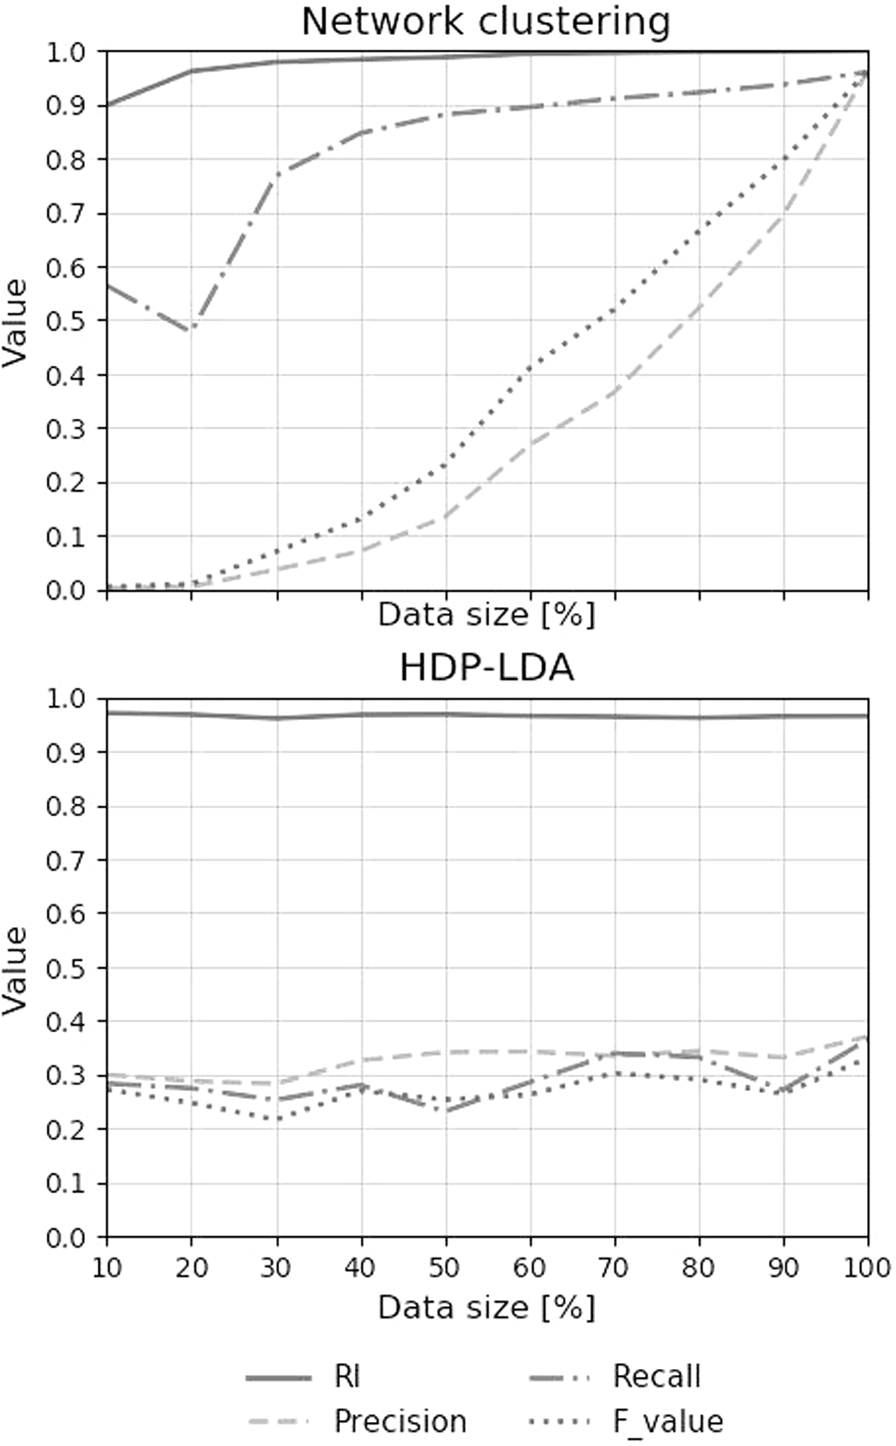
Case of Mt. Ontake eruption: index transition in both network clustering and HDP-LDA. X-axis shows data size. Y-axis shows each evaluation value.
The results for the Mt. Ontake eruption case are shown in Fig. 6. The network clustering method has higher robustness to data reduction than HDP-LDA, as in the McDonald’s case. With the network clustering method, 70% of the pairs of tweets in the same cluster are also included in the same cluster even when the data were reduced to 30%. On the other hand, fewer than 30% of the same topic tweet pairs are in the same cluster when the tweets were reduced to 90% by HDP-LDA. The network clustering method also shows higher robustness than HDP-LDA in other evaluation values in this case. Based on Figs 5 and 6, we infer that opinions about the eruption were more clearly classified than opinions about McDonald’s because the former’s recall surpassed the latter when the data size exceeded 30%.
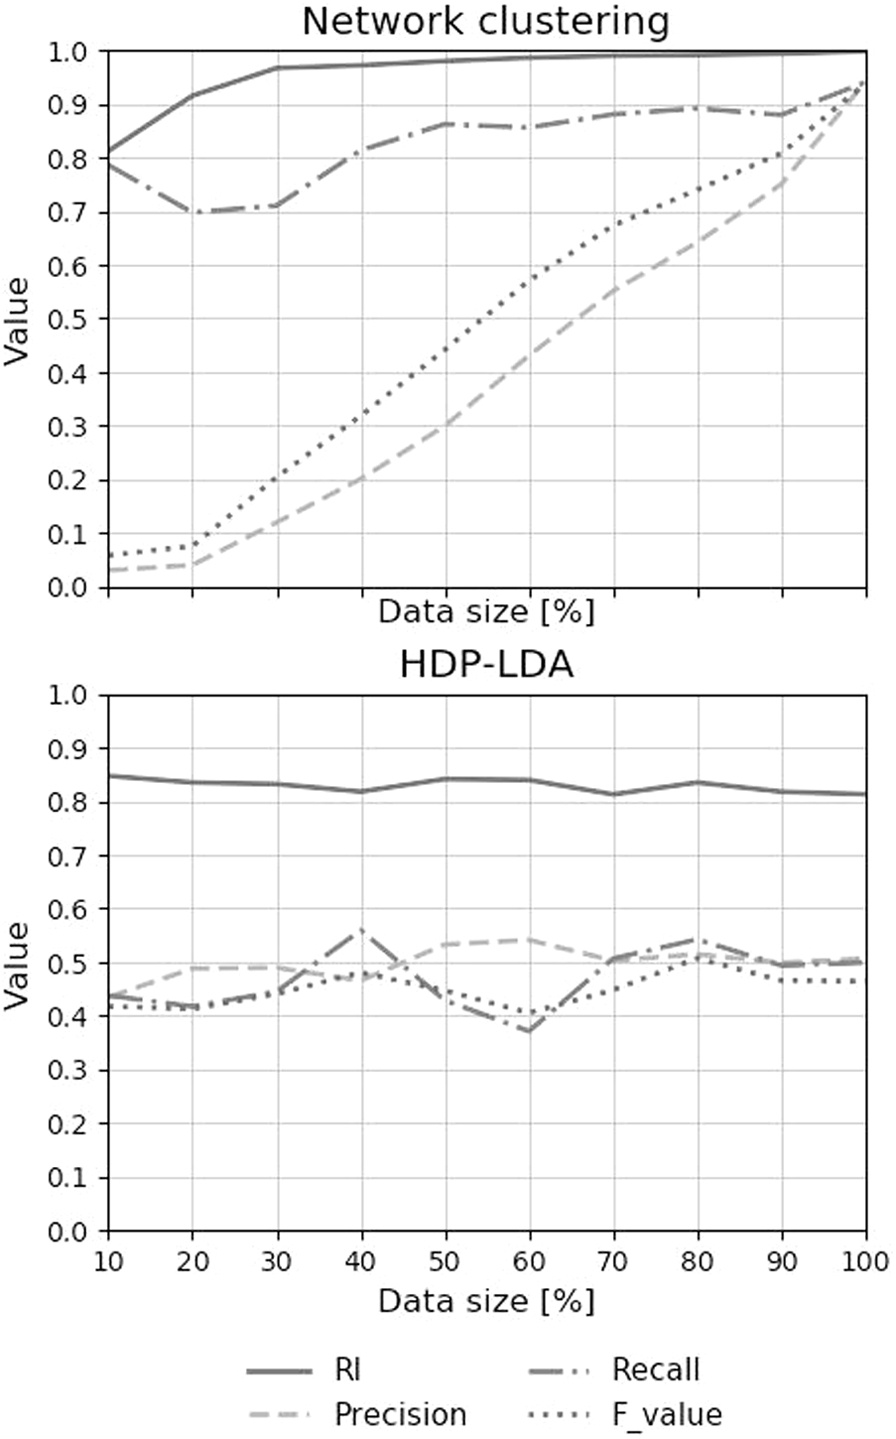
Case of ALS: index transition in both network clustering and HDP-LDA. X-axis shows data size. Y-axis shows each evaluation value.
The results for the ALS challenge case are shown in Fig. 7. With the network clustering method, 70% of the pairs of tweets in the same cluster are also included in the same cluster even when the data were reduced to 10%. On the other hand, fewer than 50% of the same topic tweet pairs remained in the same cluster when the tweets were reduced to 90% by HDP-LDA. From all these results, we conclude that the network clustering method generally has higher robustness than HDP-LDA.
We did the same questionnaire survey as in Section 5.2 to validate the propriety of the topic clusters created using a network clustering method in the sampled data. We used 75%, 50%, and 10% sampled datasets in this questionnaire survey. Since we couldn’t do the questionnaire survey in all data size, we reduced the data at 25% interval. Instead of 25% sampled dataset, we used the 10% sampled dataset because 10% sampling are used more generally than 25% sampling.
The datasets here are identical as in Sections 5.2 and 6.1.
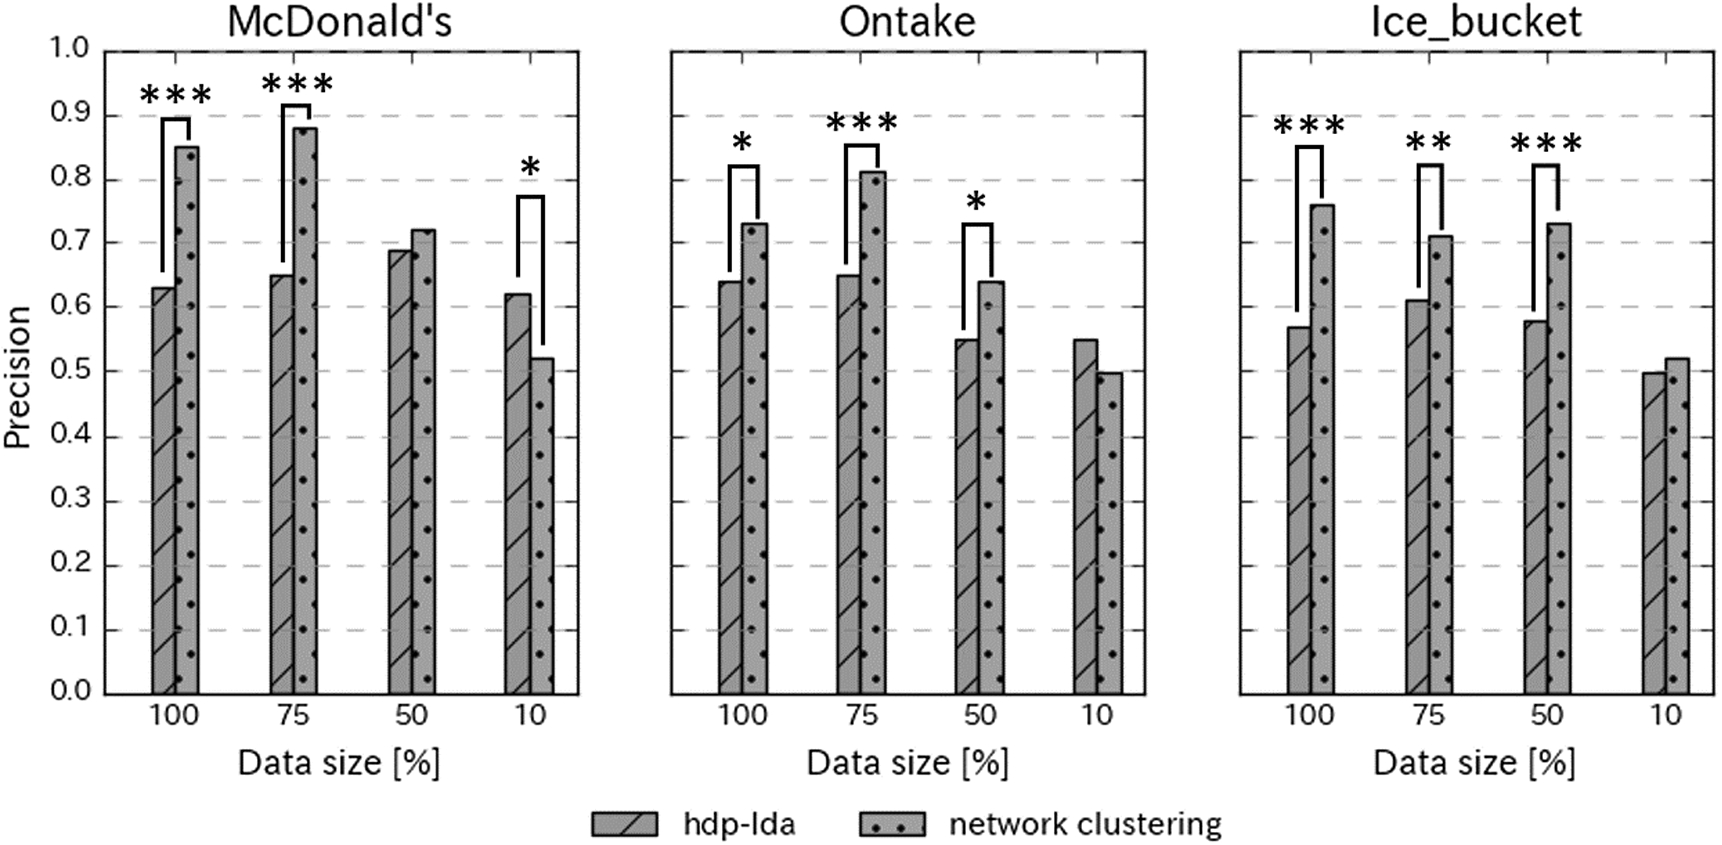
Precision of both network clustering and HDP-LDA in three datasets. X-axis shows data size and cases. Y-axis shows precision. Asterisks ∗,
The evaluation experiment result is shown in Fig. 8. In the questionnaire survey, there are two choices for each task. If we randomly choose one, the precision will be 0.5. This means that the baseline of this questionnaire survey is 0.5. The graph on the left in Fig. 8 shows the results for the case of McDonald’s. Network clustering has quite higher precision than HDP-LDA when the data size is 100% and 75%. When the data are reduced to 50%, network clustering has slightly higher precision than HDP-LDA. When the data size is reduced to 10%, HDP-LDA has higher precision than network clustering, which cannot group tweets correctly because its precision is as low as the baseline (0.5).
The graph in the middle of Fig. 8 shows the results for the Mt. Ontake eruption. Network clustering has higher precision than HDP-LDA when the data size is 100%, 75%, and 50%. When the data size is reduced to 10%, HDP-LDA has higher precision than network clustering, which cannot group tweets correctly because its precision is as low as the baseline (0.5).
The graph on the right of Fig. 8 shows the results for the ALS challenge case. Network clustering has higher precision than HDP-LDA when the data size is 100%, 75%, and 50%. When the data size is reduced to 10%, network clustering has higher precision than HDP-LDA, but neither clustering method can group tweets correctly because both of their precisions are as low as the baseline (0.5).
Discussion of quantitative experiment
RI has a high rate as a whole even in the HDP-LDA method because many pairs of tweets in different clusters are also in different clusters, even when the data are reduced to 10%. Since RI includes combinations of pairs of tweets in a different cluster in the index, it is obviously less suitable to evaluate robustness than other indices.
It is evident from the results that recall, precision, and F-value generally decrease as the data are reduced. Since we define the clustering result of the complete data as correct data and compare them with incomplete data, data reduction decreases these evaluation values. A low recall value means that many pairs of tweets in the same cluster are not included in the same cluster when the data are reduced. This means we cannot obtain the same knowledge as the complete data when the recall of the reduced data is low. A low precision value means many pairs of tweets in the same cluster of incomplete data are not included in the same cluster before the data are reduced, meaning that the cluster’s noise rate became huge in the incomplete data when the precision of the reduced data was low. Therefore, we conclude that recall can evaluate the robustness of the model against data reduction, and precision can evaluate the noise rate of the clustering results.
With the network clustering method, over 55% of the pairs of tweets in the same cluster are also included in the same cluster even when the data are reduced to 10% in all three of our example cases. So we can obtain the same knowledge from the network clustering method when the data are reduced. On the other hand, fewer than 50% of the same topic tweet pairs are in the same cluster when the tweets are reduced to 90% by the HDP-LDA method in all of the example cases. Therefore, we cannot obtain the same knowledge from the HDP-LDA method when the data are reduced. We conclude that the network clustering method is more robust against data reduction than the HDP-LDA method. For example, for the ALS results, the tweets of Korean celebrities who participated in the ALS challenge through Instagram or YouTube URLs were classified to the same cluster with the network clustering method even after the data were reduced; with the HDP-LDA method they were classified into different clusters when the data were reduced. This means that the network clustering methods can classify tweets that mainly consist of URLs (tweets with poor text information) more precisely than the HDP-LDA method when the data are reduced.
With the network clustering method, because the data were reduced, the value of precision decreased to more than 0.5 when the tweets were reduced to 80%. On the other hand, the HDP-LDA method’s precision is less than 0.55 when the tweets were reduced to 90%. Since the HDP-LDA method’s precision decreased more gradually than the network clustering method’s precision, the noise rate against data reduction is higher with the HDP-LDA method than with the network clustering method when the data reduction is slight, but the relationship is reversed when the data are reduced to under 80%. If the value of precision falls below 0.5, noise will dominate the clustering results. Hence, for the practical use of network clustering methods, collecting more than 80% of the complete data is ideal. However, we cannot recommend the HDP-LDA method for clustering because its noise rate doesn’t exceed 0.55 even when the data are reduced to 90%.
From the recall results, we conclude that the network clustering method, which is a non-text-based scheme, provides better efficiency in robustness than the HDP-LDA method, which is a text-based method. From the precision results, we conclude that the noise rate against data reduction is higher in the HDP-LDA method when the data reduction is small and higher in the network clustering method when the data reduction is large. Since the HDP-LDA method generally has a high noise rate and low robustness when the data are reduced, it is difficult to use it for practical clustering analysis. Since the network clustering method has very high robustness even if the data are reduced, we can use it even if the size of the data isn’t too large. However, it is ideal to collect as much data as possible because the noise rate increases as the data are reduced.
Furthermore, in all of the example cases, the recall and precision values and the F-value of the HDP-LDA method are less than 0.51 when the tweets aren’t reduced (data size is 100%). Therefore, the HDP-LDA method is an unstable scheme. Since these three indices exceed 0.75 in the network clustering method when the tweets aren’t reduced, it is more stable than the HDP-LDA method. In other words, using the network clustering method is more practical than using the HDP-LDA method because the former method has more reproducibility in its clustering results than the latter.
Based on the results of the network clustering method, we infer that opinions about the eruption and ALS were more clearly classified than opinions about McDonald’s because the recall of the former was higher than the latter when the data size exceeded 30%. This means that not all of the cases have clearly divided opinions; some have similar opinions. The accuracy of the clustering results depends on example cases (to some extent), and we suggest that lower recall in some cases does not denote that the network clustering method has low efficiency.
Discussion of questionnaire survey
We performed statistical tests to verify whether there is a significant difference in the precision of each clustering method. As in Section 5.3, we performed verification using a partition table (Table 8) and an independent chi-squared test. Asterisks ∗,
Case of McDonald’s: result of independent chi-squared test
Case of McDonald’s: result of independent chi-squared test
The results for the McDonald’s case are shown in Table 11. When the data size either wasn’t reduced or was reduced to 75%, it gave a significant difference at the 10% level between the two clustering methods. In these data sizes, the network clustering had significantly better precision than HDP-LDA. When the data size was reduced to 50%, it gave no significant difference between the two clustering methods. When the data size was reduced to 10%, HDP-LDA had significantly better precision than network clustering at the 1% level.
Case of Ontake eruption: result of independent chi-squared test
The results for the Ontake case are shown in Table 12. When the data size was reduced to 75%, it gave a significant difference at the 1% level between the two clustering methods. When the data size wasn’t reduced or was reduced to 50%, it gave a significant difference at the 10% level between the two clustering methods. In these data sizes, the network clustering had significantly better precision than HDP-LDA. When the data size was reduced to 10%, it gave no significant difference between the two clustering methods. In this data size, network clustering and HDP-LDA have no difference in precision, which was as low as the random model (whose precision is 0.5).
Case of ice_bucket: result of independent chi-squared test
The results for the ice_bucket case are shown in Table 13. When the data size was either reduced to 50% or wasn’t reduced, it gave a significant difference at the 1% level between the two clustering methods. When the data size was reduced to 75%, it gave a significant difference at the 5% level between the two clustering methods. In these data sizes, network clustering had significantly better precision than HDP-LDA. When the data size was reduced to 10%, it gave no significant difference between the two clustering methods. In this data size, network clustering and HDP-LDA had no difference in precision, which was as low as the random model.
Almost all the data sizes produced a significant difference between the two clustering methods. When the data size either wasn’t reduced or was reduced to 75% or 50%, the network clustering had significantly better precision than HDP-LDA in most cases. When the data size was reduced to 10%, HDP-LDA sometimes had better precision than network clustering, but in most cases, both methods had low precision like the random model. In some cases, there was no significant difference in these two methods. Based on the other cases, however, network clustering outperforms HDP-LDA.
We sorted all three results in Section 6.2 by the absolute quantity of tweets and show the results in Fig. 9. The data of each method were fitted by linear regression. The regression and determination coefficients are shown at the bottom of Fig. 9.
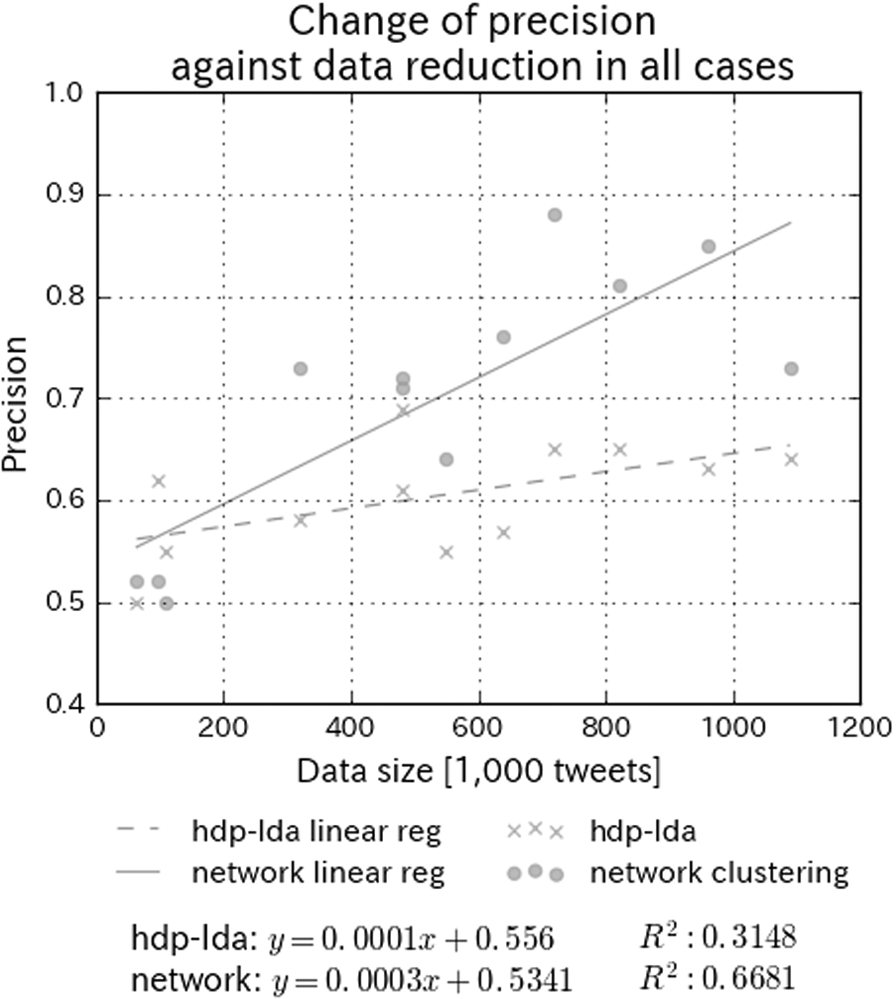
Precision of both network clustering and HDP-LDA in three datasets sorted by absolute quantity of tweets. X-axis shows data size (absolute quantity). Y-axis shows precision. Data of each method are fitted by linear regression.
The precision of the network clustering method generally decreases as the data are reduced. With the network clustering method, because the coefficient of determination has a high value, there is a correlation between data size and precision. The precision of HDP-LDA also generally decreases as the data are reduced. But with HDP-LDA, because the coefficient of determination isn’t a high value, there isn’t always a correlation between data size and precision.
From Fig. 9, we infer that the precision of the network clustering method increases as data are increased. On the other hand, when the data size doesn’t exceed 100,000 tweets, we cannot classify tweets correctly because in most cases the precision of each method doesn’t exceed 0.6. We conclude that 100,000 tweets are necessary to correctly classify tweets.
To understand people’s thoughts and feelings, we must classify their opinions from burst phenomena on such social media sites as Twitter. Therefore, classification methods that categorize tweets are critical. However, since most classification methods focus on text mining, they cannot group tweets by topics because each tweet has poor linguistic similarities. We used a non-text-based classification method proposed by Baba et al. that groups tweets by topics even if they have poor linguistic similarities and verified its validity by comparing it with a text-based classification method in two different evaluations: qualitative and quantitative. We performed these two evaluations on both a text-based method and a non-text-based method.
In full data evaluations, we validated the suitability of the created topic clusters using non- and text-based methods by questionnaire surveys. In three example cases, our results clearly show that the non-text-based method (the network clustering method) achieved better tweet clustering performance than the previous text-based method (HDP-LDA). Therefore, in qualitative aspects, the clustering results of the network clustering methods will be easier to interpret than the results of the text-based method, HDP-LDA.
In sampled data evaluations, we evaluated the robustness and the correct rates of the tweet clustering methods against data reduction. In our evaluation of robustness against the data reduction part, the network clustering method, which is a non-text-based approach, had higher robustness in three example cases than the HDP-LDA method. We conclude that the robustness of the network clustering methods differs based on the case, but they generally have higher robustness than HDP-LDA methods. When the scale of the burst phenomena increases, the collection failure rate also becomes larger. In such cases, using network clustering, we obtained tweet clusters with higher accuracy.
In our evaluation of the correct rate against the data reduction part, we conducted a questionnaire survey, and the network clustering method had a higher accuracy rate than the HDP-LDA method. When the data size was 50% or more, there was a significant difference between the precision of the two methods in most cases and network clustering had significantly better precision than HDP-LDA. We infer that the precision of the network clustering method improves as the amount of data increases.
The network clustering method is more effective than the text-based method for both interpretation and data reduction for Twitter analysis. When the data size doesn’t exceed 100,000 tweets, it is difficult to classify tweets correctly because the precision of both methods in most cases fails to exceed 0.6. We conclude that 100,000 tweets are necessary to correctly classify tweets.
Future work must resolve the following issues. Improving the network clustering performance is critical. In this research, the network clustering method only used retweet networks to classify tweets, but we might also use Twitter’s favorite function to link users and tweets because it also reflects each user’s interests. If such links increase in the dataset, we can infer that the precision will improve in network clustering, although the tweet number doesn’t change.
Using text information for clustering will also improve the network clustering performance. With network clustering, the clustering results of tweets will reflect more information about which user is in which community than HDP-LDA because retweet networks are used for clustering. Even if similar posts are found in different communities, they won’t be classified to the same cluster if they didn’t spread to all these communities. To classify tweets more strictly, such tweets must be classified to the same cluster. In this research, there was a process part (Section 4.2) to allocate information ids to each identical piece of information. We allocated information ids to groups of tweets that obviously have identical information. But if we could allocate identical ids to tweets that are semantically similar but textually different, we could allocate identical ids to the tweets that have the same information but aren’t posted in the same communities.
These future works will improve the network clustering performance, and we can decrease the required data size for correct clustering results.
In some burst examples, datasets include many tweets posted by bot accounts. We must detect and completely remove tweets from bot accounts because they are noise that obfuscates understanding about how burst examples are accepted by users in the Twitter sphere.
On the other hand, by analyzing bots in the burst phenomenon we can obtain new knowledge about bots. We can remove tweets which aren’t posted by bot accounts from datasets and cluster these tweets only by bot accounts.
Finally, based on the similarity of users who are interested in tweets, the idea of clustering them using retweet relationships can be adapted to other classification algorithms. We must compare the network clustering method with other clustering methods, such as non-text-based classification.