
Abstract
Introduction
Throughout the years there have been many attempts to measure and categorize the range of human body variation. Although all human bodies share a common structure regardless of age, race, and gender, there are some critical differences. Ever since the time of the ancient Greeks that the human morphology has been studied to classify people predisposed to certain illnesses. Currently, datasets on the size and shape of human body are still limited. Most data used by safety and ergonomics researchers were drawn from anthropometric studies of military personnel, a subset of populations that is quite different from the general population. Nevertheless, nowadays, there are a growing number of anthropometric databases attempting to represent the characteristics of entire populations [1–4].
Traditional manual methods of collecting anthropometric data are time-consuming, expensive and error prone. Moreover, traditional methods involve the use of standardized postures [5], with the distance between body landmarks (often bony points, such as the acromion and patella) being measured using a wide range of equipment. In addition, the standardized postures required for the measurements to be taken assume the person being measured can adopt and maintain a specific position throughout the measurement process. Issues regarding the manual measuring process are: (i) the changes in body posture as the study participant becomes fatigued from standing in one position; (ii) the variations in the amount of pressure of the tape; and (iii) the identification of the location of the body landmarks in the participants’ body by the investigator. Locating the required body landmarks can be a difficult task. This may be especially problematic in people with more body fat over the bony landmarks [6], or people in wheelchairs where it can be hard to gain access to the required landmarks [7]. There are several factors that have been pinpointed by Yu [8] as the ones that affect data precision the most, namely: (i) posture; (ii) identification of landmarks; (iii) instrument position and orientation; and (iv) pressure exerted by measuring instruments.
Nowadays, it is more common to acquire anthropometric data using systems that rely on new measurement technologies that also allow the capture of complex geometrical features such as curvatures and partial volumes in additional to the traditional linear measures [9–11]. There are several types of imaging techniques to create full body images, that include 2D video silhouette images converted to 3D models, white light phase based image capture, laser-based image capture, and radio-wave linear array image capture [12, 13]. It is possible to find many research studies that compare the various types of existing body scanners. Jones and Rioux [14], Daanen and van de Water [15], Olds and Honey [6] and discuss the use of 3D whole body scanners in anthropometry overall, giving a good overview of the evolution of body scanning technology and the different scanners in use at various times. Olds and Honey [6] affirm that scanners using white light are generally faster and cheaper than laser scanners, but often produce lower quality scans, with areas of data missing. Despite concluding that body scanners have drawbacks (they are expensive, require technical expertise, and cannot measure skin-folds or compressed bone lengths) they agree that body scanners offer the ability to collect greater amounts of data, extract data when the subjects are no longer present and use the data directly in computer-aided design software applications. McKinnon and Istook [16] compared two white light scanners available at that time from TC2, finding that the newer scanner was an improvement on the older scanner, producing data that replicated more closely the data obtained using traditional measurement methods. They also anticipated that the extraction of fast and accurate anthropometric data would be possible in the near future, as it is using current scan technologies.
When it comes to three-dimensional body scanners for anthropometric data collection purposes, the assessment of its reliability is very important [17, 18]. Park et al. [19] studied the optimal postures, positioning, and reliability issues for human body scanning. In a study of reliability of 3D anthropometry, Daanen et al. [20] reported that a pointer stabilizing the head reduced the magnitude of sway by 50%. Choi and Ashdown [21] stated that the reliability of body surface measurements using a properly calibrated 3D scanner is generally acknowledged to be better than traditional direct measurements if scan variables are properly controlled, primarily for accurate landmarking and body positioning.
As currently the use of anthropometric data gathered using body scanners is exponentially increasing in applications ranging from clothes to everyday-life products, it is important to understand the reliability and precision of the equipment used. There are several studies comparing the results obtained using traditional methods with 3D scans for anthropometric data collection. Feathers et al. [22] affirmed that there were some small systematic differences in measurements taken with conventional methods and electromechanical methods and that the reliability of the electromechanical method was comparable to, but not better than the conventional method. Wang and Chao [23] tried to find constant body ratio benchmarks, sorted by gender and age, that could be used for the dimensions difficult to be measured in scans, that involve other easily identified and measured body dimensions. Bougourd et al. [24] and Brooke-Wavell et al. [25] reported that measurements by 3D scanning and traditional anthropometry were generally similar on many key items. Lee and Ashdown [26] found that although body height and length measurements from the scanner tended to be shorter, and that girths tended to be larger than those derived using traditional measures, the only significantly different measurement was the neck base girth. Zwane et al. [27] found that manual measurements were generally smaller than the extracted measurements from the scans, primarily due to compression of soft tissues and possibly participants breathing during manual measurements. This latter aspect was also discussed by Daanen et al. [20] when suggesting that asking the subject to adopt standard posture and to hold their breath while scanning can help to minimize the effect of body movement and error in the measurements.
Several studies tried to test the reliability of the data acquired using different body scanners by comparing the manually extracted data and the scan derived data [7, 38]. Bradtmiller and Gross [28] used a Cyberware WB4 system with a laser light source to evaluate the reliability of scan-derived measurements using a sample size of 123 participants, each scanned three times. Han et al. [29] also tried to identify the differences between manual measurements and measurements obtained with a Cyberware WB4 scanning system, concluding that the largest differences between scanner and traditional measurements was in the torso circumferences and that the difference in measurements increased as body mass index increased for most circumferences. The work of Lu and Wang [30] compared scan-derived measurements (obtained using a Vitronic Vitus-3D 1600 scanning system with a laser light source) with manual measurements in terms of reliability and precision. The results obtained failed to meet the ISO 20685 [31] criteria but were valid for use in apparel applications. Sims et al. [7] studied data from a TC2 white light 3D body scanner and a sample of 103 participants. The results showed that only two body measurements (shoulder breadth and abdominal depth) were outside of the ISO 20685 limit and showed no significant differences between the scan-derived measurement and the manual measurement.
In this paper we present a comparison of the anthropometric data collected using traditional methods and using a Kinect® based body imaging system (KBI) that was developed at the University of Texas Austin (UT) (UT invention codes: 6510-XU and 6130-XU). The purpose is to understand if the traditional measurements can be replaced by the ones gathered using the KBI., i.e., if the automatic data collection system can give results that are reliable and sufficiently close to the ones produced by manual methods. To do this, the values of the mean absolute difference between the two methods are compared with the maximum allowable difference defined in the ISO 20685 [31]. Apart from the comparison of the results in human participants, the same tests were performed using a mannequin, in order to understand if the differences between the two methods were the same when factors related to body sway, breathing, and variations in body position were not present.
Materials and methods
Participants
Thirty-seven participants, 17 females and 20 males, aged from 18 to 30 years old (24.03±2.96) participated in this study. The selection of this age range was based on the assumption that there would be more similarities regarding average body shapes, history of medical problems and other age enforced conditions. This procedure narrowed the range of variation in the results of this study. Table 1 shows the characteristics of the sample population studied (Mean±Standard Deviation).
Characterization of the sample (in years, mm and kg)
Characterization of the sample (in years, mm and kg)
To participate in this study, participants were contacted via e-mail or in person. Prior to the study, all the participants were informed of the detailed procedures and requirement of the test.
In order to improve the reliability of the measurements, each participant was measured five times using manual methods and five times using the 3D scanner.
The participants wore their own underwear for the measurement process. It was important that the underwear was form fitting, but not compressive so that it did not affect the shape of the body parts to be measured. In the cases where the participants did not have appropriate underwear, garments were provided (based on the appropriate clothing defined in ISO 20685). Furthermore, during the measurements the participants were asked to hold their breath and to maintain their posture as steadily as possible.
Additionally to the human participants, this test was also conducted on a mannequin. As a mannequin is a rigid body that resembles a real human, for research purposes, it can be seen as a human participant able to maintain a steady and stable posture without any movement. The mannequin was also dressed in form-fitting underwear. As for the human participants, each body dimension was collected with five repetitions of each method.
Prior to the trials, participants were given a brief description of the study. Before starting the measurements, the process was explained to the participants so that they would know what they could expect from each measurement procedure. The participants were also informed that the measurements would not be accurate if made over clothing and therefore they would be measured and scanned in their underwear.
In the cases where the participants were not wearing undergarments or if their underwear did not fit closely, they were offered a clean undergarments in their size. After that, the participants were asked to complete a short demographic questionnaire requesting their age, profession, any history of medical problems and their fitness habits.
As analyzing all the possible body measurements would be an unrealistic task, a set of ten basic body measurements were selected for this study. These measurements are presented on Fig. 1.
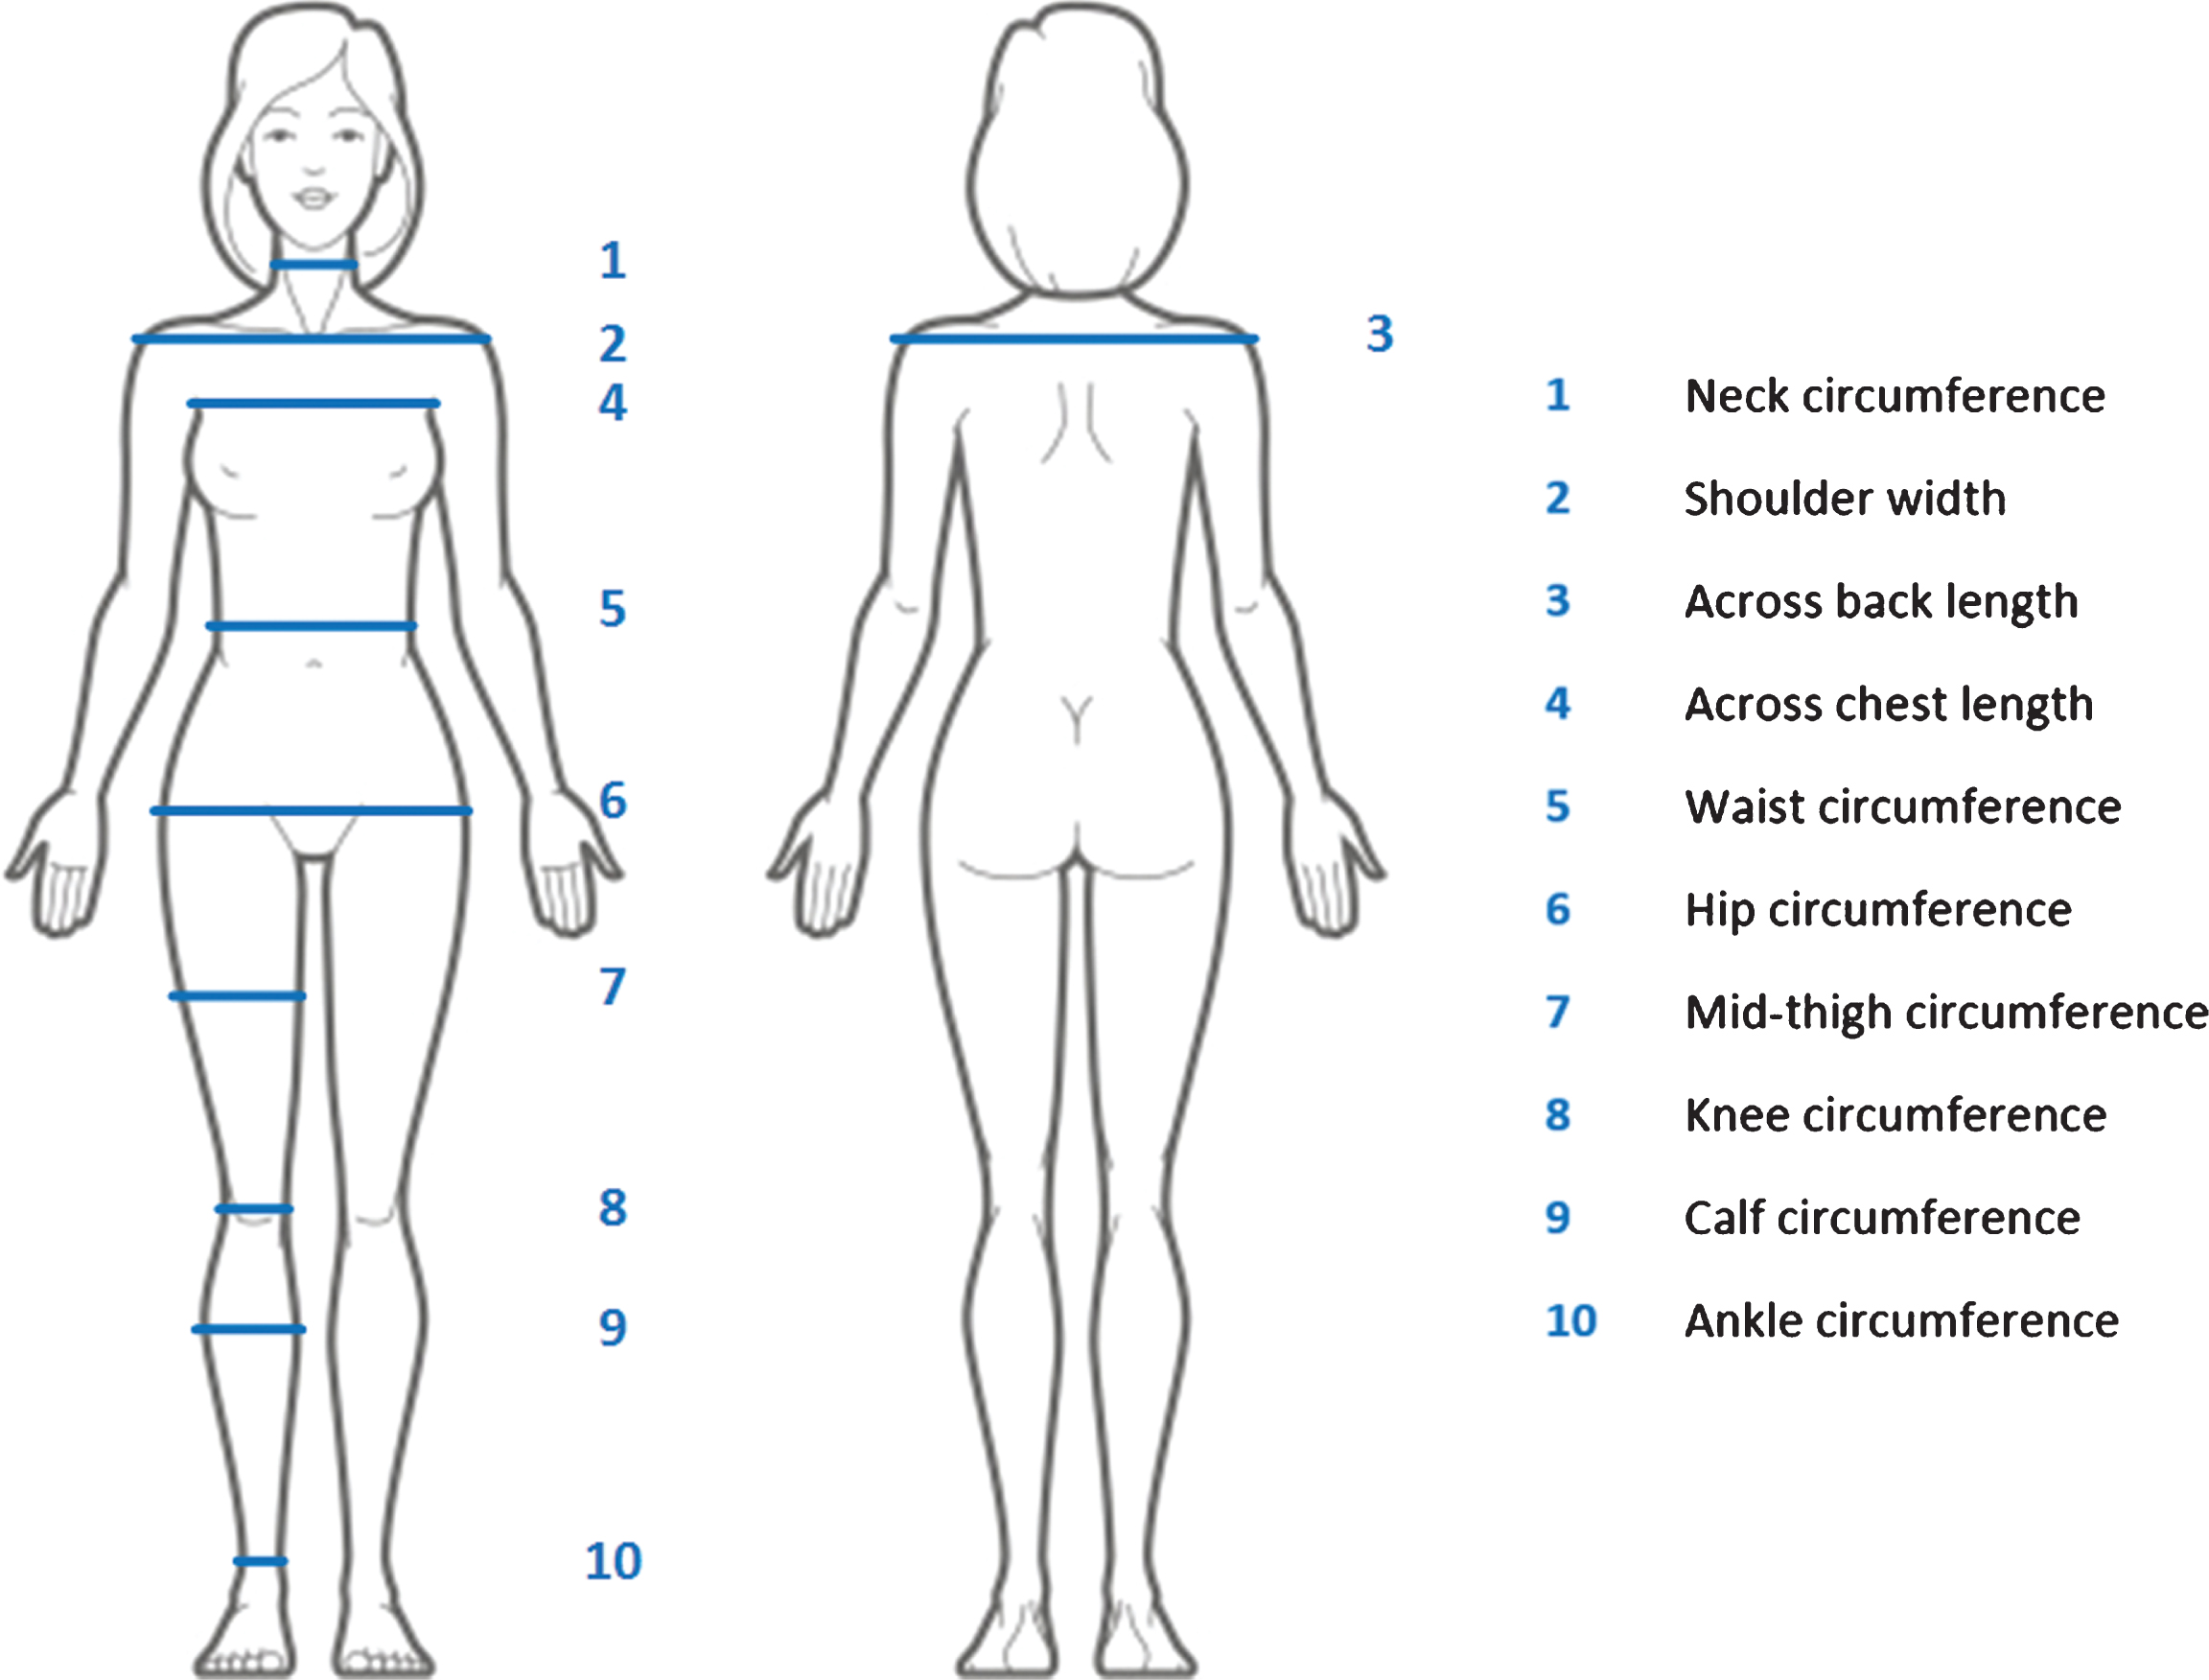
Body measurements used in this study.
The KBI system used in this study includes four Microsoft Kinect sensors to acquire 3D data clouds of front and back surfaces of a whole body, and the 3D body modeling and measurement software [8, 32]. This system was selected not only because it was the only body scanner available at the time but also due to the fact that this systems had not yet been validated and tested before.
Through precise registration of the images captured by each device, the front and back views of the body can be merged and reconstructed to form a smooth and complete digital model that is scalable and rotatable on the computer screen (Fig. 2). The registration process is only done when the sensors are set up for the first time after moving. The calibration target used consists of two rectangular frames mounted on top of one another so that the corners are easy detected in the 3D surface. This system provides both hardware and software for 3D body imaging, which is quick (<4 s imaging time), portable (on stands), compact (2 m×1.5 m footprint), relatively accurate and economical. KBI has a viewing volume of 2 m×1 m×0.8 m (height×width×depth), and outputs circumferences, lengths, heights and angles at many automatically-detected landmarks. The landmarks are modifiable manually on the screen if they are not in good accord with visualassessments.
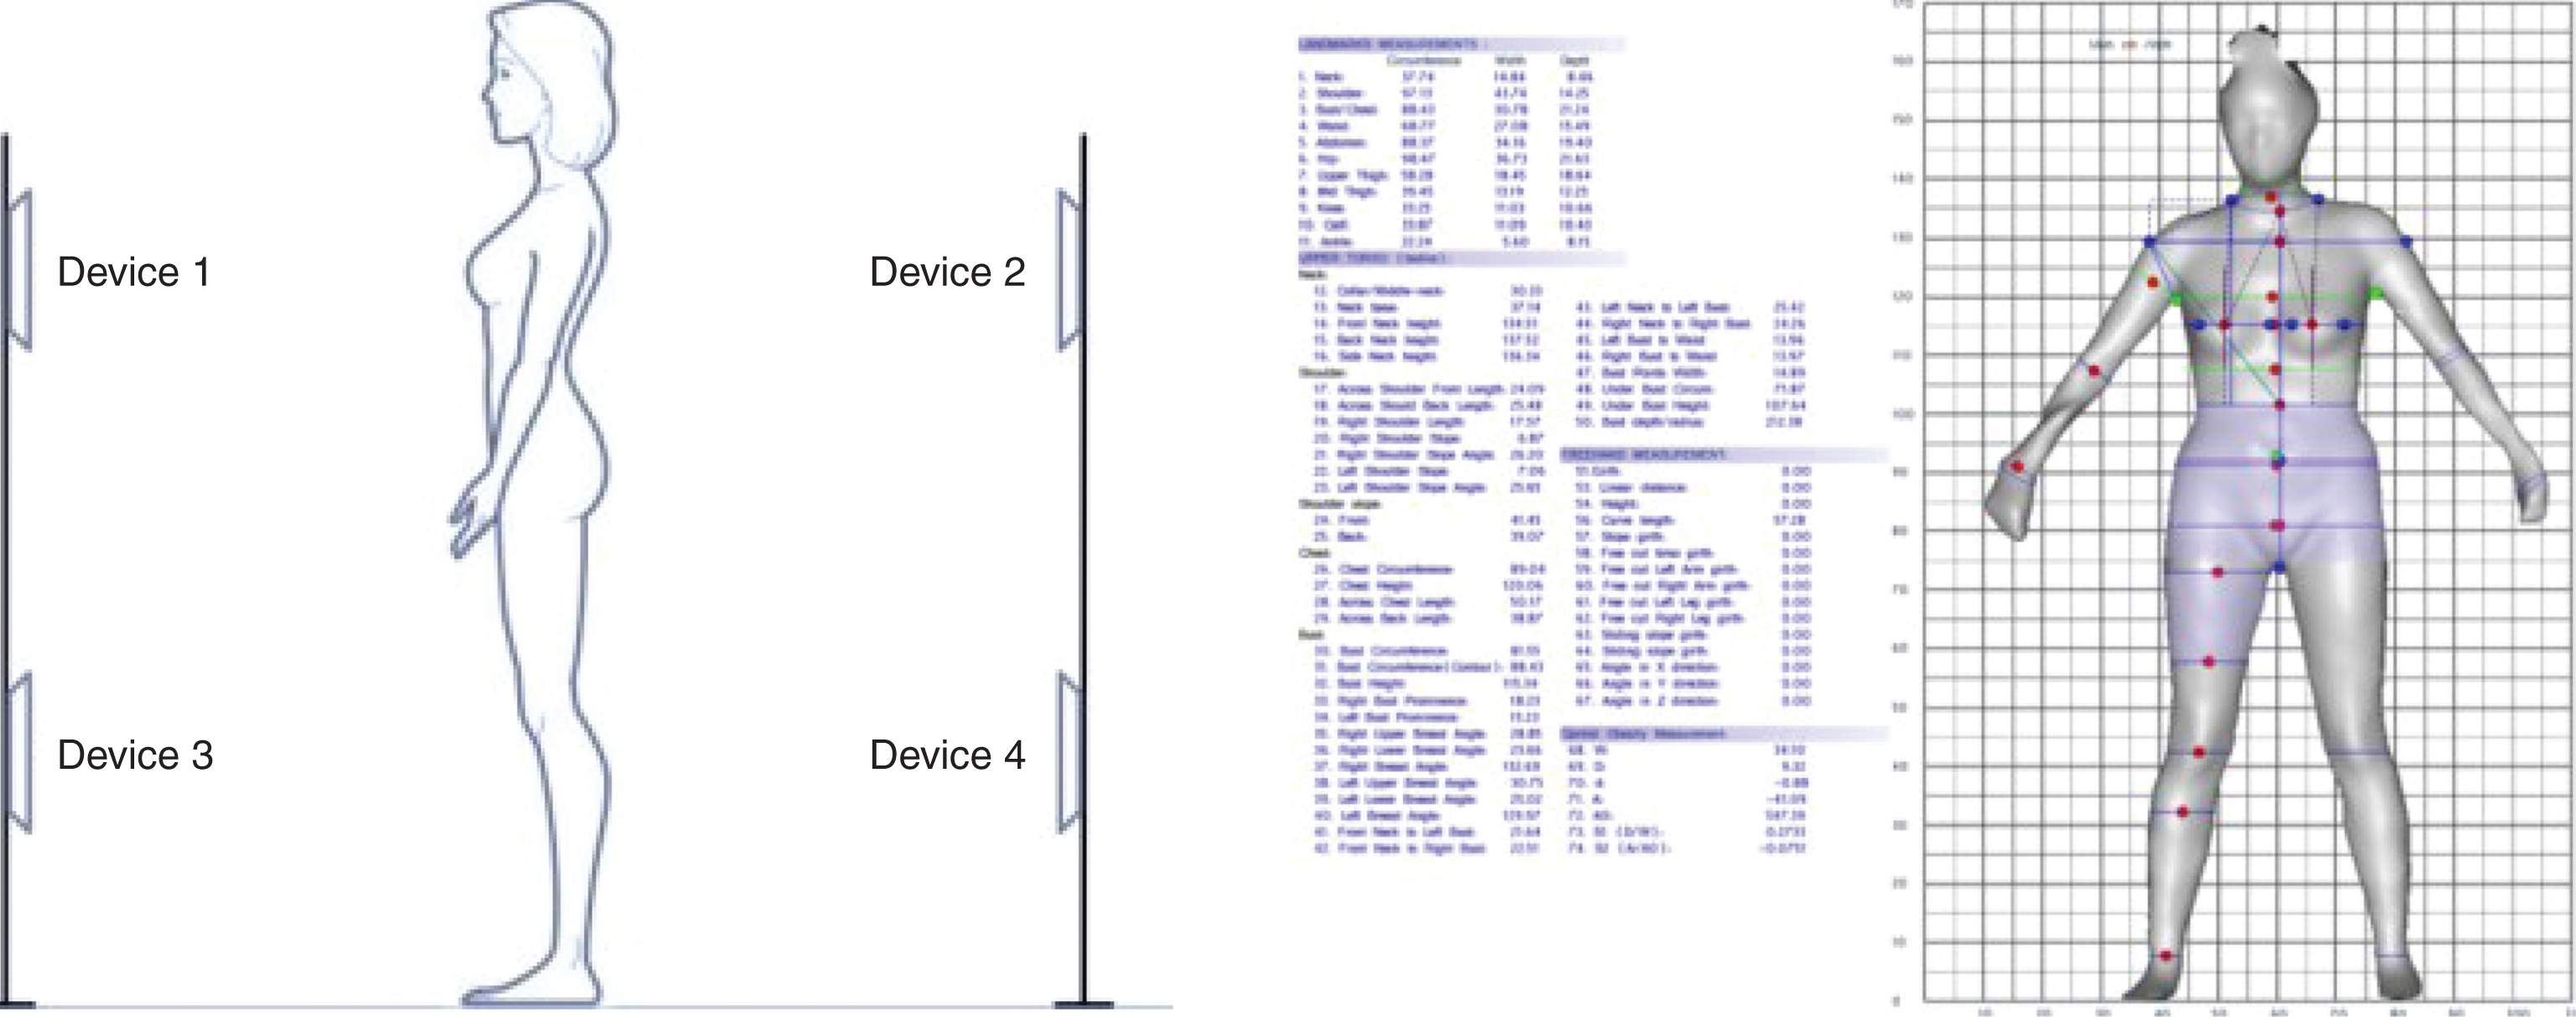
KBI Configuration and software interface.
For the manual measurements participants were asked to adopt the exact same posture, in order to avoid variation in results caused by dissimilar postures. Before starting the manual data collection process, it was necessary to identify the body landmarks that would be needed for the study, since this minimizes repetition error. A green marker was used to draw a small line at the appropriate landmark locations. The methods used for traditional data collection used were the ones described in the ISO 7250 [5] and the ISAK Manual [33], e.g., the cross-hand technique for measuring circumferences.
A measuring tape, instead of an anthropometer, was used to measure widths and lengths at landmarks in a way similar to that used in KBI, that is, the width and length were measured by following the contour of the body instead of measuring the straight distance between points.
According to the ISAK Manual [33], the measurements should all be taken from the right side of the body. In fact, the software is already preset to do this. Accordingly, the manual measurements were also taken from the right side of the body.
Five repetitions of every measurement were done, both for the manual measurements as for the 3D scanning. The participants were first measured all five times automatically (five scans) and then all five times manually with the ten body dimensions measured always in the same sequence. Between each measurement the participants were able to relax and then go back to the measuring posture.
As the participants were scanned in an undressed state, it was important to ensure their privacy. Therefore, the scanner was located in an enclosed area, surrounded by a black opaque curtain. All the measurements, both automatic and manual, of dressed and undressed participants were taken in this area.
The default automatic body dimensions that can be obtained with the automatic measurement extraction software from the 3D scanner reflect the fact that this system was mainly developed for the clothing industry [34, 35]. Many of the predefined measurements are similar to the ones that would be obtained by a tailor’s measuring tape, such as, waist height or hip circumference. However, some of these predefined measurements can also be used in other types of studies, such as this one. Additionally, the measurement extraction software also allows the extraction of other measurements that are not predefined. In this case the measurements taken that were not predefined were: (i) the shoulder width; (ii) the across chest length; and (iii) the across back length.
To verify if there were any abnormal data that needed to be excluded from the analysis the following rule was applied: values smaller or greater than the mean difference between the manual measurements and the scan-derived measurements plus or minus three standard deviations are abnormal and discarded (mean difference±3 σ). After that, the data analysis was done using the statistical software SPSS.
A parametric paired samples t-test was used to compare the data extracted from the manual methods with the data from the scanner, with the significance level set at 0.05 (α= 0.05). This type of test requires that the sample follow a normal distribution. Therefore, it was first verified if the sample indeed follows a normal distribution. For the human participants it was used the Kolmogorov-Smirnov test (N > 30) and for the mannequin it was used the Shapiro-Wilk test (N < 30). In this test the random variable used was the difference between the mean of the five manual measurements and the mean of the five scan-derived measurements for each body location. The hypothesis defined was: there is no significant difference between the means of the manual measurements and the scan-derived measurements.
Additionally, the Mean Absolute Difference (MAD) between the manual measurements and the scan-derived measurements was also calculated for each body dimension. These values were then compared with other previous studies that used different scanners and with ISO 20685. The comparison with the ISO 20685 is very important since it allows to understand if the 3D system can give results sufficiently comparable to the manual methods (defined in ISO 7250) and therefore that may be used to produce reliable anthropometric databases with standards relying on the protocols defined at ISO 7250. To calculate the MAD the formula presented in Equation 1 was used.
Where,
X ij – jth scan-derived measurement of the ith participant.
Y ij – jth manual measurement of the ith participant.
n – number of participants.
r – number of repetitions.
Comparison between manual data and scan data
After checking the results for any abnormal data, it was determined that no data needed to be excluded. The data normality test also suggested that the data follow a normal distribution. The means and standard deviations of the measurements of all the 37 participants are presented in Table 2.
Means and standard deviations of the measurements (in mm)
Means and standard deviations of the measurements (in mm)
The results of the paired-samples t-test are presented in Table 3. The measurement that presented a statistical significant difference (with a p < 0.05) are marked with a *.
Results of the paired-samples t test to compare manual dataand scan data
*Significant difference (Sig. <0.05).
Although not all measurements considered in this study were available in the previous studies analyzed, it was still possible to make some comparisons. Table 4 shows the results obtained in all the five references considered for thisanalysis.
Comparison of the MAD values (in mm)
Comparison of the MAD values (in mm)
The results of the paired-samples t-test for the difference between manual measurements and scan-derived measurements performed using the five repetitions taken from a female mannequin are presented in Table 5. The measurement that presented a significant difference are asterisked.
Results of the paired-samples t test to compare manual data and scan data in the mannequin
Results of the paired-samples t test to compare manual data and scan data in the mannequin
*Significant difference (Sig. <0.05).
The MAD values for human participants and the mannequin can be compared with each other and with ISO 20685 in Table 6.
MAD for humans and for the mannequin (in mm)
The evolution of body scanning technology makes the use of traditional methods for anthropometric data collection less popular, as they are more time consuming, expensive and tedious. The future trend seems to be replacing traditional anthropometry with very powerful 3D scanning methods. However, it is important to question which of the available scan technologies are most effective, and to what extent the body scanner should be used.
There are many research papers that prove that the currently available body scanners are not yet ready to replace the traditional anthropometric collection methods, when it comes to creating highly reliable anthropometric databases (having as a guide the ISO 20685). Nevertheless, the data acquired with these automatic methods is still very convenient and can be used for purposes that require a lower precision, such as the apparel industry. That is why most of the body scanners on the market are predefined to take measurements that are used in the apparel industry.
Another great advantage of these computerized methods is the ability to store virtually unlimited data and to re-process the measurements after the participant is gone. One ten-second scan makes possible the extraction of thousands of body measurements, whilst with traditional methods, the gathering of this amount of data would take several days. Therefore, what is important to consider is the end use of the data, and the precision level desired, making the traditional anthropometry still the most appropriate method, depending on the application. As such, for ergonomic purposes, where the levels of precision and reliability needed are very high, the use of 3D body scanner instead of traditional methods is very questionable and needs some further analysis.
In this study, as highlighted by the results of the comparison between the manual and the scan-derived measurements, the only three body dimensions, out of ten, that had no significant difference between the two methods were (i) the neck circumference, (ii) the calf circumference, and (iii) the across chest length. The remaining measurements present significant differences between the two methods, with p values lower than 0.001, i.e. p < 0.05. These dimensions with no significant difference are measurements with relatively small values and easily identifiable body landmarks, which makes the measurement process simpler. These three body locations do not usually present large amounts of body fat, which can be translated in a more reliable measurement when using the traditional measuring tape techniques.
Contrarily to what usually happens in body locations that have more surrounding fat and lack of obvious landmarks for measuring, where the measuring tape compresses the soft tissues, in the more muscled zones, the tape more easily follows the contour of the body. This compression caused by the measuring tape, or other traditional anthropometry equipment, is not applicable to the 3D body scanner, as already discussed and pinpointed as one of the main causes of the differences between the two methods (for example in Mckinnon and Istook [16] and Sims et al. [7]). The fact that these are small circumferences also facilitates the measuring process in manual methods, as the investigator can see the entire area to be measured and can more easily place the measuring tape perpendicular to the long axis of the body part. Also related to this, is the lack of experience of the investigator conducting the analysis, both with traditional methods and with 3D body scanners. As such, it is highly recommended that the person performing, at least, the manual measurement is a certified and/or an experienced anthropometrist, so that the measurements are more reliable.
In comparison with the maximum allowable difference defined in the ISO 20685, the differences obtained in this study are much higher than recommended. Figure 3 shows a graphical representation of the differences between the results of this study and the ISO 20685 reference.
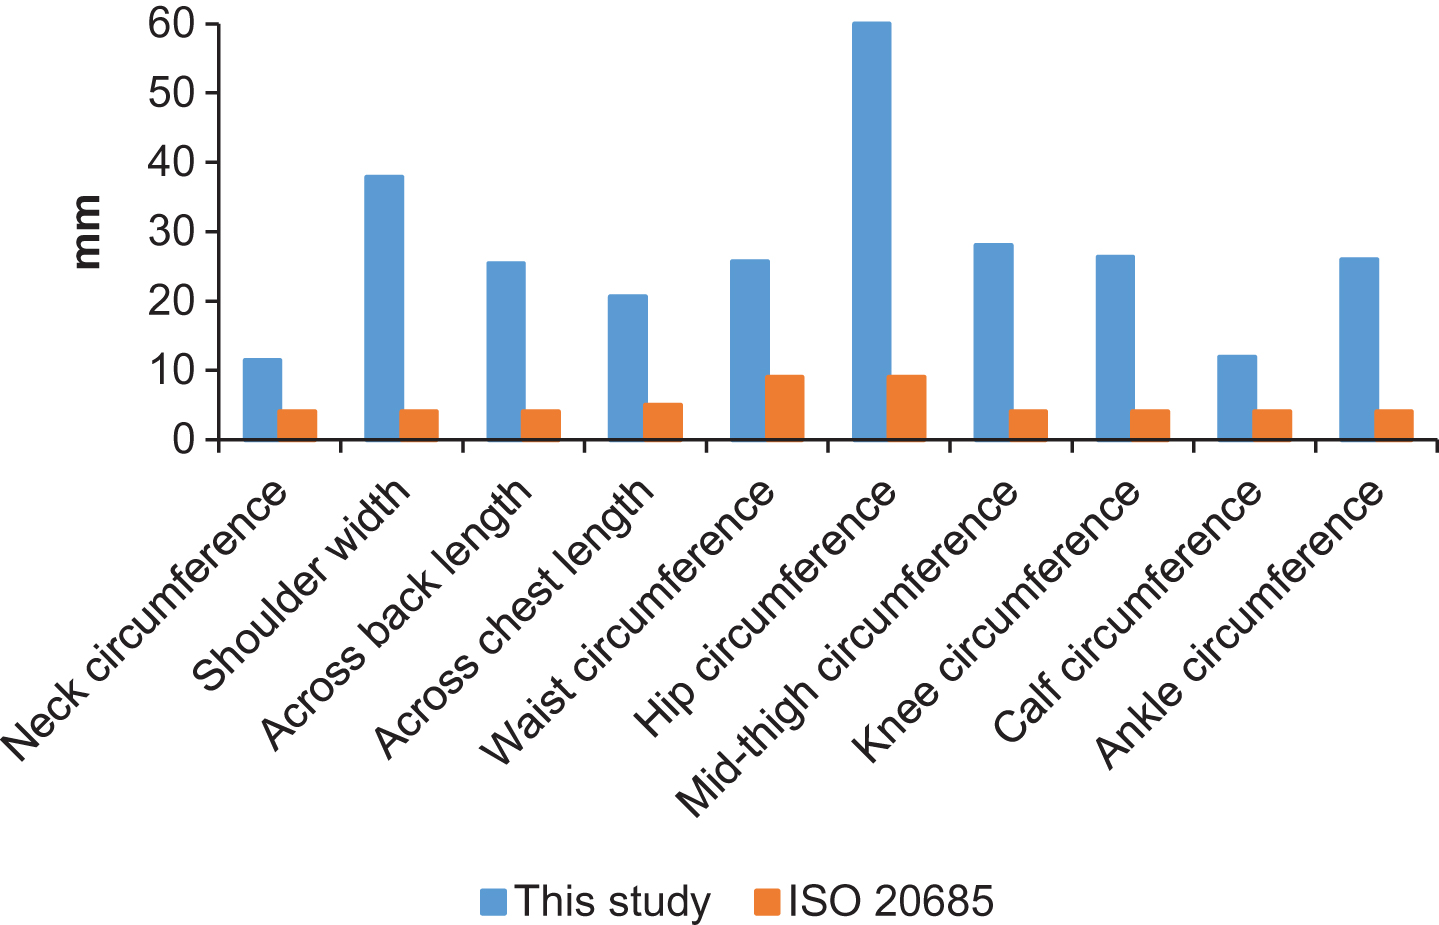
Comparison of the MAD in this study with the ISO 20685 allowable difference.
The fact that the KBI system is not a fully developed 3D body scanner, but a body imagining capture system for gaming purposes, may have affected the results obtained. Other body scanners that were specifically designed and built for the purpose of anthropometric data collection have been shown to have better reliability. However, studies of other authors also demonstrated that the allowable error is not always very good, when compared to the strict and very low values of allowable error of ISO 20685. Comparing this study to the results from previous reports it can be seen that, for almost every case, the value of the Mean Absolute Difference is larger in this study.
The results listed in order from the smaller to the greater MAD are as follows: Neck circumference >Calf circumference >Across chest length >Across back length >Waist circumference >Ankle circumference >Knee circumference >Mid-thigh circumference >Shoulder width >Hip circumference. The MAD for the waist circumference measurement is the only one that is very similar in all five available studies, with the exception of Lu and Wang [30], where the value is much smaller (14.73 mm in opposition to a mean value of 23.74 mm).
Comparing the results with the ISO 20685 definitions of the maximum allowable mean difference between 3D body scanner dimensions and traditionally measured dimensions, it can be seen that the observed mean difference in this study is considerably larger than the allowable value. The smaller difference occurs for the neck circumference and the calf circumference.
For a better comparison between the several studies, Table 7 shows a selection of body dimensions assessed in the majority of the studies and the difference between the results obtained and the allowable error defined in the standard. A negative value (–) implies that the result obtained in the study is better than the allowable error (value smaller than the standard), while a positive value implies that the result obtained in the study is worse than the allowable error (value higher than the standard).
Results of the difference between several studies and ISO 20685 (in mm)
Despite the fact that the differences between the results of this study, when compared to the ISO 20685 are the greatest, in the other studies here described there are also some significant differences. The hip circumference seems to be the body location with the lesser error compared to the standard, in almost every study. In this particular study it was the body location with the greatest difference compared to the standard, followed by the mid-thigh circumference. These are both body measurements very hard to acquire due to the fact that marking the exact same location of the body landmarks in the data extraction software and in the participant is extremely difficult. Nonetheless, the equipment used (different body scanners in every study) and the procedure used to obtain manual data may be the main source of these differences.
Other studies that compared manual measurements with scan-derived measurements already found some causes to the differences that were registered. For Han et al. [29] some of these causes include the effect: of pose difference; of measuring line horizontalness difference; and of measuring method difference. For Lu and Wang [30] the depth of breathing; the measurer training; and the participants’ posture are some of the main causes found.
In this study, as in other studies, it was found that the involuntary body movement is one of the main sources of the data variations. When the test was done to the mannequin there were still some measurements that presented a significant difference between the two methods, namely: hip circumference, knee circumference, ankle circumference, shoulder width, across chest length and across back length. Calculation of the MAD value also resulted in values much closer to the allowable error defined in the ISO 20685 than the values obtained from measuring the human participants. Despite the fact that there is no measurement that meets the allowable error, the MAD values for the knee circumference, ankle circumference and shoulder width are very similar to the ISO 20685 criteria.
Comparing the significant difference between the two methods for the human participants and the mannequin (Fig. 4) some dissimilarities can be seen (points above the p = 0.05). Two body measurements – waist circumference and mid-thigh circumference – do not have a significant difference in the mannequin while in the human participants a significant difference can be found between the two methods.
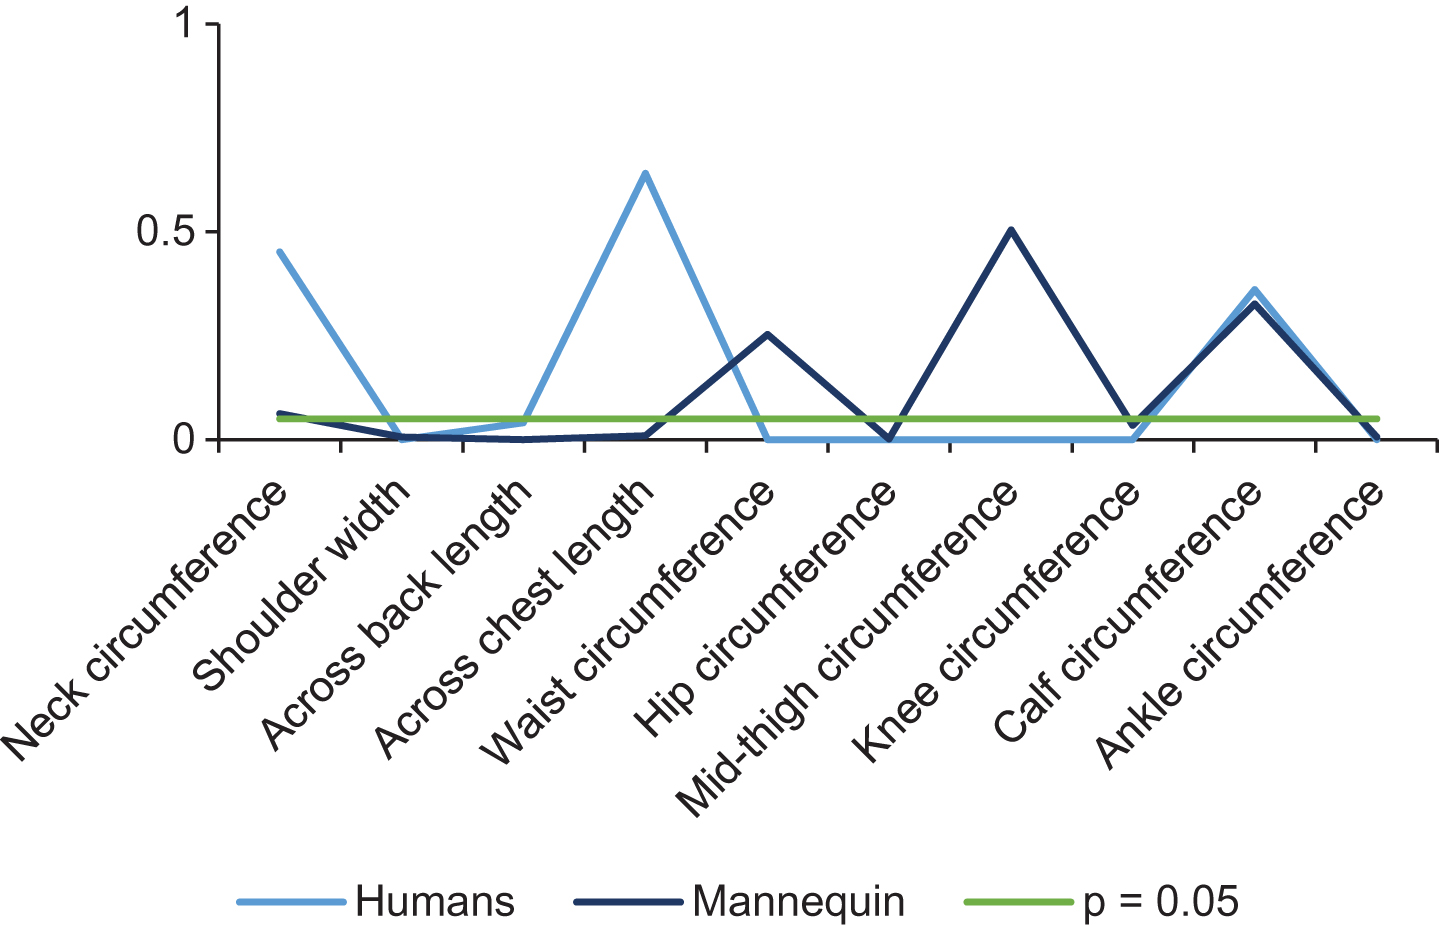
Comparison of the p-value in human participants and the mannequin.
However, there is only one body measurement that has significant difference for the mannequin and not for the human participants – the across chest length. This can be explained by the cuts that have to be made in the data extraction software (Fig. 5). The mannequin has the arms very close to the torso (the 20-degree angle could not be guaranteed) and, after scanning, the data extraction software cannot recognize properly the correct body parts. As such, it is necessary to apply a cross section cut, parallel to the arm axis. By doing this, the automatic identification of landmarks is slightly compromised and the data acquired is not so feasible.

Cause of the differences in the across chest length measurement in the mannequin.
When the results of the MAD from the mannequin are compared to the ISO 20685 limits there are also some differences. Nevertheless, it is clear that these values are much closer than the MAD values from the human participants. In fact, there are three body measurements that are very close to the ones defined in the ISO 20685 – knee circumference, calf circumference and shoulder width. Figure 6 shows these results.

Comparison of the MAD in human participants, the mannequin and the values defined at ISO 20685.
These results indicate that the body sway in the human participants’ plays, in fact, an important role in the differences between the two methods. Still, there are some differences when compared to the maximum allowable error of ISO 20685, mostly for the hip circumference and across back length. This means that there are other causes, apart from the body sway, that are interfering with the measurements, as for example, the proper calibration of the equipment or the positioning of the participants right in the middle of the scanning area.
The images taken from five series scans of two different participants (Fig. 7), show how severe the body-swaying problem could be. Of the five scans of the participant on the left, only the third one looks reasonable. There are big gaps between top and bottom scans caused by the involuntary body movements. On the other hand, it seems that the participant on the right could do a much better job to keep his body still. This participant’s stance was more consistent. The central line of the standing position was set closer to the front cameras because the overlap in the front was much less than that in the back side.
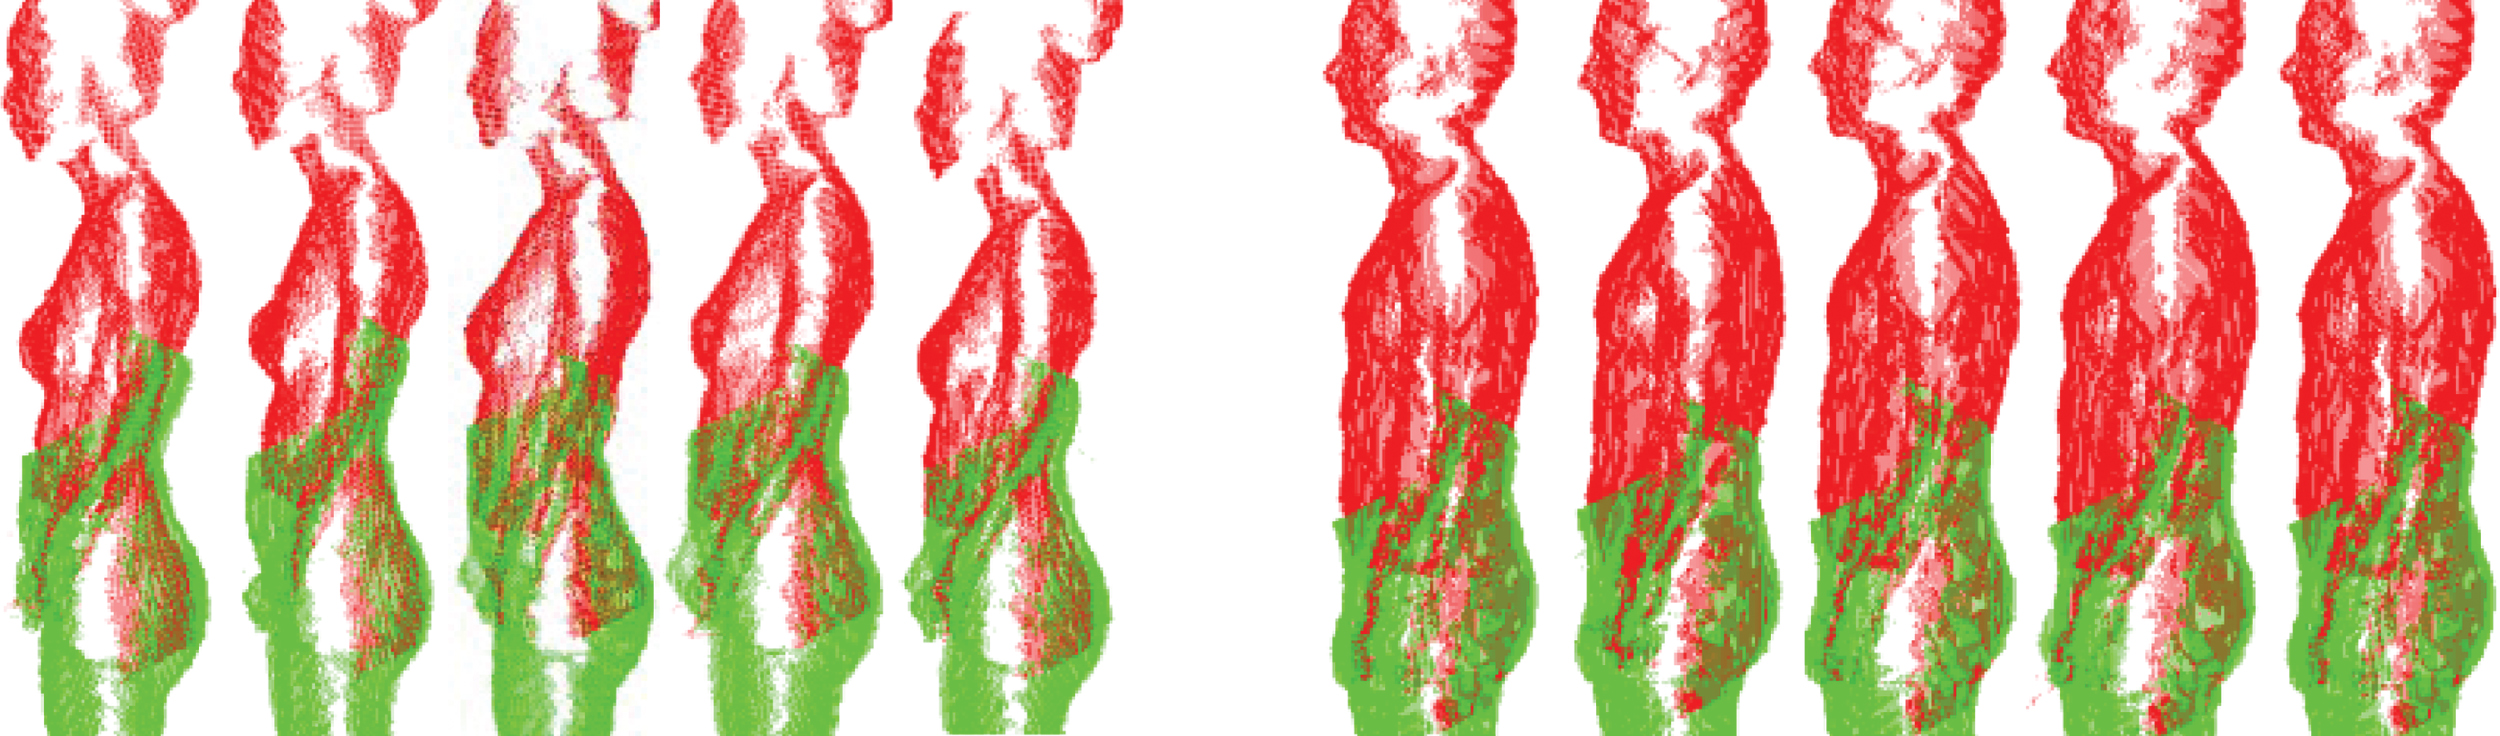
Effects of involuntary body movement in two participants.
The reason why an involuntary body movement could cause an appreciable error in the image acquisition is the amount of time required to scan a body. Currently most 3D body scanner systems need a time varying from a few to 15 seconds to capture images. Many participants are not able to remain still for that long. In the used system, the four sensors take images separately in approximately five seconds, which allow the body positions to be changed in different images. Nevertheless, this is an issue that also occurs with other body scanning systems that use a large amount of sensors to acquire data. Any system that takes more than five seconds to capture images could have similar problems because it is subject to body movement. As such, enhancing the scanning speed and shortening the capture time would be the key to minimize the effects of the body sway.
The calibration process may also be a cause for some differences found in this study. From the images collected it can be seen that the alignment of the front top and bottom images may not be done as well as the back side. With the support system used to hold the sensors in their position, it was very hard to assure that they are perfectly aligned and at the same level, both vertically and horizontally. Also very difficult is assuring that the calibration target is absolutely centered and perpendicular to the sensors.
All of the factors mentioned contribute to a poor calibration and consequently to the not so reliable data acquisition. Nevertheless, there is no accurate way of knowing when the sensors need to be calibrated again (apart from when they are moved from one place to another). Calibrating the sensors each time a new participant is measured can be very time consuming and can also lead to unreliable data. With a not very reliable calibration process, if the same participant was measured with the sensors calibrated in different ways the results would probably be different.
Currently, there are some improvements being made to the system used in this study, using new sensors. The new system can finish image capturing in 0.2 seconds, almost eliminating the body sway problem. With this system, the calibration process is easier and the support system of the sensors allows better alignment.
It is possible to understand that if this body sway could effectively be controlled, the data was sufficiently accurate to be used in apparel applications, due to the difference between sizes of made-to-measure clothes. Nevertheless, for more rigorous applications it would be necessary to control every other factor that is now affecting the measurements obtained. As such, it is necessary to take some caution when using this system to avoid having biased results.
The small sample size used for this study might have been a minor limitation to have more conclusive results. Nonetheless, the ISO 20685 determines that to perform a validation study a sample of 40 people should be used. In this particular case due to financial and time restrictions it was not possible to have this sample size. However, the authors believe that the difference of only three people would not have a very significant impact in the results.
Controlling the two aspects mentioned before (body sway and position of the participants) could be achieved by adding a support mechanism to the existing equipment that would be placed right in the center of the scanning area, impeding the participants to be too close to the frontal devices or the back devices. This mechanism could also include some handles that the participants would hold during the measurement process in order to avoid the body sway (as already happens in some 3D body scanner models, such as the TC2-19B [36]). This same mechanism should also be used for taking the manual measurements, so that the participants maintain the same posture during the entire measurement process and the repetitions needed. Furthermore, if for any reason the participants had to step out of the scan area, it would be very easy to reposition them in the exact same posture.
The data collected showed that there is a significant difference between the two data acquisition methods for all body measurements except neck circumference, calf circumference and across chest length. On the other hand, the analysis of the data from the mannequin revealed that there was no significant difference for only four body measurements, meaning that there are some other factors apart from the body sway that are currently affecting the reliability of the data. Nevertheless, when compared to the ISO 20685, the mean absolute difference of the mannequin is far closer than the values obtained from the human participants.
This work has presented an insight about the usability of the Kinect based system as an accurate body scanner for obtaining anthropometric data for ergonomic uses. The intention here was to understand if there is the need for great investment in high-end 3D body scanners to obtain reliable data. As observed here, there are still some issues that need to be addressed so that the system can give more accurate results. Nonetheless, the previous studies of other scan systems have also presented results that are not according to the rigorous standards.
It was concluded that the main issue that compromises the good performance of the 3D system is that it requires too much time to finalize the reading of the four sensors. The reliability and precision of the acquisition is dependent of the capacity of the participants to remain static during that period of approximately five seconds. With some improvements in the scanning time and in the precision of the devices themselves (such as the version two of the KBI system, which is allegedly more accurate and requires only 0.2 seconds to take one scan, according to Yang et al. [37] the scanning process could be used to generate massive amounts of data at a low cost. Unfortunately this new version was not available for this study.
This study was carried out using a sample of young adults with similar body characteristics and, even in this relatively controlled scenario the measurements collected with the two methods were different. It would also be interesting, as an opportunity for future work, to evaluate if this difference persists (or even increases) if other types or participants were measured, such as older, impaired or heavier people. If no alterations to the system were made it is likely that the differences would be larger as, for example, older or impaired people would have difficulties in maintaining the required static standardized posture for the necessary time without any assistance.
Conflict of interest
The authors have no conflict of interest to report.