
Abstract
BACKGROUND:
Prevention of Work-Related Musculoskeletal Disorders (WRMSDs) is crucial as they jeopardize the well-being of the workforce in workplaces and are prevalent in developed and developing countries.
OBJECTIVE:
This study aimed to determine the prevalence of WRMSDs among Iranian workers.
METHODS:
A systematic review and meta-analysis of WRMSDs in Iran was performed by searching relevant keywords in authentic databases and search engines such as SID, Google Scholar, Medlib and PubMed. Twenty-seven published articles in the field of WRMSDs from 2001 to 2010 were searched. Meta-analysis and random effects approach were used to analyze data. Heterogeneity investigation of articles was done using I2 index.
RESULTS:
The total sample size was 6,090 workers with a mean of 225 samples per study. The upper and lower back had the highest prevalence rate of self-reported WRMSDs with 38.1% (95% CI: 29.9–46.4), and 50% (95% CI: 42.5–57.5), respectively. Also, knee had the highest prevalence among lower extremity disorders with 42.1% prevalence rate (95% CI:35.1–49.1).
CONCLUSIONS:
A high prevalence of WRMSDs in upper and lower limbs was reported in Iran. Trainings with regard to occupational ergonomics and industrial hygiene programs were recommended for minimizing the work-related risks of musculoskeletal disorders.
Introduction
The National Institute for Occupational Safety and Health (NIOSH) has defined musculoskeletal disorders as a group of conditions that involve nerves, tendons, muscles and supporting structures such as inter-vertebral disks. They represent a wide range of disorders that differ in severity and include mild and moderate signs and symptoms to chronic and debilitating conditions. Examples of such conditions include carpal tunnel syndrome, tension neck syndrome and back pain [1]. Several authors considered musculoskeletal disorders as a collective term for groups of diseases that were classified as follow: a) well-known clinical disturbances like inflammation of the tendons and white finger caused by vibration b) clinical conditions that are less known, such as rotator cuff syndrome and c) non-specific disorders like cumulative trauma disorders, or repetitive stress injuries [2].
According to the International Labor Organization (ILO), about 160 million work-related diseases occur each year in the world among which the work-related musculoskeletal disorders are recorded in high numbers [3]. In addition, every year 2.3 million people die as a result of occupational accidents and diseases in the world [3]. Each year, more than one million employees experience work related injuries mostly due to repetitive movements, awkward postures and excessive pressure [4]. Several factors such as a) physical, organizational and social aspects of work and the workplace, b) physical and social aspects of life outside the work (exercise, etc.), and c) physical and physiological properties of individuals have been mentioned to be involved in causing musculoskeletal injuries [5, 6].
Work-related musculoskeletal injuries impose large costs on the health care systems all over the world.
Direct costs are usually related to charges that have to be paid to the healthcare system physicians, hospitals, rehabilitation centers and insurance companies. The indirect costs include disability of the injured person and their wage losses, costs incurred by the employer in hiring and training new workers to replace the injured workers, and administrative expenses, including costs related to the compensation, and the costs associated with quality of life of the injured employees and their families [2, 7]. In Japan, during 1960–1980, the development of musculoskeletal disorders was prominent among typists, phone operators and workers of assembly lines when most of them experienced pain in different parts of their hands, arms and shoulders. Since 1980, these problems were more frequent in Scandinavian countries where back pain was often more common among workers of white-collar jobs and injuries related to the neck, wrist and shoulder were more frequent among workers of blue-collar jobs. Nordic studies on the risk factors that may cause neck and arm pain provide invaluable insight to the problem [8, 9]. Based on the studies conducted in Europe, about 40 million workers suffered from these disorders (more than 30% of workers) which cost 0.5 to 2% of EU GDP [10]. In Iran, numerous studies have been conducted in this regard. The results from musculoskeletal disorders and their associated factors among 215 employees in hydroelectric power plants showed that the symptoms of musculoskeletal disorders in some areas of the body such as back (48%), wrist (41%), knee (38%) and shoulder (28.3%) are more prevalent compared to the other parts [11].
Referring to the results from the ergonomic risk assessment and musculoskeletal disorders among 191 employees working in car repair workshops revealed that most of the musculoskeletal disorders were located in the shoulder area (84%), and there were less complaints in the thigh (57%) and 80.5% of those evaluated in the study had pain in at least one of these anatomical areas [12]. According to a study conducted by Choobineh et al. (2004) on 1,439 people in Isfahan, the prevalence of symptoms of these disorders among carpet weavers has been found to be highest inthe lumbar back (45.2%), thighs and hips (1.6%), knees (34.6%) and ankles (23.7%) had the highest rates of prevalence [13]. In another study, Mostaghaci et al. (2010) studied 92 workers of a food producing company in Yazd and reported a back pain prevalence of 44.6% [14]. Due to the fact that the prevalence of musculoskeletal disorders in most industrialized and developing countries is so high, being aware of the latest statistics particularly in terms of its prevalence, distribution and frequency within the country could possibility provide opportunities for health planners to design and offer the occupational health trainings based on the appropriate prevention strategies. Meta-analysis studies are performed mostly to have valid and reliable outcomes by combining various studies and consequently increase sample size and reduce the confidence interval of these measures [15]. Thus, this study aimed at running a meta-analysis to obtain the prevalence of WRMSDs in different parts of the body among Iranian workers considering the location ofstudy.
Methods
The present study was carried out as a systematic review and meta-analysis study to survey the prevalence of work-related musculoskeletal disorders in Iran.
Search methods
Published articles related to WRMSDs (2001–2010) in Iran were searched using the relevant Persian and English keywords (prevalence of musculoskeletal disorders) in SID, Magiran, MedexIran, Google scholar,Scopus, Med lib, and Pubmed. The inclusion criteria of the review were studies which had assessed the prevalence of musculoskeletal disorders in one-year period, and therefore were defined as cross-sectional or descriptive-analytical studies. We also included the studies that had performed the assessment of musculoskeletal disorders by standard practices, and finally declared the prevalence of musculoskeletal disorders in the whole body. Access to the full text paper was another criterion for inclusion.
Study selection and data extraction
First, researchers collected all the articles about the prevalence of musculoskeletal disorders and verified their compliance with the inclusion criteria. Then, all the papers associated with the issue of musculoskeletal disorders were compiled in an initial list. In the next step, a check-list of necessary information for the study (author’s name, year, place, sample size, the overall prevalence rate, employee performance, cause of the disorders, workers’ age and job experience) with regards to all preliminary assessed studies, was developed for the preparation of the final assessment.
Researchers studied the final checklist and eventually, the papers related to the aim of the present study were taken into account for the meta-analysis. Accordingly, 51 articles were reviewed using the keywords, in the basic search; and 35 papers with related titles were compiled from the list of abstracts.
Finally, 27 suitable papers were selected for meta-analysis [16–42]. The full texts of papers were examined for the analysis. Figure 1 shows the flowchart for the selection and inclusion of the studies to systematic review and meta-analysis.
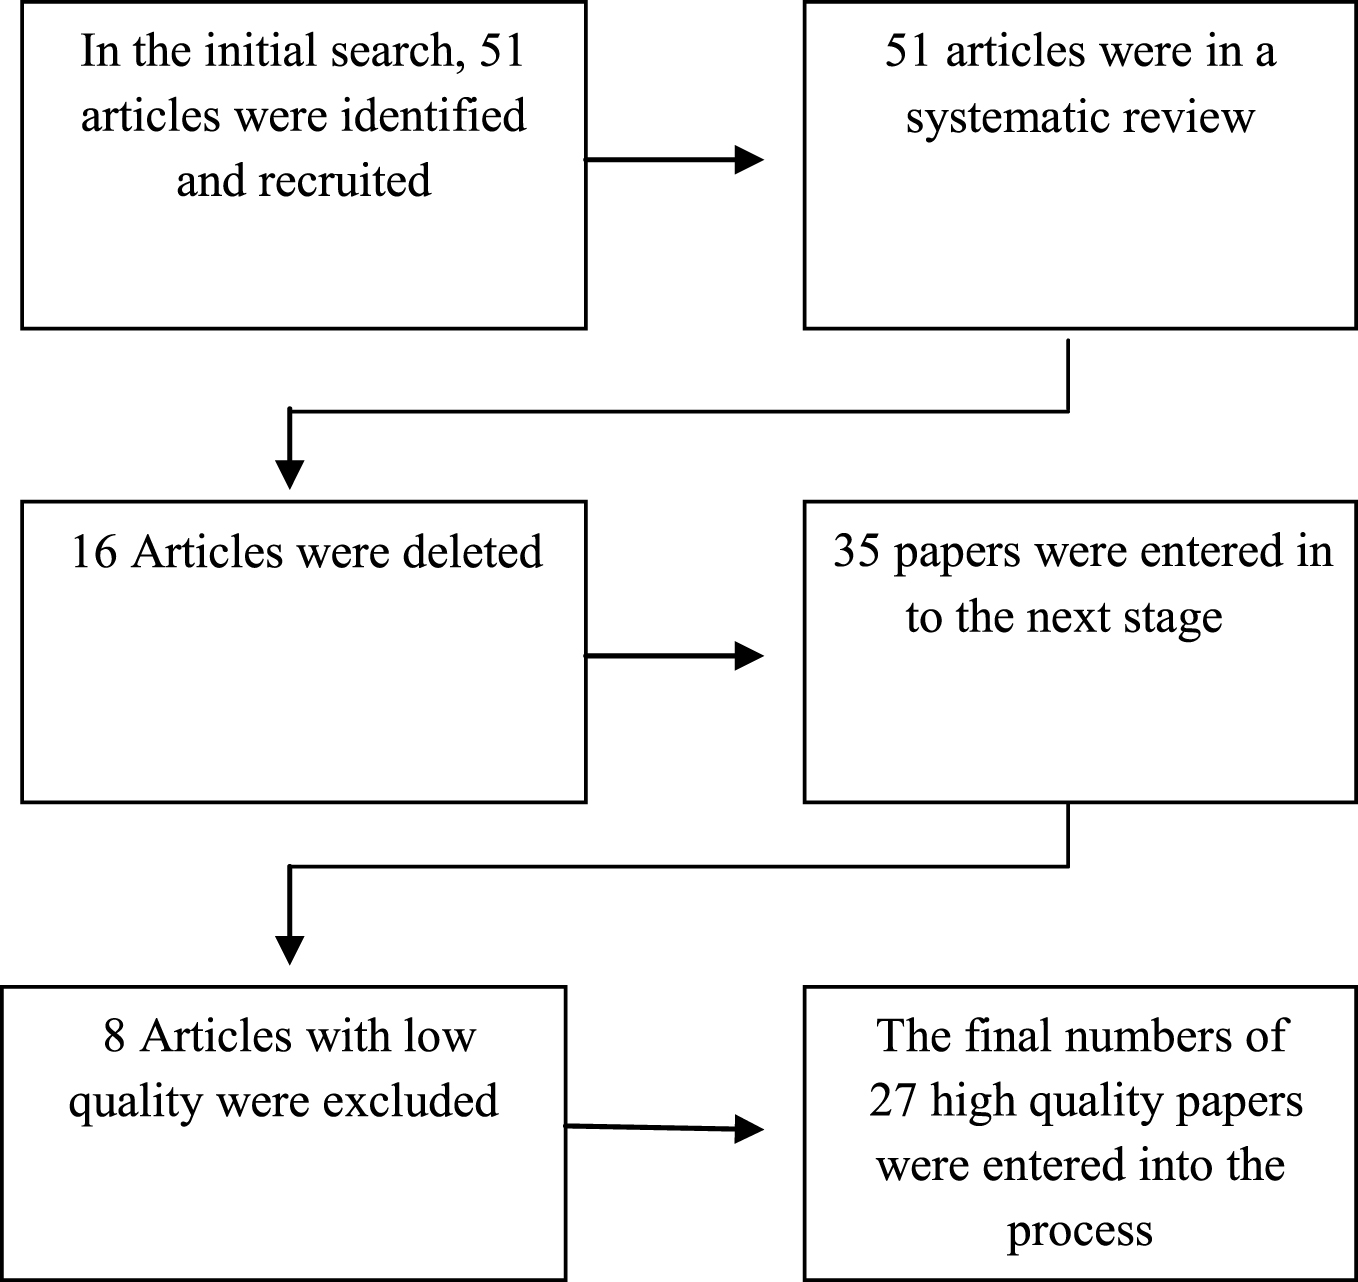
A flowchart of the steps in which studies were selected for the systematic review and meta-analysis
Based on the prevalence of musculoskeletal disorders, the sample size has since been in all the papers for the analysis of studies, binomial distribution was used to calculate variance and the weighted average was applied to combine reported prevalence in different studies. The weight of each study was inversely proportional to its variance.
As there was a large difference between the prevalence in studies and significant heterogeneity (I2 index) which was revealed on the other hand, the random effects model was used in the meta-analysis. Heterogeneity of the study was more than 97%, which is in line with the studies performed with high heterogeneity I2 index<25%, 25% <I2 index <75% and I2 index >75% indicate partial, average and high heterogeneity, respectively).
Meta-regression was used to calculate the relationship between the prevalence of musculoskeletal disorders with the years of studies and their sample sizes. Data analysis was performed by STATA software (version 10).
Results
In a systematic review and during the initial search, 51 articles were identified and after evaluating the titles and abstracts of articles, 35 studies were chosen for the next step. After the final evaluation, 27 studies conducted between 2001 and 2010 with a total sample size of 6,090 workers, and an average sample of 225 per study were selected.
Research method in the studies was cross-sectional and disorders were related to different parts of the body. Nordic questionnaire was used as a tool in all the articles in order to determine the prevalence of musculoskeletal disorders. So, as Nordic questionnaire is a subjective tool, all the WRMSDs in the studies were self-reported by the workers, and were also not medically confirmed. Table 1 shows the prevalence of musculoskeletal disorders in the upper and lower limbs in accordance with the studies conducted in different parts of the country.
Prevalence of WRMSDs in Iran
Prevalence of WRMSDs in Iran
Mean age and job experience in these studies were 28.70–39.20 and 3.08–18.20 years, respectively.
In terms of the location of the studies conducted in Iran, 29.6% of were carried out in the North, 22.2% in the South, 37% in the Central and 11.1% in the other parts of the country. As mentioned earlier, the studies were cross-sectional and descriptive-analytical, and in all papers, the prevalence was calculated in different parts of the body.
Prevalence of musculoskeletal disorders in upper limbs is shown in Table 1. The prevalence of such disorders was estimated to be 31.8% (95% CI: 24.1 to 39.4) for the neck, 36.8% (95% CI: 29.4 to 44.1) for the shoulder, 17.4% (95% CI: 12.7 to 22.1) for the elbow, 34.6% (95% CI: 27.1 to 42) for the wrist, and 38.1% (95% CI: 29.9 to 46.4) for the upper back.
The prevalence of the disorders in the lower limbs were 50% (95% CI: 42.5 to 57.5) for the lower back, 20.7% (95% CI: 16.4 to 25.0) for the thigh, 42.1% (95% CI: 35.1 to 49.1) for the knee, and 27.7% (95% CI: 18.8 to 36.7) for the ankle.
According to the reports from different occupations, back pain has been the most prevalent complaint among health care staff (medical, dental, nursing, etc.) with an incidence rate of 69% (95% CI: 71-66), thigh and hip problems among administrative staff with an incidence of 36% (95% CI: 11–82), and pain in the knees among computer users with 50% (95% CI: 29–72), in addition, ankle disorders hit the highest point among administrative personnel with (95% CI: 14–105). Table 2 shows the prevalence of work-related musculoskeletal disorders in Iran, in different occupations.
Prevalence of musculoskeletal disorders in different occupations
Example: Pain in Shoulder was 17% with (95% CI: 15–19) means 0.17 (0.15, 0.19). Back pain was 0.44(0.41, 0.46) means 44% with (95% CI: 41–46).
Due to the heterogeneity of studies (I2 index), the confidence intervals for each study and for all studies, based on the random effects model in Figs. (2), (3), (4), (5) and (6) are shown. Due to the high number of assessed body parts in this study, the prevalence of shoulder pain chart was used as an example for upper limbs and low back pains of the body’s lower limbs. In the second chart, time trend of the prevalence of back pain in Iran between 2001 and 2010 was depicted.
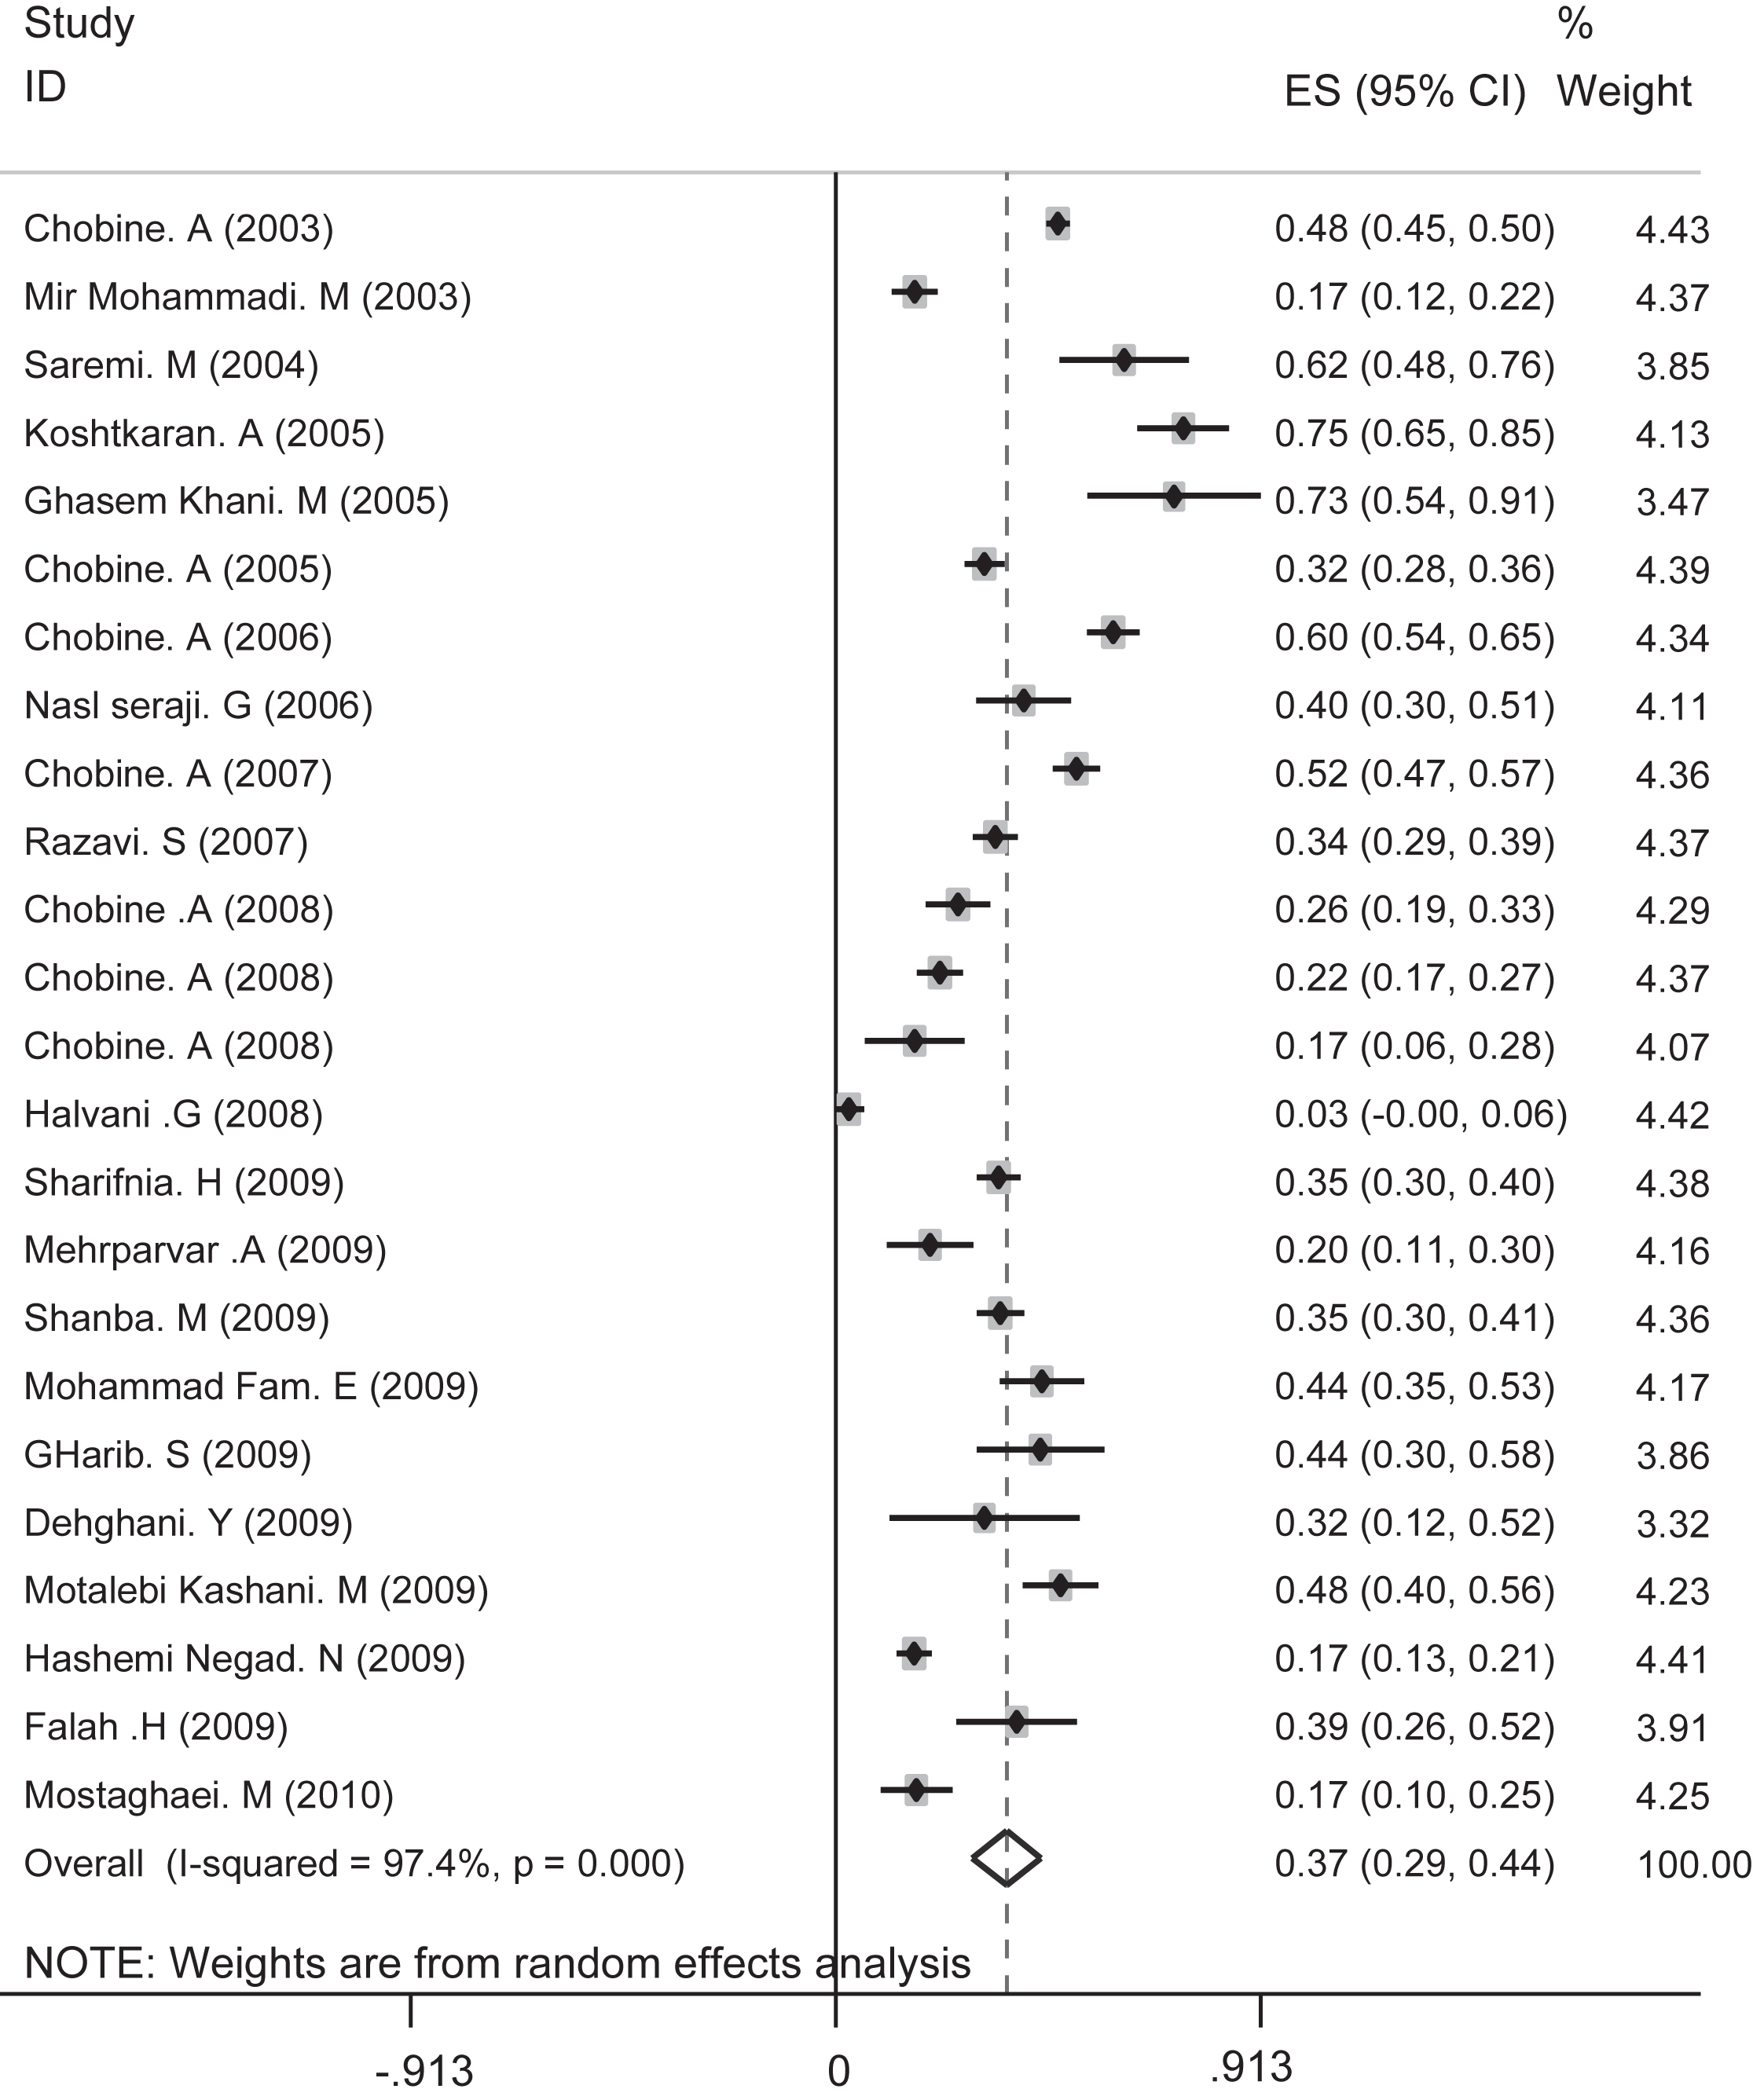
The prevalence of shoulder pain in general and separately for all studies based on the random effects model. Segments illustrated CI prevalence in each study. Midpoint of each segment was the estimated prevalence rate of every study. Diamond Mark showed confidence interval for the prevalence in all studies.
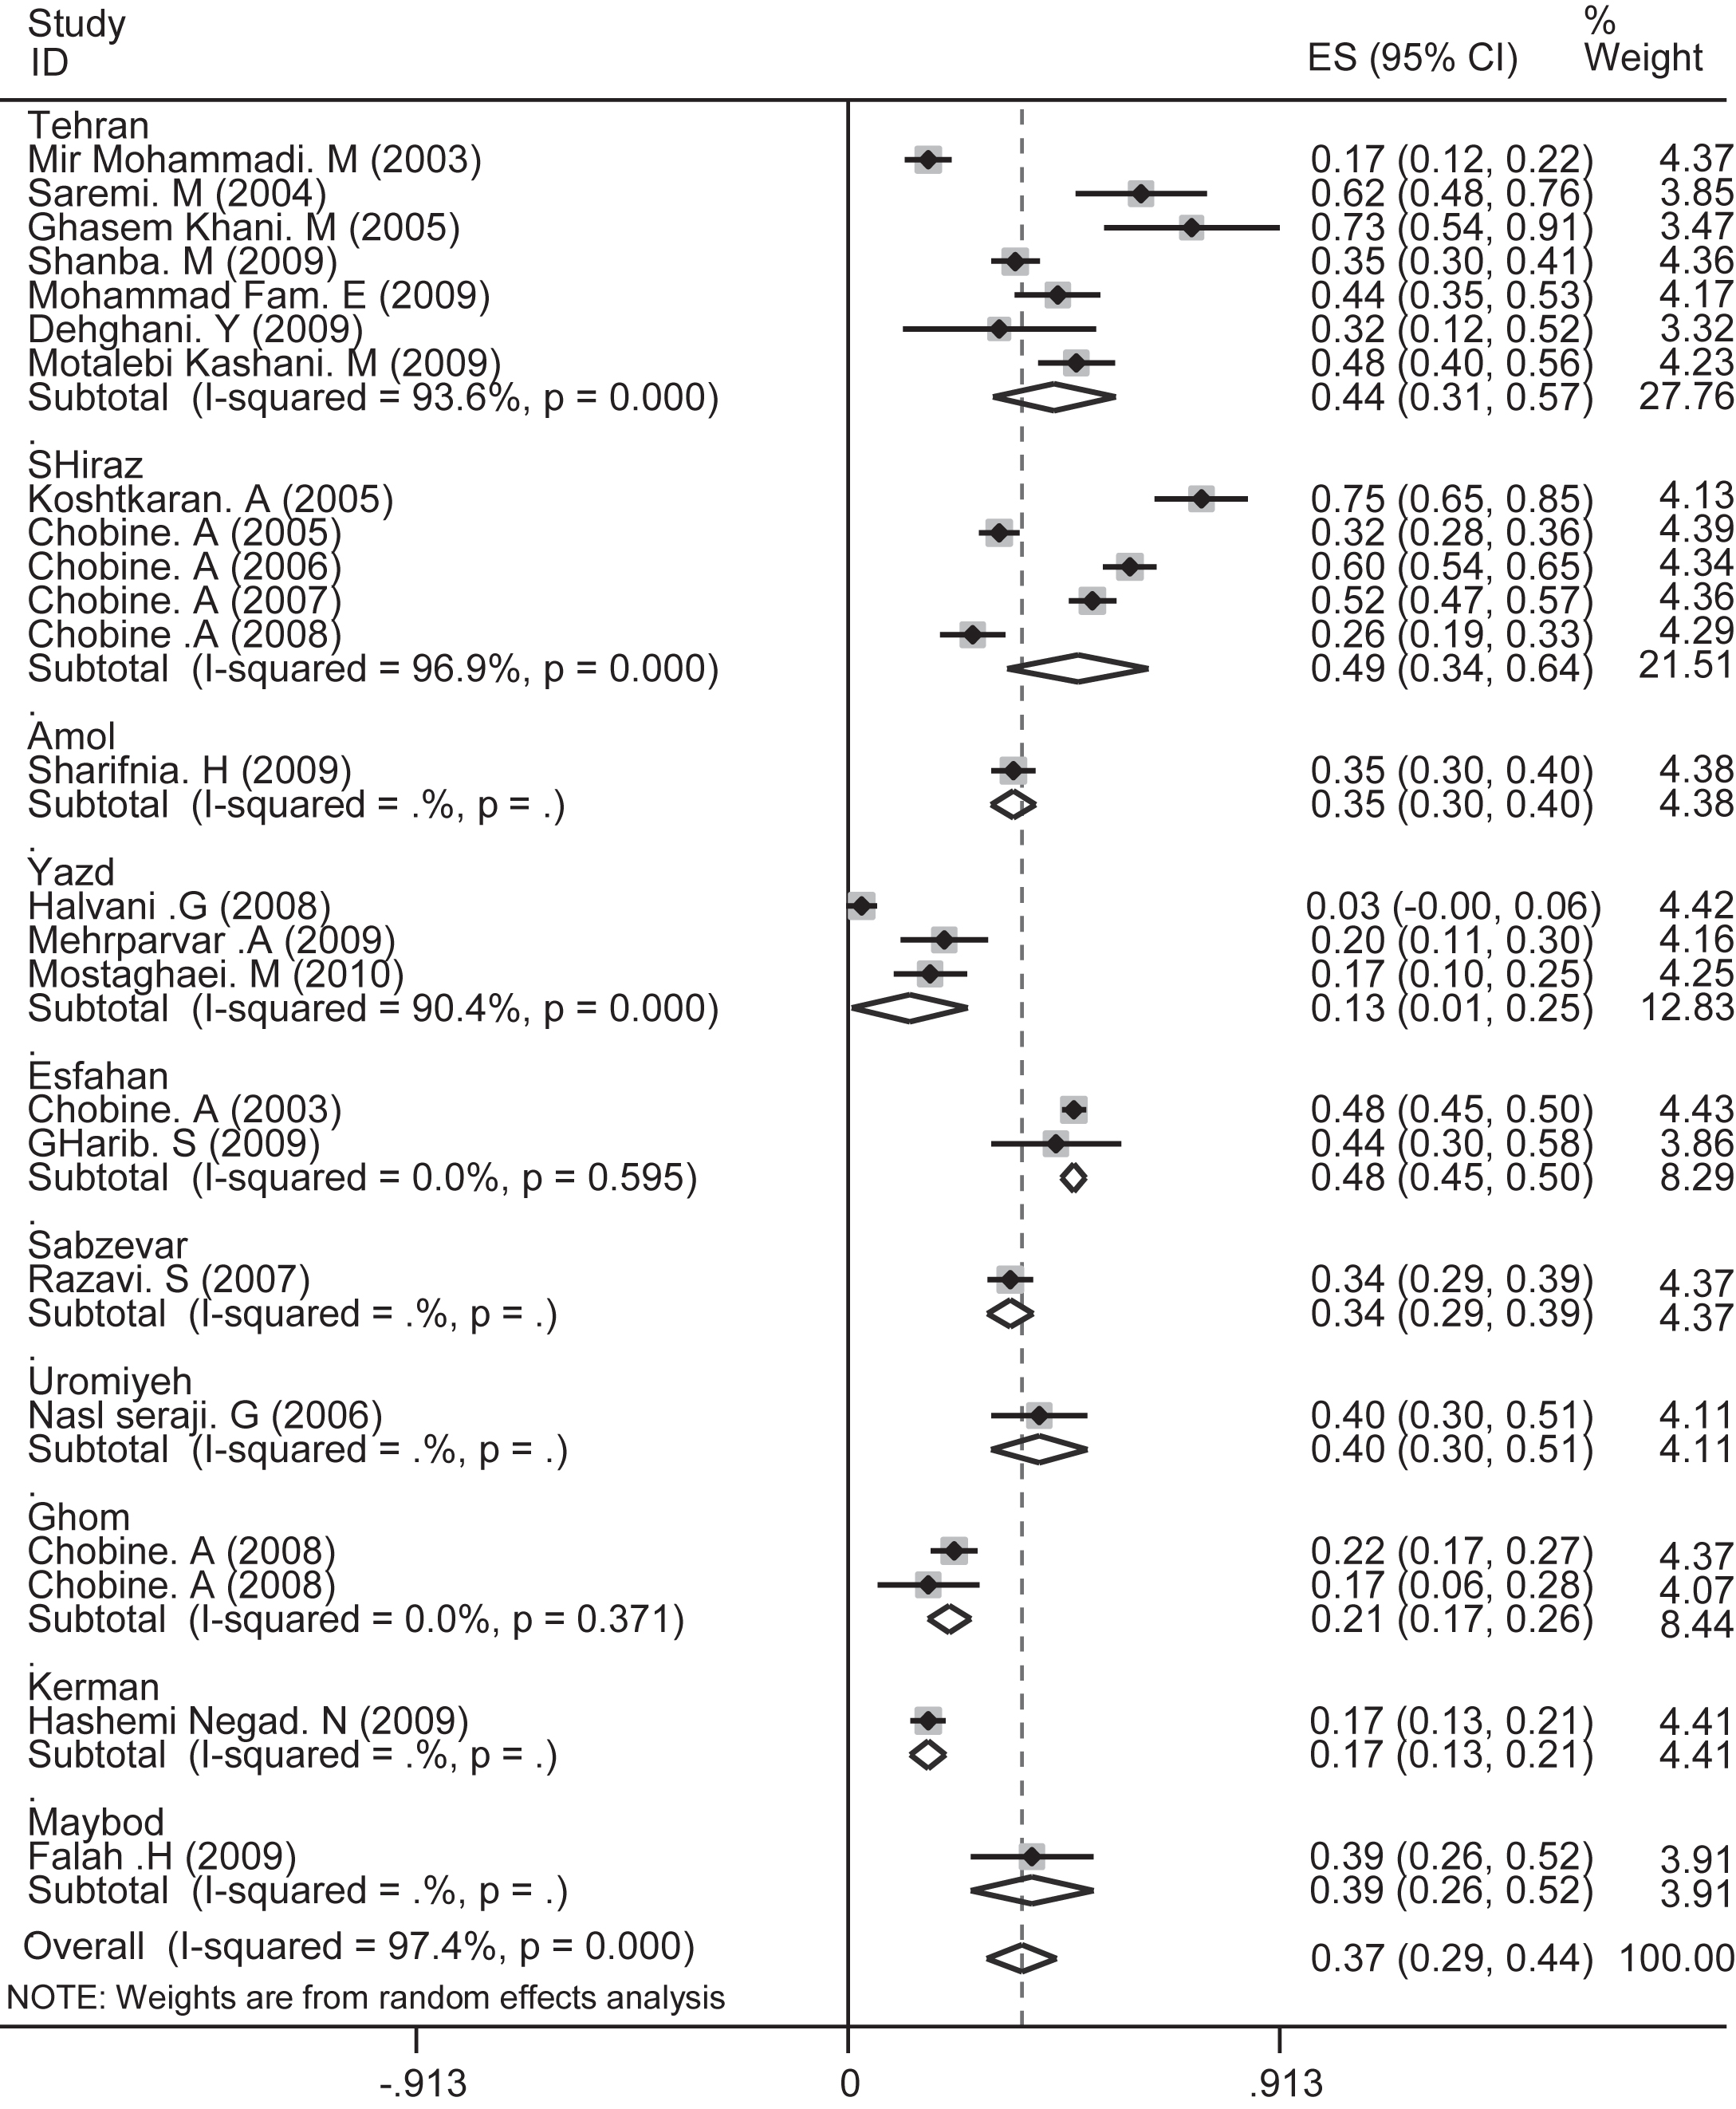
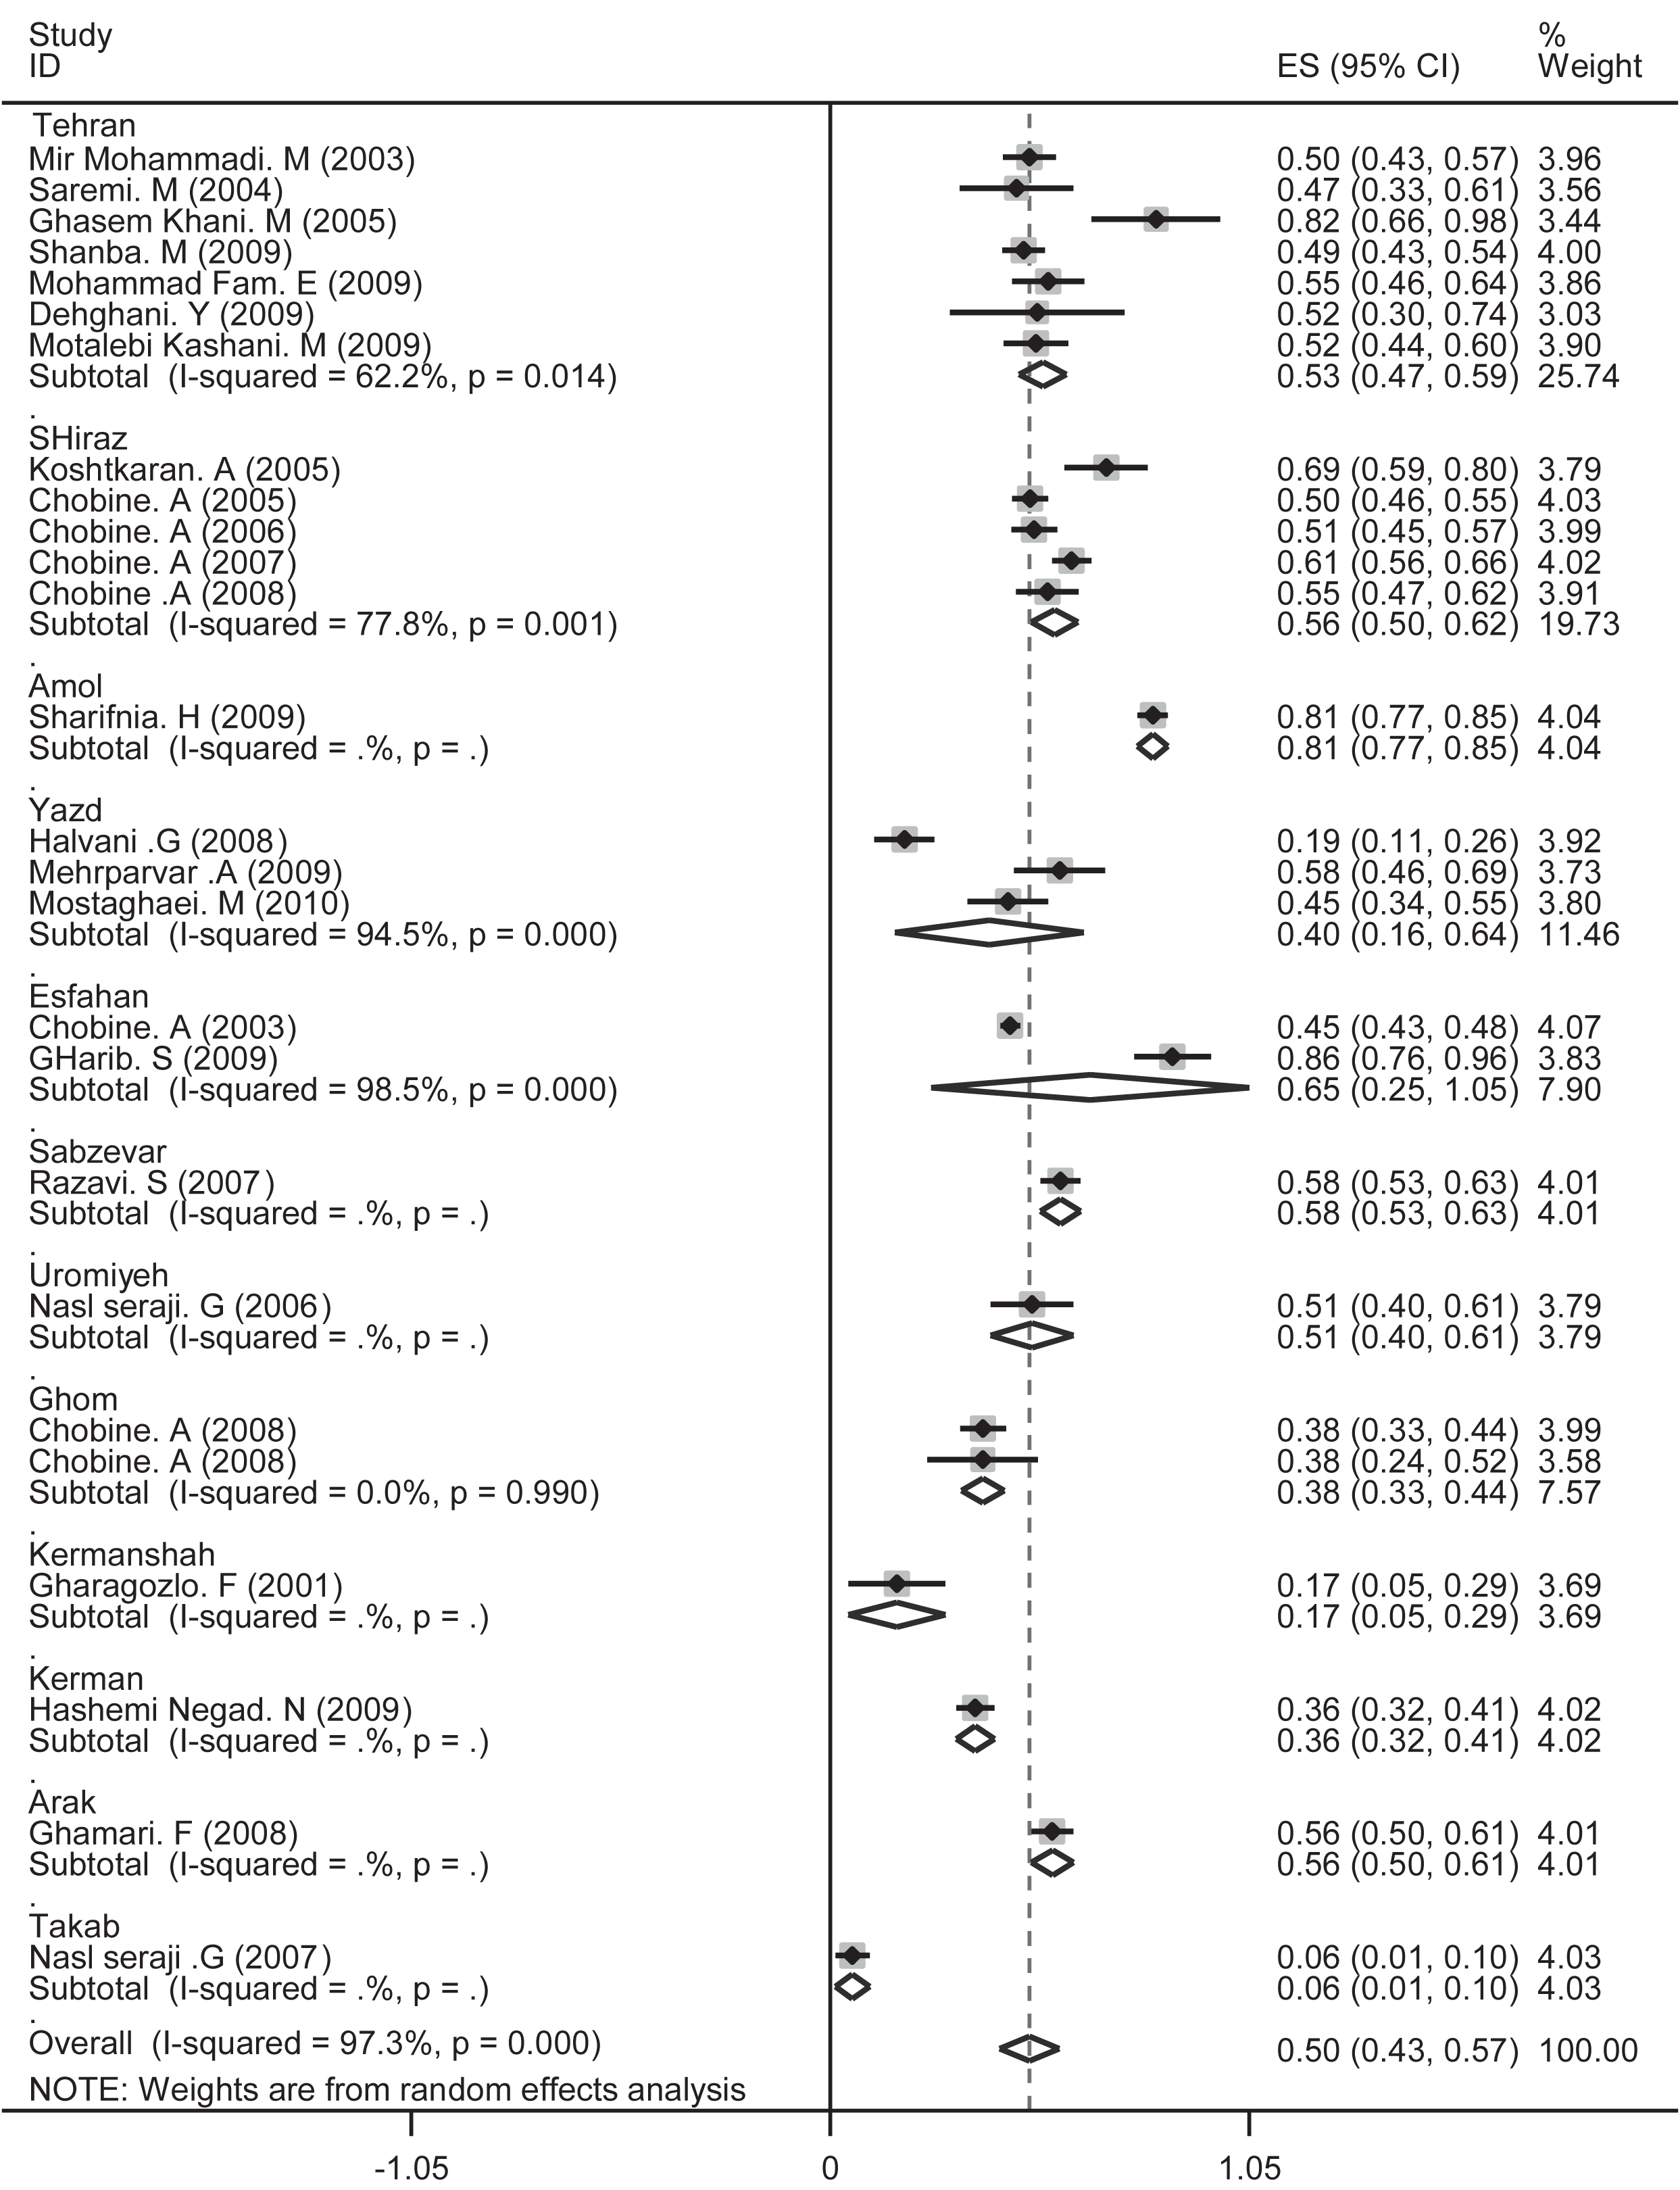
The prevalence of shoulder pain in general and separately for all studies indifferent cities of Iran was based on the random effects model. Segments illustrated CI prevalence in each study. Midpoint of each segment was the estimated prevalence rate of every study. Diamond Mark showed confidence interval for the prevalence in all studies.
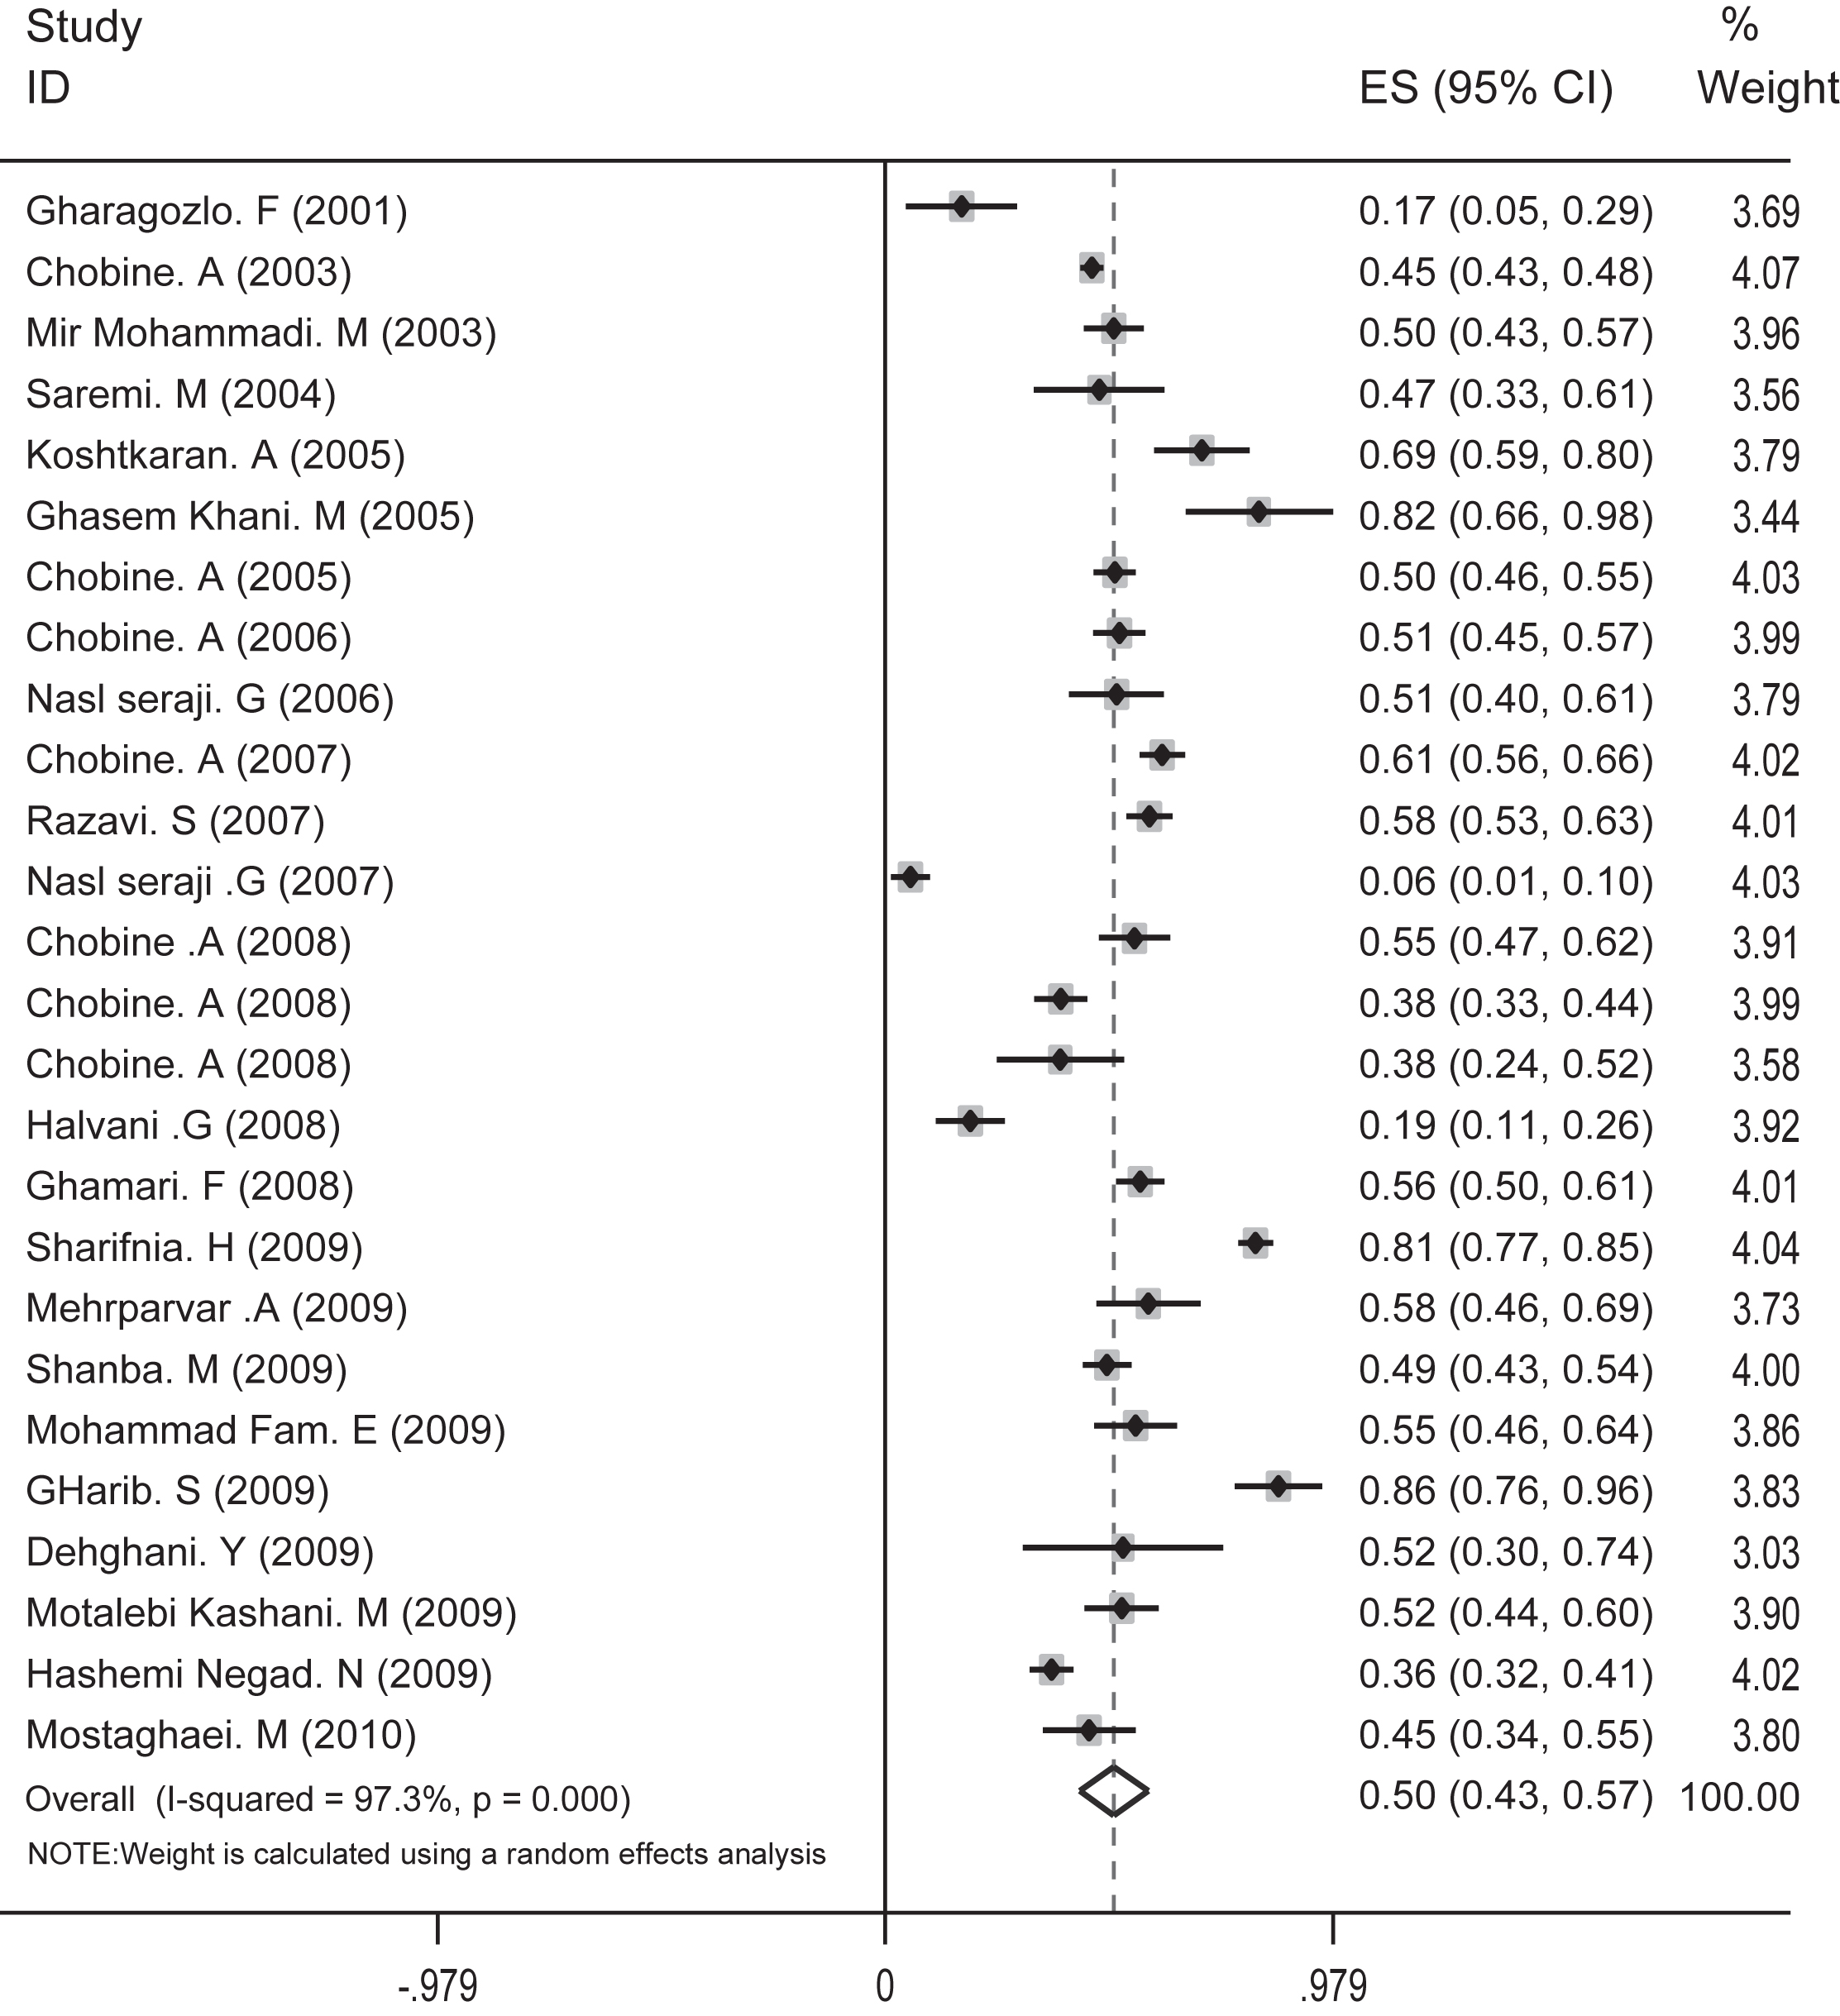
The prevalence of back pain as a whole and separately for all studies was based on a random effects model. Segments show the prevalence of CI in each study. The midpoint of each segment was the estimated prevalence for general studies.
The prevalence of low back pain in general and separately for all studies in different cities of Iran were based on a random effect model. Segments show the prevalence of CI in each study. The midpoint of each segment is the estimated prevalence in each study. Diamond Mark shows confidence interval of prevalence for general studies.
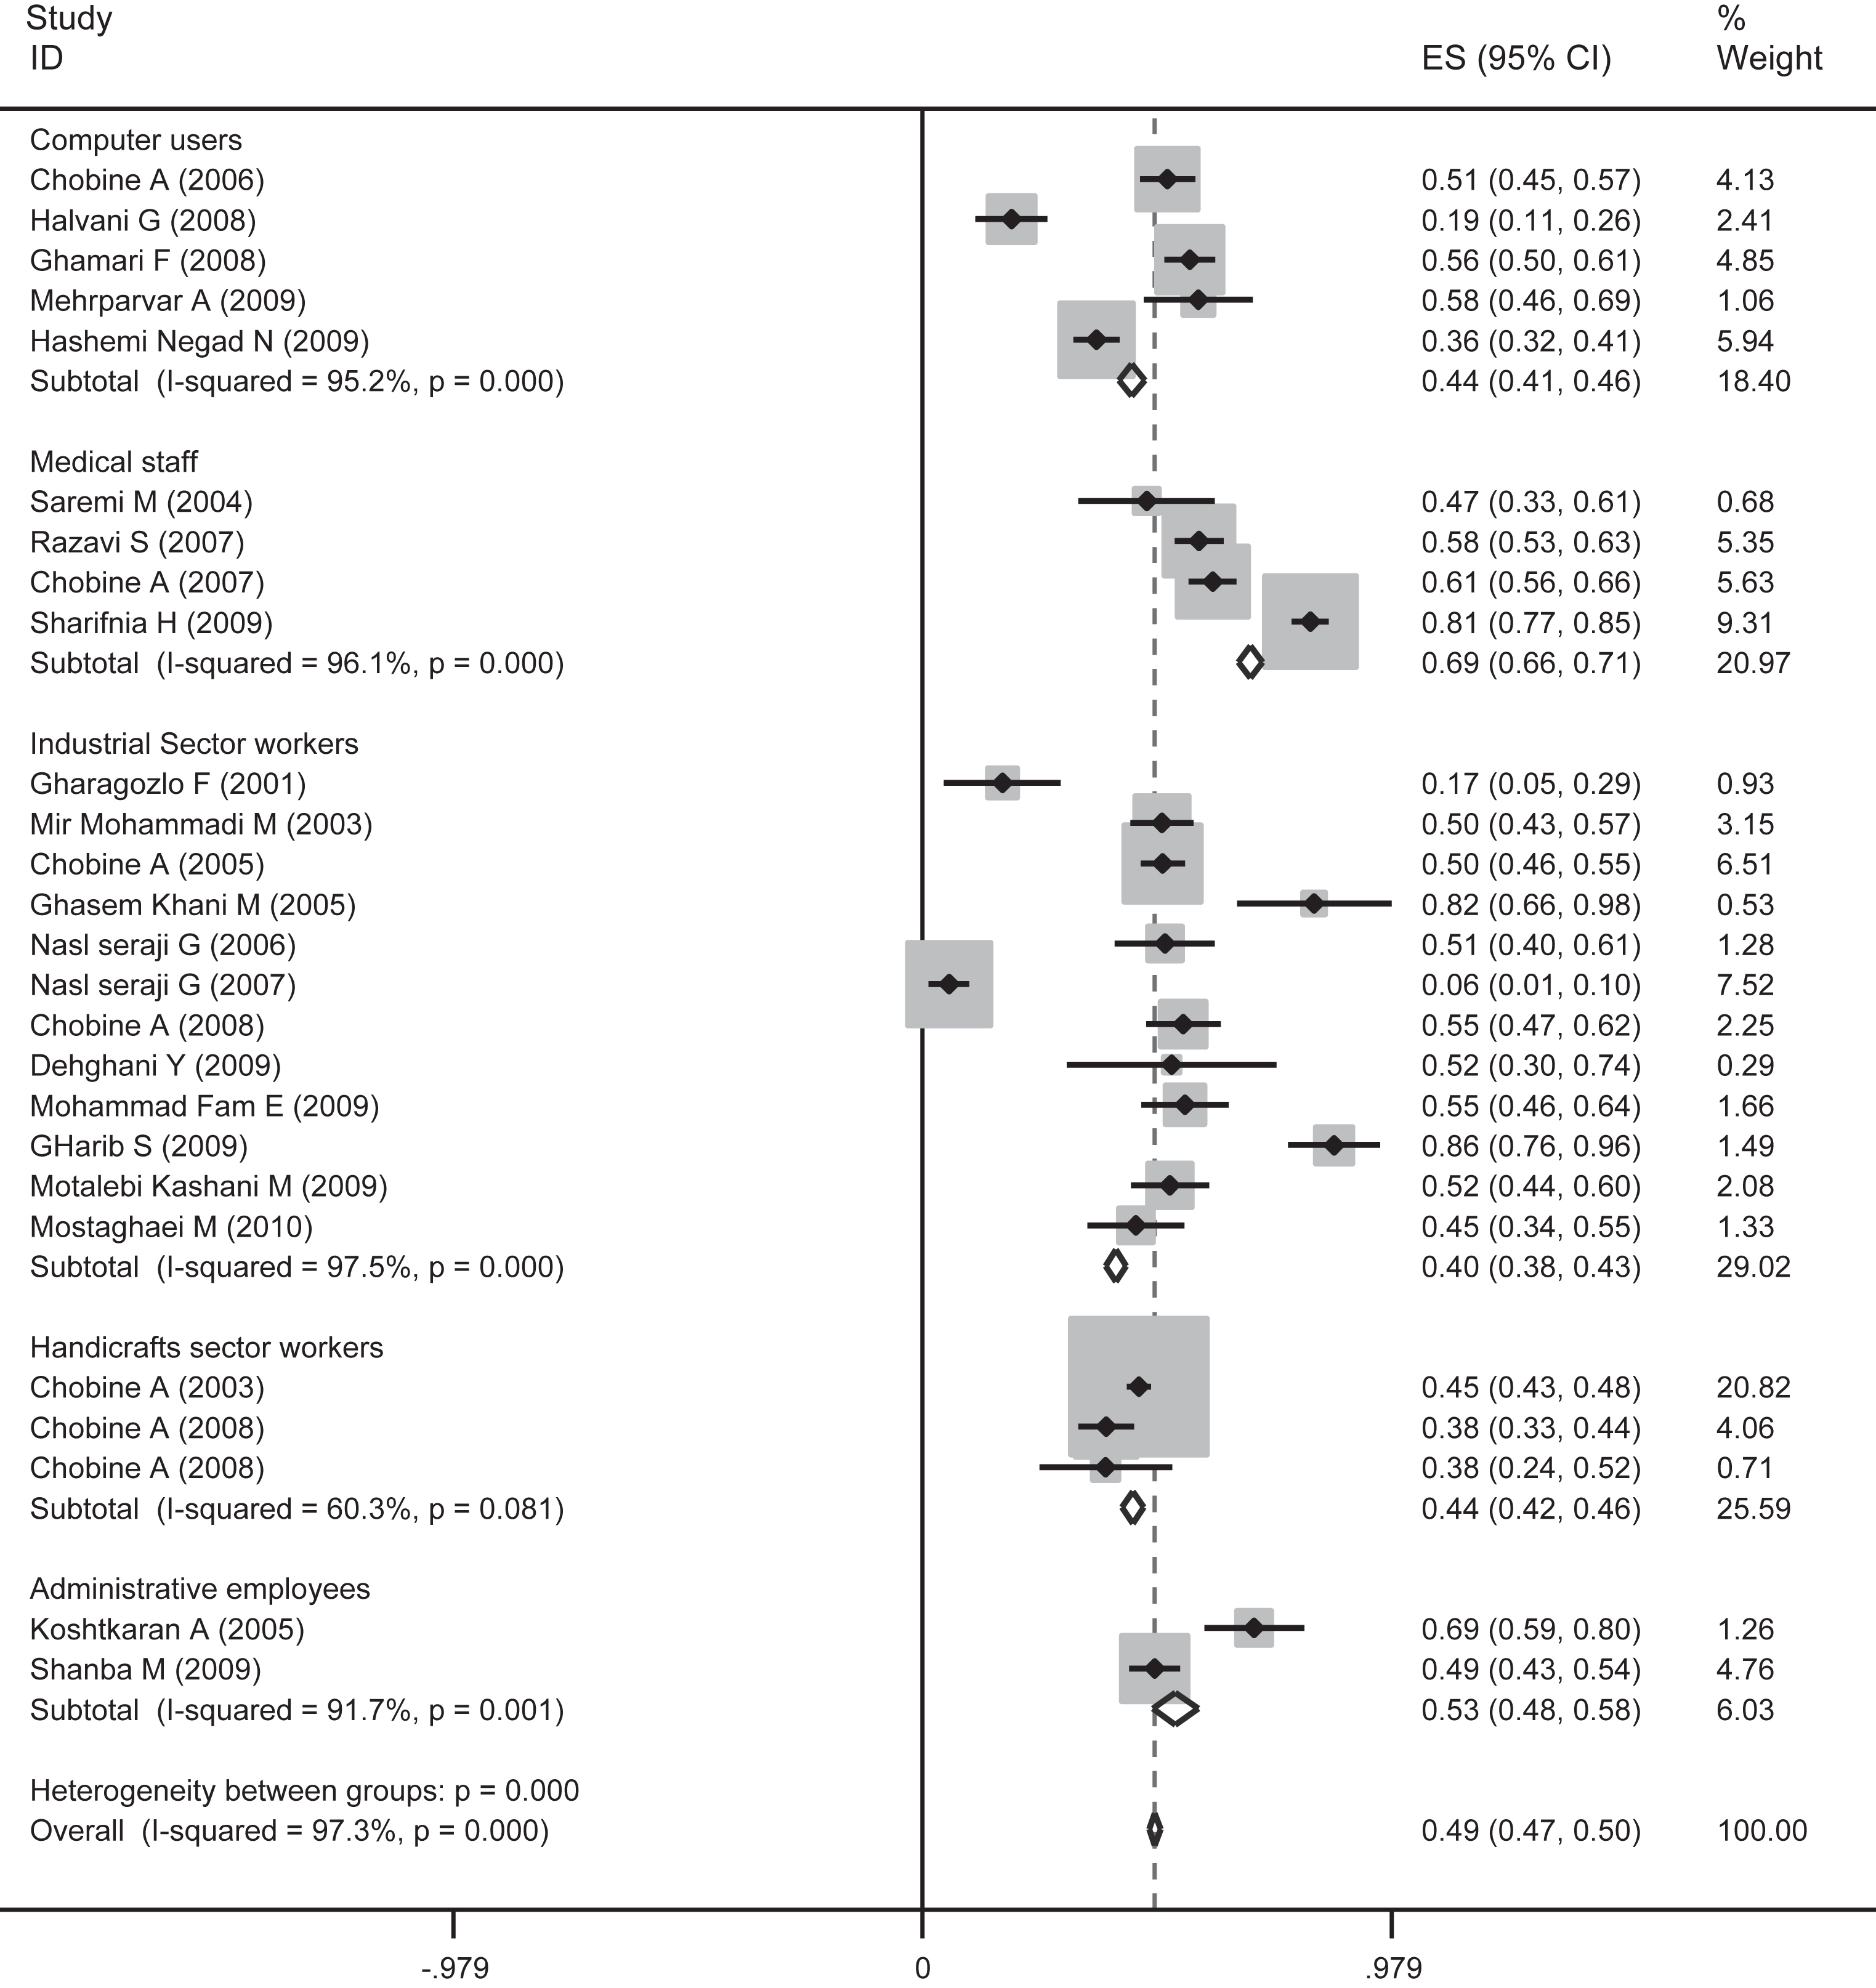
The prevalence of back pain in general and separately for all jobs according to various studies was based on a random effect model. Segments show the prevalence of CI in each study. The midpoint of each segment is the estimated prevalence in each study. Diamond Mark shows confidence interval of prevalence for general studies.
The diagram for the prevalence of shoulder pains was used as a sample in upper limbs. Because of the heterogeneity of studies (I2 index), the confidence interval for each study and for all the studies based on the random effects model is shown in Figs. (2) and (3). Also, Chart 1 illustrates time trend of the prevalence of shoulder pain in Iran between 2001 and 2010. Meta-regression curve of shoulder pain prevalence, in terms of years of studies, has been presented in the second chart.
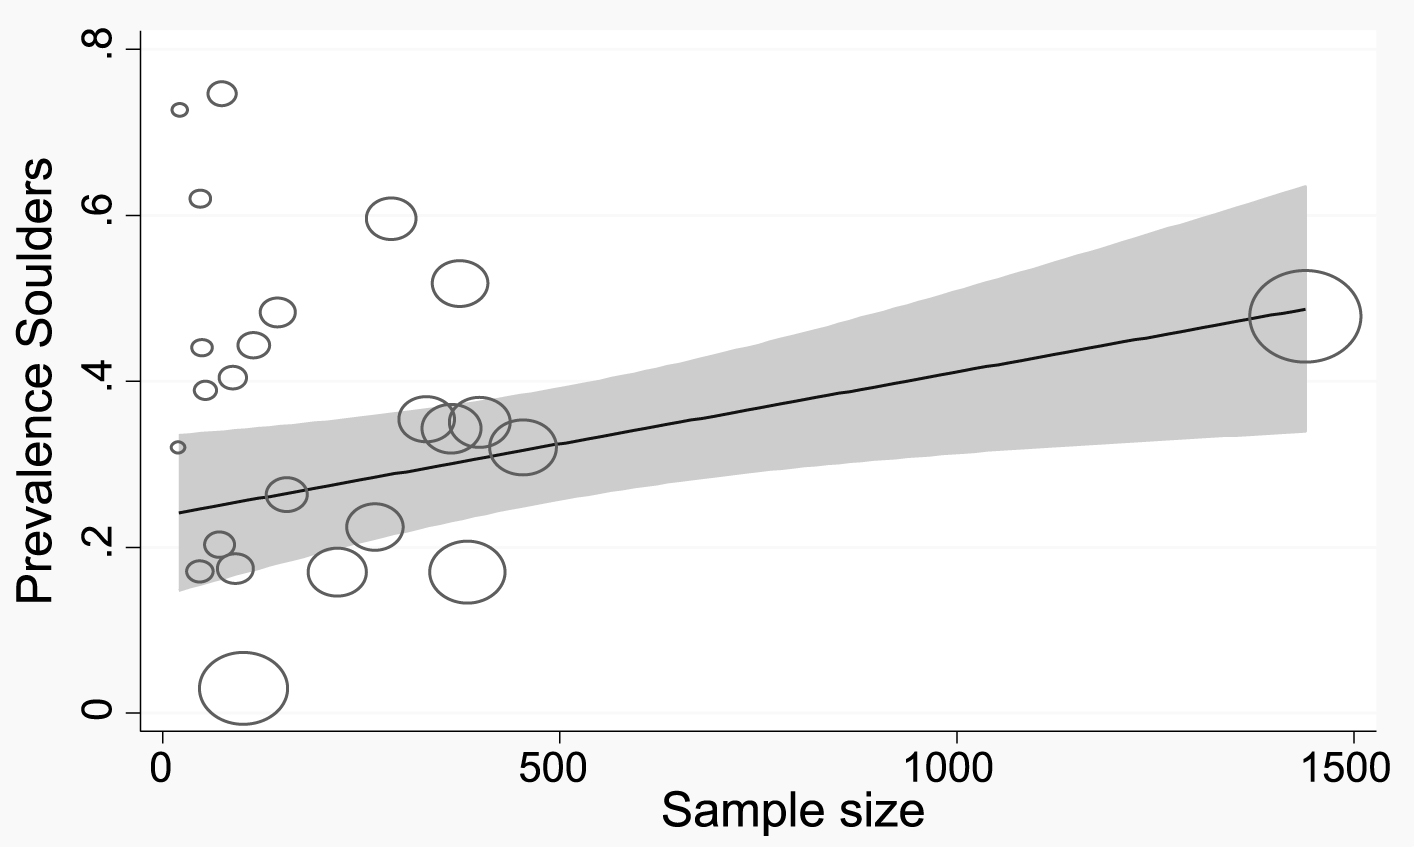
Meta-regression curve of shoulder pain prevalence was in terms of sample size. Circles indicate the sample size in the study. Larger circles denote greater sample size.
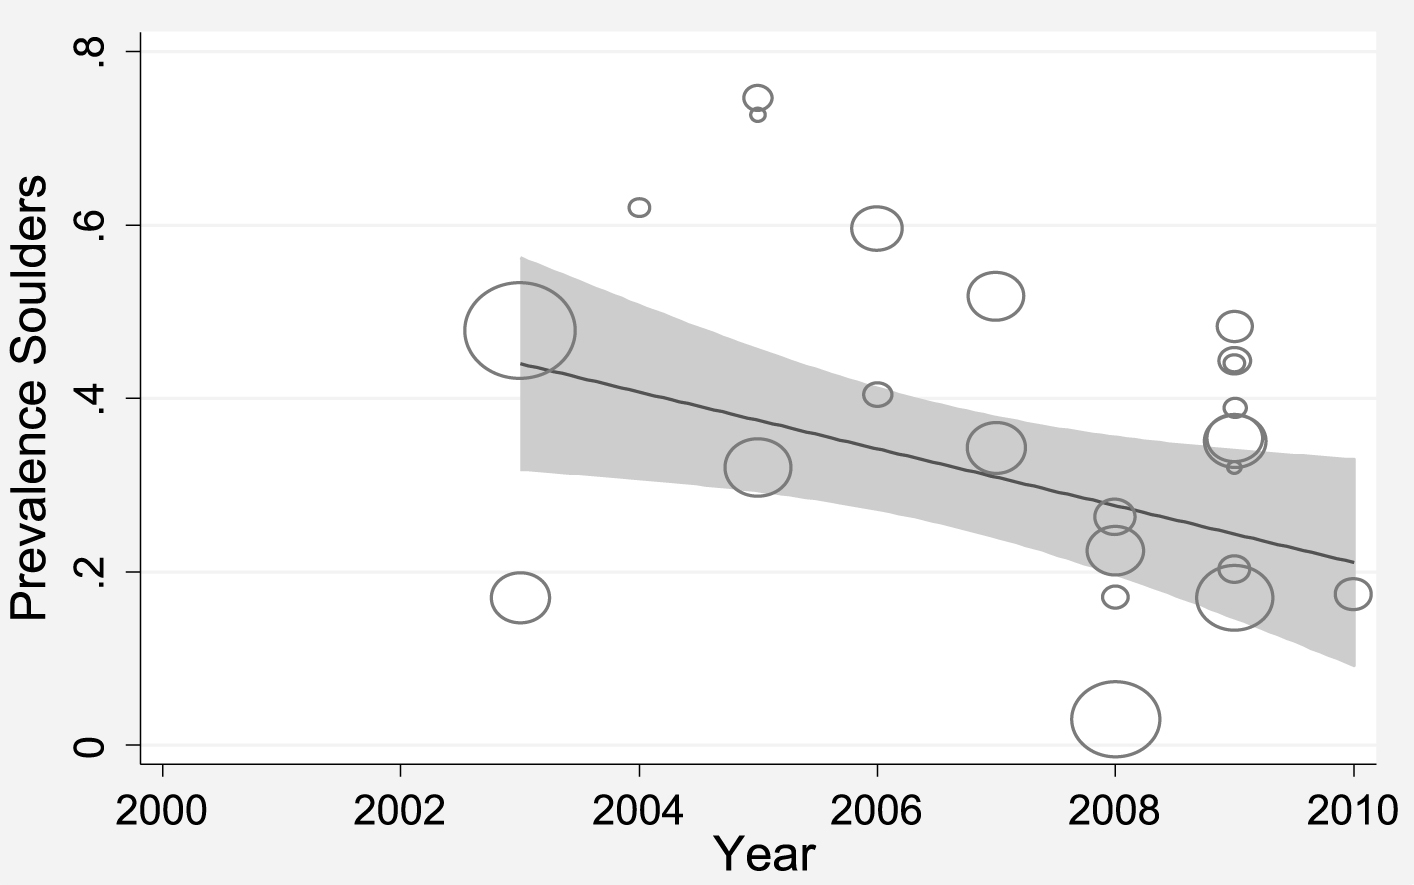
Meta-regression curve of shoulder pain prevalence was in terms of year of studies. Circles indicate the sample size in the study. Larger circles represent greater sample size.
Samples of the prevalence of low back pain are shown in Charts 3 and 4. In addition, Chart 4 depicts meta-regression curve of low back pain prevalence with regards to years of studies.
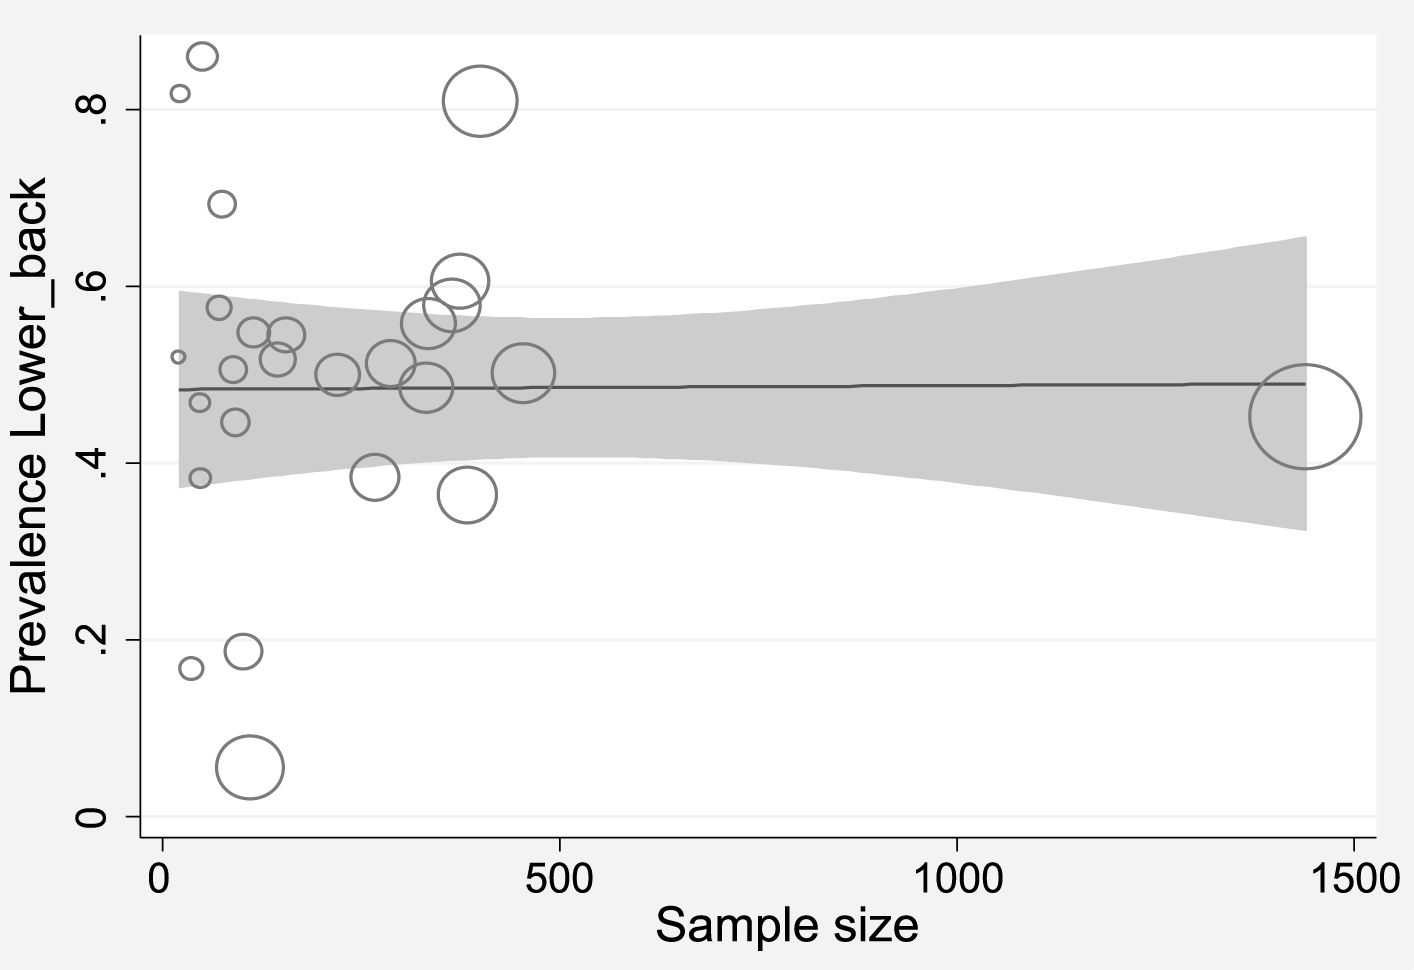
Curve of low back pain prevalence in terms of sample size. Circles indicate the sample size in the study (study weights). Larger circles show that the sample size is greater.
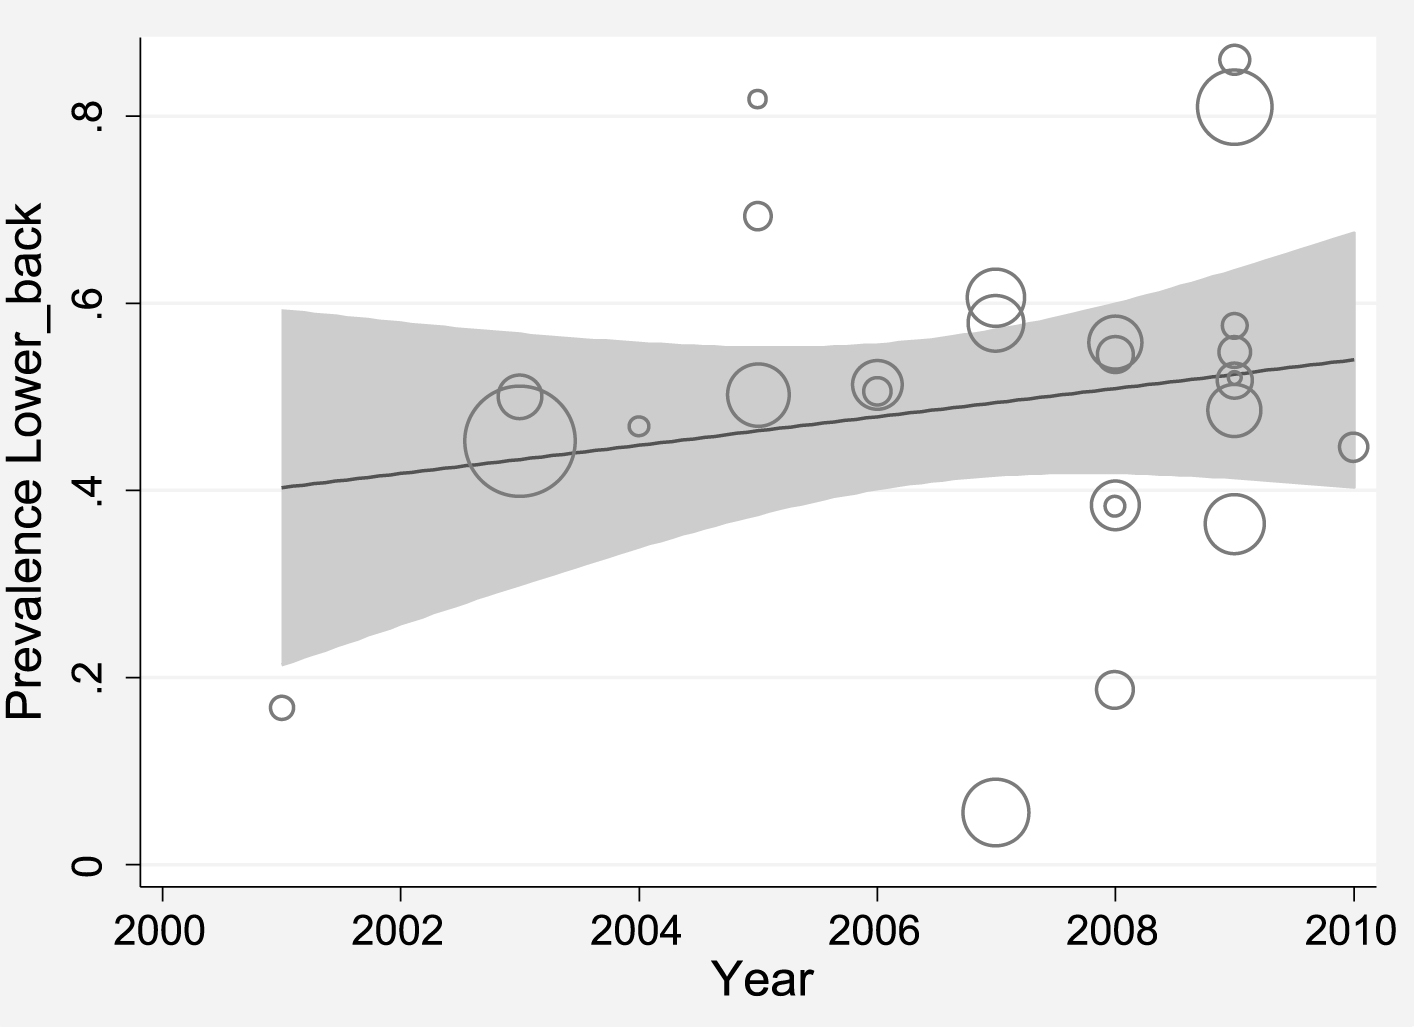
Meta-regression curve of low back pain prevalence with regards to years of studies. Circles indicate the sample size in the study. Larger circles represent the greater sample size and the vice versa.
6,090 workers were involved in this study. Twenty seven articles were included in the final meta-analysis and the average sample size was 225. The prevalence of musculoskeletal disorders in the upper limbs was measured.
Heterogeneity in the prevalence rate of WRMSDs was more than 97%, which according to categories (less than 25% is regarded as Heterogeneity component, between 25 and 75% is regarded as normal heterogeneity, and more than75% implies severe heterogeneity) was classified as extreme heterogeneity. In addition, the prevalence of musculoskeletal disorders in the lower limbs was measured. The heterogeneity rate of WRMSDs incidence was calculated to be more than 97%, which indicates extreme heterogeneity of the studies. Therefore, the random effects model was used for assessment. The random effects model assumed that there were differences due to various samplings and that of the measured parameters in the studies were different as well.
Results from the study by Azizpour et al. (2013), entitled “Assessment of back pain prevalence during life in Iran by meta-analysis” reported that the reviewed studies were highly heterogeneous and the heterogeneity index of their study was 98.8 [43]. The Nordic questionnaire was used to collect data about the prevalence of WRMSDs in all studies. In our study, prevalence of disorders were estimated in different parts as: the neck 31.8% (95% CI: 24.1 to 39.4), the shoulder 36.8% (95% CI: 29.4 to 44.1),the elbow 17.4% (95% CI: 12.7 to 22.1),the wrist 34.6% (95% CI: 27.1 to 42), and the upper back 38.1% (95% CI: 29.9 to 46.4). In the present study, no significant difference was reported between incidence of disorders in different years (p = 0.774) and different sample sizes (p = 0.353). A research study by Mostaghaci et al. (2010, about the prevalence of musculoskeletal disorders among 92 workers of a food production factory in Yazd [44] showed that the prevalence of lower back, shoulder, neck and wrist were 44.6, 17.4, 9.9, and 22.2% respectively.
Results of a systematic review of 24 studies by Osborne et al. (2012), depicted that the prevalence of musculoskeletal disorders of any type over the farmers’ lives was 90.6% while the one-year prevalence was 76.9% (CI 95%: 69.8 to 82.7). The results of their study indicated that the prevalence of upper limbs were within the range of 3.6–71.4% and lower limbs were 10.4–41% [45]. Based on a study by Mostaghasi et al. (2010), in Yazd on 92 workers of a food production company, the prevalence of low back disorders was reported as 44.6% [14]. In our study, the prevalence of musculoskeletal disorders in different body parts in lower limbs were as follows: the back, 50% (95% CI: 57.5 to 42.5), thighs and buttocks, 20.7% (95% CI: 25 to 16.4), knees, 42.1% (95% CI: 49.1 to 35.1) and ankle, 27.7% (95% CI: 36.7 - 18.8). Among musculoskeletal disorders in lower limbs, back pain with a prevalence of 50% (95% CI: 57.5 - 42.5) had the highest prevalence. Low back pain in health care professionals such as dentistry and nursing with the rate of 69% (95% CI: 66–71%) had the highest prevalence. In addition, the prevalence of low back pain in the large industrial cities was measured as follows: Tehran, 53% (95% CI: 59-47), Shiraz, 56% (95% CI: 62-50), Arak, 65% (CI 95%: 105-25) 56% (95% CI: 61-50). The results showed that prevalence of musculoskeletal disorders of the upper limbs in Tehran and Shiraz was more prevalent compared to the other cities and the lowest prevalence was recorded in the city of Yazd. The results of a study by Azizpour et al. demonstrated that the prevalence of life time low back pain in Tehran and Shiraz were higher than that in Yazd [43]. According to Memarpour’s research on dentists, physical workload was an important factor in causing MSDs and pain at the shoulder, neck and back were the most common complaints [46]. In their 20015 study, it was concluded that the prevalence of musculoskeletal disorders of the upper limbs was higher, as compared to the other years. The highest WRMSDs prevalence in Tehran has been observed in a study conducted among workers of the appliance manufacturing industry. The prevalence of WRMSDs, in a study reported by Mirmohammadi et al. (2004), during a one year period was 24% in the neck, 17% in the shoulder and arm, 9% in the upper back and 50% in the lower back [47]. Workstation ergonomic design and ergonomics training would result in a reduction in work-related risks of musculoskeletal disorders, especially the risk of upper extremities and back pain [48]. So, ergonomics and occupational health training based on prevention of musculoskeletal disorders is recommended [49, 50]. Limited access to the full text of all articles, absence of specific frameworks for reported publications, lack of access to the data on these publications and low quality and quantity of Persian databases were some of the study limitations [51].
Conclusion
Prevalence of work-related musculoskeletal disorders in the upper limbs, especially in the shoulders and upper back was high in Iran. The overall prevalence of musculoskeletal disorders was 31.8% for neck, 36.8% for shoulders, 17.4% for elbows, 34.6% for the wrist and 38.1% for upper back. The overall prevalence of low back pain in this study was 50%.
The prevalence of WRMSDs in the lower limbs, especially in the back and knee in Iran was higher in comparison with other similar studies carried out abroad. Ergonomics and occupational health trainings are recommended as strategies to reduce the risk of work-related musculoskeletal disorders.
Conflict of interest
The authors of this research have declared no conflicts of interest.
Footnotes
Acknowledgments
The authors wish to render their sincerest gratitude to Student Research Committee of Ilam University of Medical Science for the financial support they provided.
The corresponding author gratefully thanks Dr. Afshin Samani for her contribution in editing of some parts of the article.