
Abstract
BACKGROUND:
While a considerable body of research has studied safety climate and its role as a leading indicator of organizational safety, much of this work has been conducted with Western manufacturing samples.
OBJECTIVE:
The current study puts emphasis on the cross-validation of a safety climate model in the non-Western industrial context of Iranian petrochemical industries.
METHODS:
The current study was performed in one petrochemical company in Iran. The scale was developed through conducting a literature review followed by a qualitative study with expert participation. After performing a screening process, the initial number of items on the scale was reduced to 68.
RESULTS:
Ten dimensions (including management commitment, workers’ empowerment, communication, blame culture, safety training, job satisfaction, interpersonal relationship, supervision, continuous improvement, and reward system) together with 37 items were extracted from the exploratory factor analysis (EFA) to measure safety climate. Acceptable ranges of internal consistency statistics for the sub-scales were observed. Confirmatory factor analysis (CFA) confirmed the construct validity of the developed safety climate scale for the petrochemical industry workers. The results of reliability showed that the Cronbach’s alpha coefficient for the designed scale was 0.94. The ICC was obtained 0.92.
CONCLUSION:
This study created a valid and reliable scale for measuring safety climate in petrochemical industries.
Introduction
Accidents such as Bhopal and Chernobyl showed that organizational factors play an important role in the accident sequence. The impact of organizational factors on occupational accidents has been studied in recent years [1–4]. Gonçalves (2012) found that 35–40% of the factors related to the occupational accidents are organizational [5]. Amparo and Alistair (2002) found that these factors could be considered as determining factors in preventing occupational accidents [6]. In occupational safety climate assessments, several safety climate studies showed that organizational factors as predictors of accident occurrence and leading safety performance indicators [7–9]. There is a considerable need to develop a scale for describing and categorizing these factors, in order to study their impact on safety in petrochemical industries.
Safety climate dimensions
A number of dimensions of safety climate have been identified in the literature. The following aspects were selected based on their frequent presence in safety climate studies in addition to evidence indicating their importance in predicting safe behavior.
Management commitment is one key aspect of safety climate demonstrating positive and supportive attitudes of top management towards safety[10, 11]. Management commitment and participation have been addressed in various studies of occupational accidents and safe behaviors. In their study, Smith and Cohen (1978), concluded that companies with low accident rates have higher levels of management commitment towards safety, compared to the companies with high accident rates [12]. In many different studies, it has also been illustrated that management commitment has an impact on behaviors related to employees’ job satisfaction, organizational commitment, and job performance [13]. In addition to the commitment, management participation is also an essential issue.
Findings of a study by HSE indicate that workers’ empowerment is important [14, 15]. The study concluded that companies that were seeking to make their safety management systems more efficient regarded involving their employees as the preferred method of enhancing safety performance [16, 17]. Hopkins (1995) showed that worker empowerment in safety and involving workers in decision making encourages them to give suggestions [14]. Worker empowerment is one of the important aspects of safety climate that can raise workers’ motivation to take safety accountability and reduce unsafe behaviors leading to less injuries [15, 16].
Blame culture refers to the proneness of management to punish workers when they make mistakes. Reason (1998) expressed that a useful reporting system depends on how a company handles blame and punishment. This lies at the heart of any safety culture [17]. To avoid blame or punishment from the management, workers may selectively determine the information to be reported, share the suitable information and conceal problems. This can have a negative influence on workers’ safety performance [3, 18].
Another identified organizational factor contributing to occupational accidents is safety training. Safety training is a continual process that is frequently reviewed and improved to take account of changing conditions, past experience and new growth. Three studies showed that safety training can influence safe behaviors. Their results also indicated that safety training has a considerable impact on employee safety perception. Safety perception has a meaningful correlation with occupational accidents [19–21]. Also, Lin and Mills (2001) discovered that safety training played an important role in reducing accident rate [22]. Indeed, effective training facilitates a sense of belonging among the workers which is, consequently making workers more accountable for safety atworkplace.
Improving safety communication in an organization is another way of enhancing the safety culture; such communication can help prevent accidents and injuries. Unfortunately, workers often do not speak up when they perceive dangerous behaviors [23]. Open safety communication refers to how safety information such as changes in production processes and job positions are distributed among groups in an organization [24]. Clarke (2006) concluded that safety communication reduces safety risk and, consequently enhances safety at workplace [25].
Safety supervision is also important in the success of health and safety management at work. Front-line supervisors have been identified as having an important role in safety management. According to Fleming (2001), four items in supervisor’s safety management are important including valuing subordinates, visiting the worksite regularly, a participatory method of management, and efficient safety communication [26]. Empirical studies determined that supervisors have a key role in ensuring safety at work [27].
The application of a reward system is another way to motivate employees [28, 29]. Rewards can be categorized into two classes, which are intrinsic and extrinsic. Intrinsic reward refers to something untouchable like approval and acknowledgement. Extrinsic reward includes salary, bonus, promotion, and job security. Zaidi and Abbas (2011) pointed out that the financial rewards offered a higher motivation to employees in comparison to non-financial rewards [30]. Therefore, an organization can apply rewards to promote safety behaviors or correct unsafe actsin it.
Harmonious interpersonal relationships refer to the relationships between workers and supervisors. This refers to the extent that workers can discuss with supervisors any issue openly in the workplace. Interpersonal relationships are vital in achieving the organizational aims as they facilitate organizational communication among colleagues and supervisors. Helmreich and Merritt (1998) observed that Taiwanese pilots place high value on keeping quality relationships with colleagues and supervisors [31]. Abbas Al-Refaie (2013) conducted a study on organization factors affecting safety performance using structural equation modeling. The results indicated that interpersonal relationships among the safety team members significantly affected safety self-efficacy through safety activities and significantly influenced safety awareness throughteamwork [3].
Standards for occupational safety and health must be continually improved [32]. Continuous improvement in safety is an organized and planned effort that seeks “incremental” improvement over time of current safety practices. This effort intends to improve an organization’s performance and is supported by an organizational infrastructure and a supportiveculture [33].
Various scales have been established for evaluation of the safety climate in different industries. Much of this work has been conducted with Western manufacturing samples. It is essential to develop industry-specific scales such as a new scale to measure the safety climate in Iranian petrochemicals companies. The main purpose of this study was to start the process of developing a safety climate scale that could be used in Iran.
Materials and methods
Instrument development
A preliminary safety climate questionnaire with 284 items was designed by the project group using a mixed method study. In the qualitative part of the study, the existing literature, including 72 articles and books, was reviewed to find the organizational factors affecting occupational accidents. Seventeen experts, including safety and health personnel and university professors, were individually interviewed. These semi-structured interviews were conducted to complete the list of parameters. The number of items was decreased to 68 after conducting a screening process for redundancy and the general aim of current study.
All safety climate items were rated on a 5-point Likert-type scales with ranging from 1 (strongly agree) to 5 (strongly disagree) to conduct the validity and reliability analysis.
Validity analysis
Validity refers to the degree that the measurement tool can correctly measure the extent of the subject. It is a significant index to measure the effectiveness of a questionnaire. High validity indicates that measuring instrument is able to measure the characteristics of the measured object; conversely, if validity is not high, the instrument couldn’t actually play its role.
Face validity
Face validity is defined as the degree to which a test seems to measure what it reports to measure [34]. To assess the qualitative face validity, the Persian version of the designed safety climate questionnaire was piloted with 20 experts as a target group. After the experts individually completed the questionnaire, they were asked to state their overall conception in responding to the statements of questionnaire. Moreover, to evaluate the face validity of the Persian version quantitatively, the impact score was calculated for items on the scale. A 5-point Likert scale was considered in which the selection of “always” standing for the most important was scored as 5 and “never”, which means the least important, was scored as 1. Through implementing the formula, item impact scores were calculated considering 1.5 as a cutoff point [35, 36].
Content validity
Content validity is a measuring tool for evaluating whether the sampling scope is fit for the content or activity that is to be studied. Content validity of this instrument was evaluated quali-tatively and quantitatively. For qualitative content validity, through interview with 17 experts in the field of safety and health, the experts were asked to express their editing ideas (i.e., grammar, wording and scaling of the scale). For quantitative content validity, to determine the content validity index (CVI), the experts were also asked to assess relevancy, simplicity and clarityof each item with the content according to Waltz and Bausell index. Values for CVI considered as the follows: <0.70: unacceptable; 0.7–0.78: revision and correction; ≥0.79: accepted [37].
Construct validity
Construct validity refers to the measurement tool’s ability to measure the object concepts. In order to establish construct validity, Exploratory Factor Analysis (EFA) and Confirmatory Factor Analysis (CFA) were conducted using the LISREL program.
The Exploratory Factor Analysis (EFA) was used for summarizing and classifying data into correlated groups. The sample size for the factor analysis should be at least three to five times the number of measured items. In this section, 404 workers completed the designed questionnaire and the factor structure was determined using “principal component analysis” with varimax rotation. In this study, the two primary tests were used to evaluate the fitness of the data for the EFA. Kaiser-Meyer-Olkin measure of sampling adequacy varies between 0 and 1, and values closer to 1 are better. Bartlett’s test of sphericity is based on the statistic chi-squared distribution. Viewing the appropriateness of the factor analysis method, the null hypothesis about the identity of the correlation matrix should be rejected and the significance of the Bartlett’s sphericity test should be inferior to 0.05 [38]. Eigen values greater than one and Scree plot were used to determine the number of factors to be extracted [39]. Factor loadings equal or greater than 0.5 were accepted [40].
For the Confirmatory Factor Analysis (CFA), the ratio of 1 : 4 or 1 : 5 is recommended for the items number to the sample size [41]. At this stage, 404 workers were randomly selected, completed the questionnaires and confirmatory factor analysis was carried out. For this purpose, LISREL 8.80 software was used to determine the model’s fitness. It has been suggested that researchers should determine the fitness of a model considering several indices [42]. Therefore, in this study, at first, Chi-fit index was investigated. Smaller values of this index show more perfect model fitness. It is well known that this index is sensitive to data distribution and high sample sizes. Researchers did not rely on this index and calculated ratio of chi square to its degrees of freedom.
Some sources suggest that for adoption of the model, the ratio of chi square to degrees of freedom should be less than three [43]. Other indicators used included: comparative fit index (CFI), incremental fit index (IFI), normed fit index (NFI), non-normed fit index (NNFI), goodness of fit index (GFI), adjusted goodness of fit index (AGFI), root mean square error of approximation (RMSEA), and standardized root mean residual (SRMR) [44, 45]. CFI, IFI, NFI, NNFI, GFI, AGFI indicators can vary between 0 and 1, where values that are closer to 1 would indicate a well-fitting model [46]. RMSEA between 0.08 and 0.10 shows a mediocre fit and below 0.08 provides a good matching of data to the model [47]. The acceptable value for SRMR is below 0.10 where values less than 0.8 show an adequate fitness and values less than 0.5 show good fitness [48, 49].
Reliability analysis
Data reliability analysis tests whether the information is reliable; it show whether the same measurement procedure give the same results.
It is a significant index to measure data quality. In empirical studies, academic circles generally use the internal consistency coefficient (Cronbach’s α coefficient). Values of Cronbach’s α≥0.70 were explained as satisfactory internal consistency [40]. To assess the stability reliability of test-re-test and intra-class correlation coefficient (ICC), 30 workers completed the designed instrument in two-week intervals. An ICC score ≥ 0.75 indicates excellent test-retest reliability. The data were analyzed using Statistical Package (Version 18, SPSS Inc., Chicago, USA).
Results
Demographic characteristics of the participants in the EFA have been shown in Table 1. The majority of the study subjects were male and most of them had 10–20 years of working experience.
Demographics of the participants in the exploratory factor analysis
Demographics of the participants in the exploratory factor analysis
Tests for quantitative face validity resulted in “impact scores” higher than 1.5 for all of the items. Thus, all items were kept for further analysis. In order to get the latest expert opinion, a new questionnaire was sent to two professors in the field of industrial safety. According to the professors, the questionnaires were appropriate and applicable. By asking workers about the indicators of this section, a few items requiring modifications were applied in the questionnaire.
To ensure the content validity of the instrument, recommendations by the experts were applied in the questionnaire. Quantitative content validity was determined with specified content validity ratio and the content validity index. Since the number of experts was 25 people, fourteen items that had content validity ratio less than 0.37 were removed. Five items with the content validity index between 0.38 and 0.8 were also excluded. These modifications led to the elimination of 19 items from the proposed questionnaire while 49 items were retained.
About construct validity, EFA results showed 404 workers of a petrochemical plant completed the questionnaire. The results of KMO = 0.8 and Bartlett’s test of sphericity (χ2= 1.52; P < 0.001) indicated that the factor analysis can be used to analyze the data. These results proved that there are visible correlations among variables.
As shown in Fig. 1, the EFA using principal component analysis resulted in the retention of ten factors with 37 items. The model identified by EFA was examined for CFA. The relative chi-square (χ2/df) was 1.83, indicating the fitness of the model (P < 0.001). Comparative indices of the model, including CFI, IFI, NFI, and NNFI were 0.95, 0.94, 0.91, and 0.93, respectively, indicated the goodness of data fitness. The RMSEA of the model was 0.082 (90% CI, 0.064–0.10). SRMR was less than 0.08 (0.06) confirming an acceptable fit for the model. As shown, approximately all indicators of goodness of the fit model were acceptable and confirmatory factor analysis indicated validity of thequestionnaire.
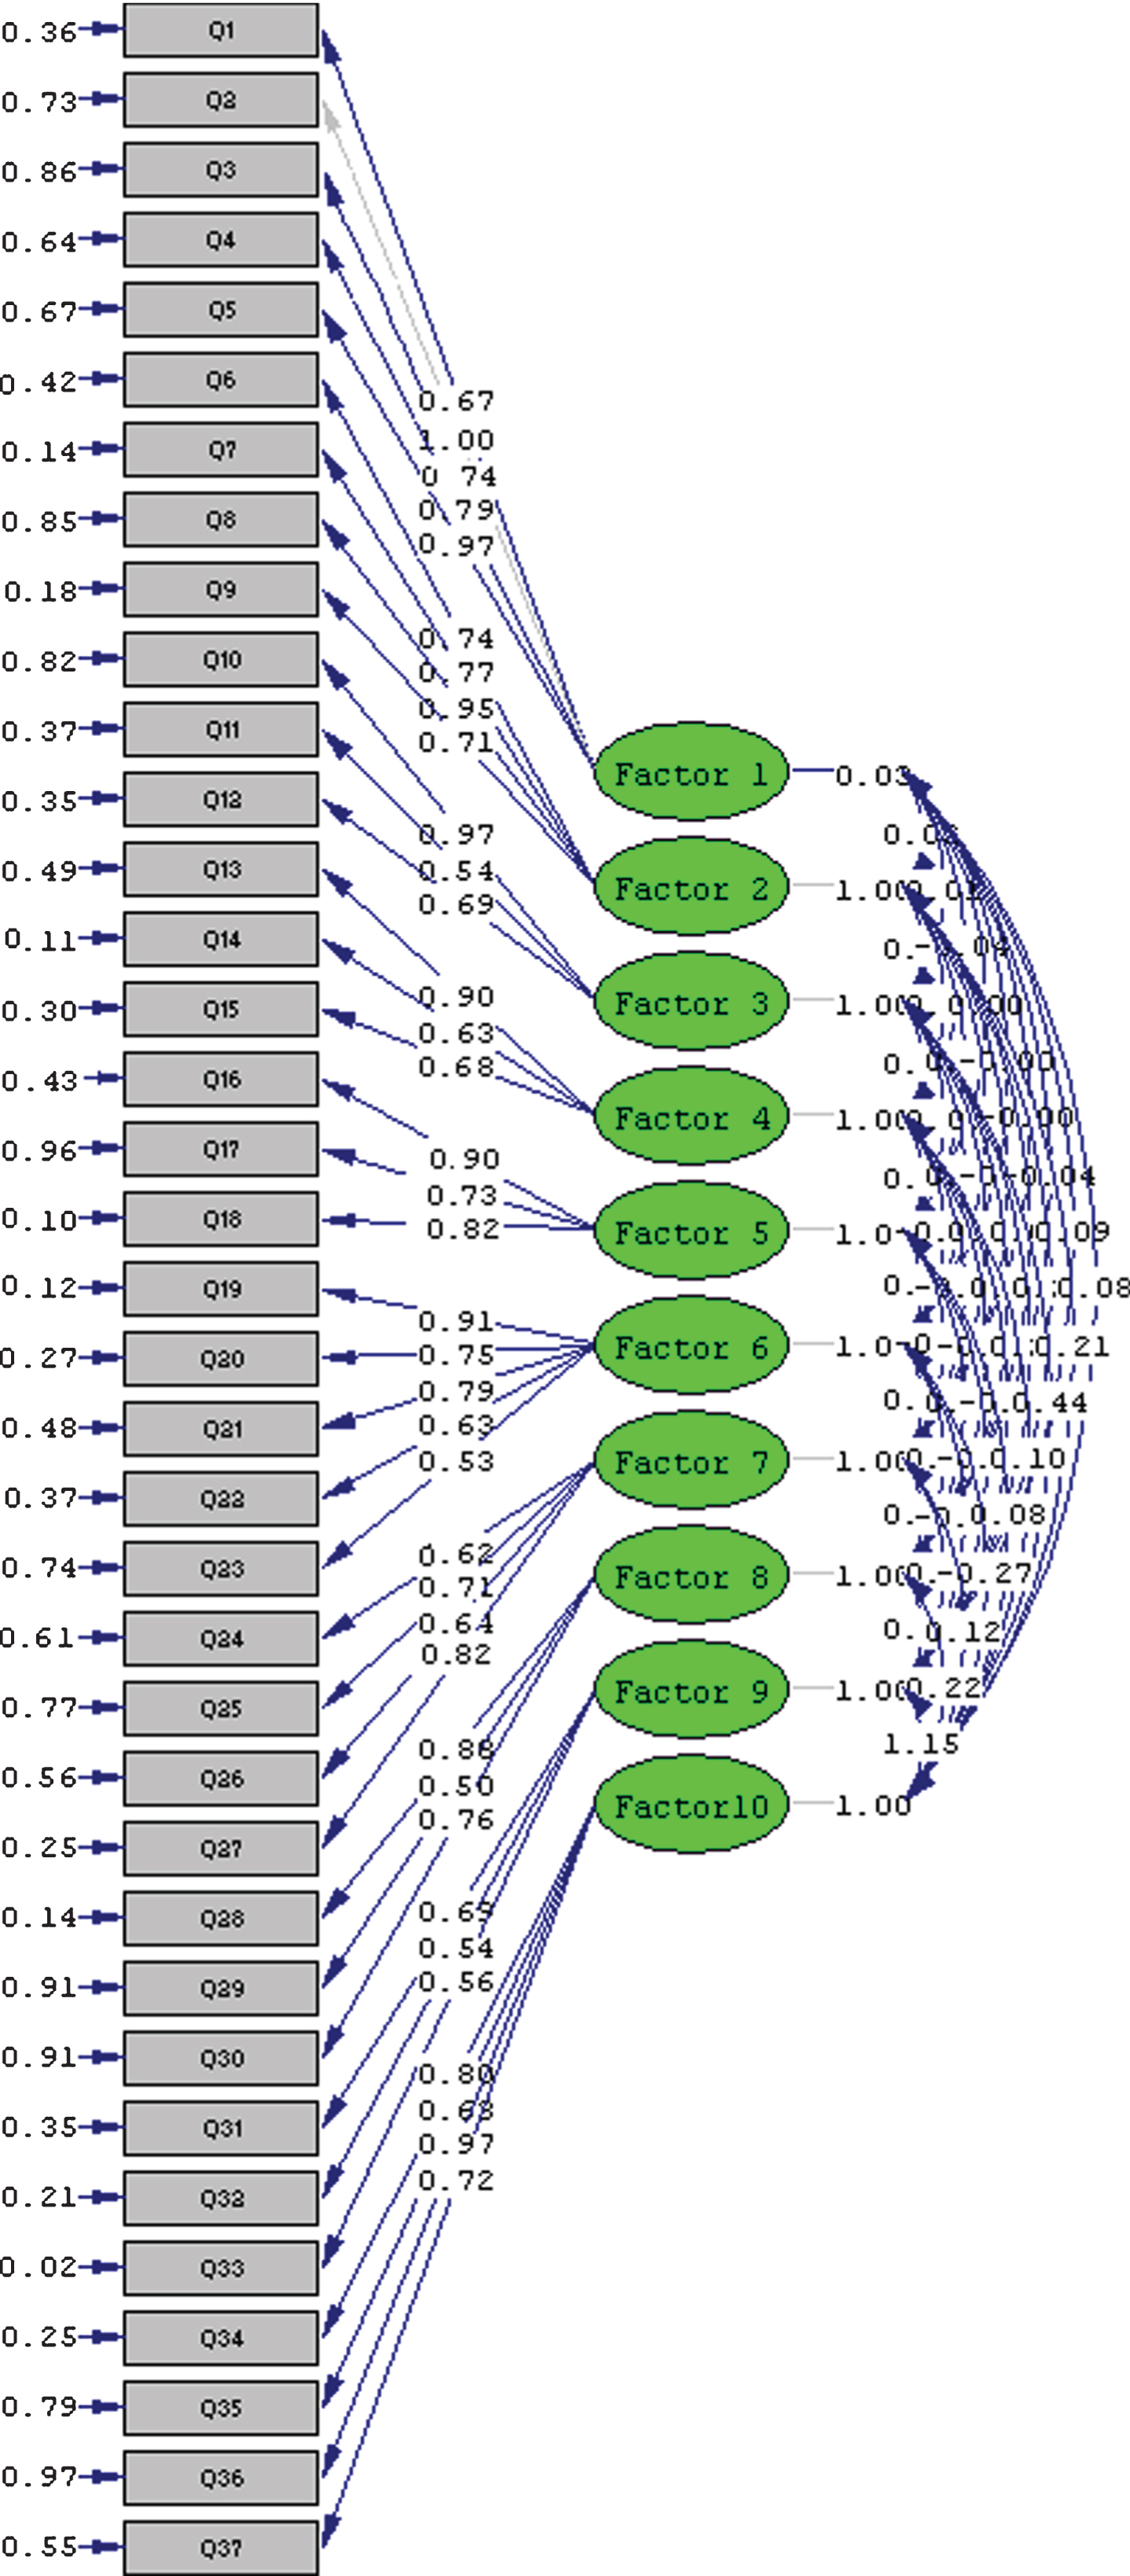
Confirmatory factor analysis of safety climate scale.
The results of reliability showed that the Cronbach’s alpha coefficient for the designed scale was 0.94. Moreover, Pearson correlation test of the scale approved correlation between the responses in the two times (r = 0.89). The ICC was obtained 0.92 ranging from good to excellent (Table 2).
Results of the exploratory factor analysis and Cronbach’s alpha values
The main objective of this study was to develop a safety climate scale. Literature review and expert interviews resulted to identify ten factor consisting management commitment, workers’ empowerment, communication, blame culture, safety training, job satisfaction, interpersonal relationship, supervision, continuous improvement, and reward system. An initial safety climate questionnaire with 284 items was designed and in next step the number of items was reduced to 68 after conducting a screening process.
According to content validity assessment by the safety experts, 19 items were deleted from the first group of 68 items. These items were unsuitable, redundant, and unclear. Thus, the revised tool consisted of 49 items. This study then investigated the construct validity of the questionnaire by the application of EFA and CFA. Using principal component analysis, the EFA resulted in the retention of ten factors with 37 items. The internal consistency reliability of the questionnaire was also acceptable. Therefore, the proposed scale is a valid and reliable tool for measuring the safety climate.
Findings about dimensions of designed safety climate scale are consistent with the results of previous studies. These studies reported that management commitment to safety, training, employee empowerment, job satisfaction [21, 51] communication [24], interpersonal relationships, continuous improvement [1], blame culture, safety supervision, and reward systems [3] are important safety climate dimensions.
Management commitment to safety has been usually described in prior studies and seems to form a key part of a general safety climate scale [8]. Furthermore, the meta-analysis reported by Beus, Payne, Bergman, and Arthur (2010) established that management commitment to safety was the strongest predictor of occupational injuries [52]. The current findings illustrated that for the present Iranian manufacturing sample, three aspects related to the role of management in safety emerged. The first related to management actions, including communication, and the second to management support for safety improvement. The third aspect, safety priority, reflects the extent to which safety is prioritized with respect to other organizational goals such as productivity. This is a common underlying theme in safety climate models and has been featured in previous research [53].
This study showed some theoretical and useful suggestions. First, a safety climate scale suited for the petrochemical industry had not been presented prior to the present study. The development of a manufacturing-specific safety climate scale has been recommended as a method to recognize the ways in which awareness of safety climate is context-dependent [54]. Knowing the best ways to measure and assess safety climate in special manufacturing can lead to the creation of more real hypotheses connected to how climates develop. Furthermore, industry-specific safety climate scales would also permit for more specific suggestions and interventions, for the reason that the measures themselves are highly contextualized.
Second, this study provided sufficient empirical evidence to support the theoretical recommendations from Zohar [54, 55]. This study emphasized two different levels of awareness regarding safety climate in the petrochemical industry, which led to the development of the organization and group-level safety climate sub-scales. This is closely linked to the process of safety climate formation and transfer from the organizational level to the individual worker’s level via the work group. In this regard, future studies on safety climate in the petrochemical industry would benefit from the use of the newly developed level-specific safety climate scale.
There are some limits to the current study. First, regardless of the fairly large sample size, only one company participated in this study. Therefore, one should be a cautious in generalizing the project’s results to other petrochemical industries. Second, when recruiting companies, those with poor safety records may have been reluctant to participate; therefore, there may be selection bias. Third, the survey itself was cross-sectional. A future longitudinal study could provide stronger support for causal relationships between safety climate and safety outcomes.
Conflict of interest
The authors declare that there is no conflict of interest.
Footnotes
Acknowledgments
This study is part of a larger study conducted for a doctoral dissertation that was approved by the Ethical Committee and was supported by a re-search grant for Ph.D. dissertation in The National Petrochemical Company (NPC), Iran. The authors would like to express their sincere gratitude to this center and all the participants for cooperating in this study.