
Abstract
BACKGROUND:
The inability to perform productive work due to mental disorders is a growing concern in advanced societies.
OBJECTIVE:
To investigate medically certified mental disorder and all-cause sick leave in a working population using demographic, socioeconomic and occupational predictors.
METHODS:
The study population was the entire Swedish work force aged 16-64 years in December 31st 2011. The outcome was sick leave exceeding 14 days in 2012 with adjustment for 13 confounders.
RESULTS:
The risk of sick leave with a mental disorder is higher among women compared to men, among persons aged 30–39 and among parents in families with underage children. Employees in welfare service occupations within health care, education and social services have an elevated risk of mental disorder sick leave and constitute a large proportion of the workforce.
CONCLUSION:
The results support the need for improving early detection and prevention of mental disorders in the workforce. Improvements in psychosocial work environments are essential, where the higher risk in female dominated welfare occupations particularly, have repercussions on the quality of the welfare services provided for vulnerable groups in society. Better work-life balance in families with younger children could also mitigate the effects of a high total workload in that particular phase of life.
Introduction
Mental disorders have emerged as a major cause behind long-term sick leave in economically developed countries including Sweden [1–5], and approximately five percent of the population in working ages suffer from severe mental disorders and another 15 percent has mild to moderate mental disorders [6]. At the societal level mental disorders cause direct costs within the healthcare system, but the bulk are indirect costs due to loss of production including insurance costs [7–9]. At the individual level the adversities are multifaceted including reduced quality of life, social stigma, isolation, discrimination, substance abuse, comorbidity and premature death [10–16]. In order to prevent mental illness and reduced ability to perform work there is a need for increased knowledge about causes and risk factors [1, 17]. To the best of our knowledge, this is the first study examining a broad array of potential risk factors for long-term sick leave due to mental disorders for an entire working-age population. The most noteworthy feature of the study is the estimation of relative risks between all employees in the labour force broken down into 113 occupations.
Sick leave due to mental disorders – potential predictors
A previous systematic review presented several potential predictors for mental disorder sick leave including psychosocial, demographic, socioeconomic and work related factors, but the evidence base for more than a decade ago was still very limited [17].
In a recent Norwegian cohort study of long-term sick leave due to psychiatric illness, reported risk factors were: female gender, low education, poor work superior support, mental distress, poor general health and for men also alcohol problems, with the three latter factors interpreted as intermediate factors [18]. It is well established that women have a higher prevalence of depression and anxiety disorders and a more overt help seeking behaviour [19]. The higher incidence rates for mental disorder sick leave among women may also be due to “double burden” caused by extensive demands at home and at work [20]. Several studies have also demonstrated the relation between double burden and mental distress [21, 22] and sick leave [23–26]. However, other studies have failed to show an association [27, 28]. Hence, the literature examining the effects of double burden on worker health and sick leave do not provide a clear picture.
Another factor generally believed to have high relevance for mental disorder sick leave is adverse psychosocial work conditions. An association with all-cause sick leave has been found throughout European countries [29], and the link with mental health is well established [30–32]. The number of studies of mental disorder sick leave is growing, particularly for job strain and effort-reward imbalance [33–39]. Adverse psychosocial work environments could also aggravate the impact of strenuous physical work [40]. In the current study, the direct role of psychosocial and physical work environments cannot be explicitly studied. However, some proximate factors were used instead. The most important work-related factor is occupation, with adverse work environments being more common within certain occupations [41]. In addition, private or public sector employment could reflect differences in the balance between effort and rewards [39].
Several other factors previously found to be relevant are scrutinized as well in our analysis. These are gender, age, immigrant status, civil status, children in the family and their age [18, 42–44]. Furthermore, a number of socioeconomic factors alongside occupation and employment sector are studied. These are labour income, education, and occupational status [18, 46]. In addition, sick leave history and the presence of disability pension are used as indicators of baseline health and work ability [18, 48]. Finally, a classification of the municipality of residence is used to capture a separate contextual factor found in previous studies to affect mental health and work ability [38, 49].
Brief overview of sick leave and sickness insurance in Sweden
All persons working in Sweden, both employees and the self-employed, are covered by social insurance that compensates incapacity to work due to sickness or injury. Unemployed persons are also entitled to a sickness cash benefit if they are temporarily unable to search for work due to illness or disease [50]. A doctor’s certificate is required from the 8th day of absence from work. For employees, compensation for the first 14 days of sick-leave is paid by the employer, and is not recorded in the social insurance registers [50].
In an international perspective, until 2003, days of sickness absence per person among Swedish employees was among the highest in the EU. Thereafter strict application of the existing rules and from 2008 even stricter rules led to a steady decline [51]. However, sick leave began to rise again in 2010 particularly among women and for diagnoses classified as mental disorders [50].
Aim
The aim of this study was to investigate medically certified mental disorder and all-cause sick leave exceeding 14 days in the Swedish working population with regard to a number of demographic, socioeconomic and occupational factors.
Methods
The population at risk, i.e. the insured residents in Sweden in ages 16 to 64 years the 31st of December 2011 were identified in the registers maintained by the Swedish Social Insurance Agency (SSIA) and their subsequent sick leave during the follow up year of 2012. After exclusion of individuals who emigrated or died during 2012 (53, 135 persons of which 11, 661 deceased) the population eligible for analysis consisted of 6, 192, 397 persons.
Measures
Sick leave
Cases of sick leave compensated by Swedish sickness insurance were retrieved from the MiDAS database (Micro Data for Analysis of Social Insurance) with data originating from registers held by the SSIA. All spells exceeding 14 days with onset during 2012 were included in the study. Medically certified sick leave exceeding two weeks could be considered less voluntary and therefore closely connected to illness and disease [52–54].
Recurrent spells were excluded so each individual only contributed with one spell in the analysis. The total number of all-cause cases was 368, 359 with 230, 628 for women. Mental disorder sick leave was considered for cases with a ICD-10 main diagnosis within chapter V (F00-F99) on the first registered medical certificate. The total number of mental disorder cases was 81, 925 with 58, 036 for women. The majority of mental disorder cases were within mood disorders (F30-F39) and neurotic, stress-related and somatoform disorders (F40-F48) which constituted 95 percent of the mental disorder sick leave cases among women and 90 percent among men.
Predictors
Several variables originating from the registers held by the SSIA, recorded at baseline in December 2011, were used as predictors of prospective sick leave. The categories for each predictor are presented in Table 1 (appendix). The predictors were sick leave history, sex, age, civil status, children in the family and their age, immigrant status, labour income, disability pension and finally place of residence (according to the Swedish Association of Local Authorities and Regions, SKL 2011).
Additional predictors such as education, employment sector, occupation and occupational status originate from registers held by Statistics Sweden (SCB) and recorded at baseline in December 2011. Occupation were measured according to the Swedish version of ISCO-88 in 113 minor groups of occupations.
Statistical analysis
All statistical analyses were performed using SPSS Statistics for Windows (release 22). Logistic regression was used to analyse the odds of prospective sick leave for all-cause and mental disorder sick leave and the corresponding 95% confidence intervals (CI). All the results presented are fully adjusted for all the included predictors. Since sick leave was fairly common the odds-ratios (OR) were recalculated to relative risks (RR) according to the formula RR = OR/(1 + OR). Missing values for predictor variables constitute distinct categories in the analysis, but their results are not presented since they lack meaningful interpretation. Furthermore, all analyses have been stratified by sex, but the conjoint models will be presented in the paper since the predictor patterns are very similar for women and men.
Ethical standards
The Swedish Social Insurance Agency (SSIA) was commissioned by the Swedish ministry of health and social affairs to conduct the study (S2013/1239/SF). The register data used is stored and processed under strict secrecy in accordance with Swedish law on official statistics (2001:99) and the data can only be used for production of social insurance statistics or research within the SSIA.
Results
The distributions of subjects across different predictor categories are presented in column “n” in Table 1 (appendix). Among the subjects, 48.5 percent were women. In Table 1 (appendix) the RR:s and 95% CI:s for mental disorder and all-cause sick leave are presented. Selected results from Table 1 (appendix) are illustrated in Figs. 1 to 4 with RR:s and 95% CI:s.
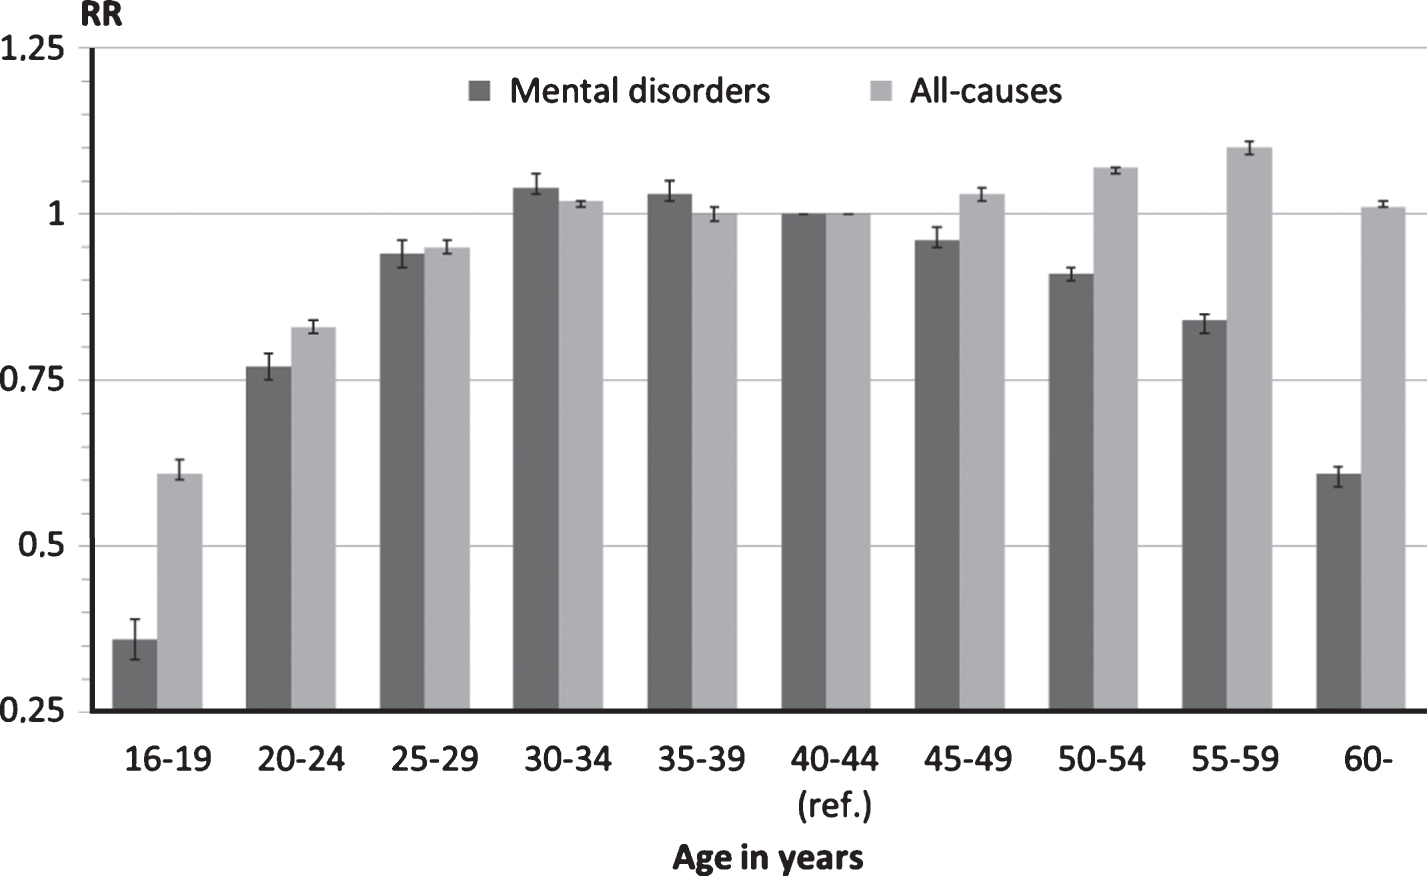
One year prospective sick leave >14 days by age due to mental disorders or all-causes.

One year prospective sick leave >14 days by civil status due to mental disorders or all-causes.
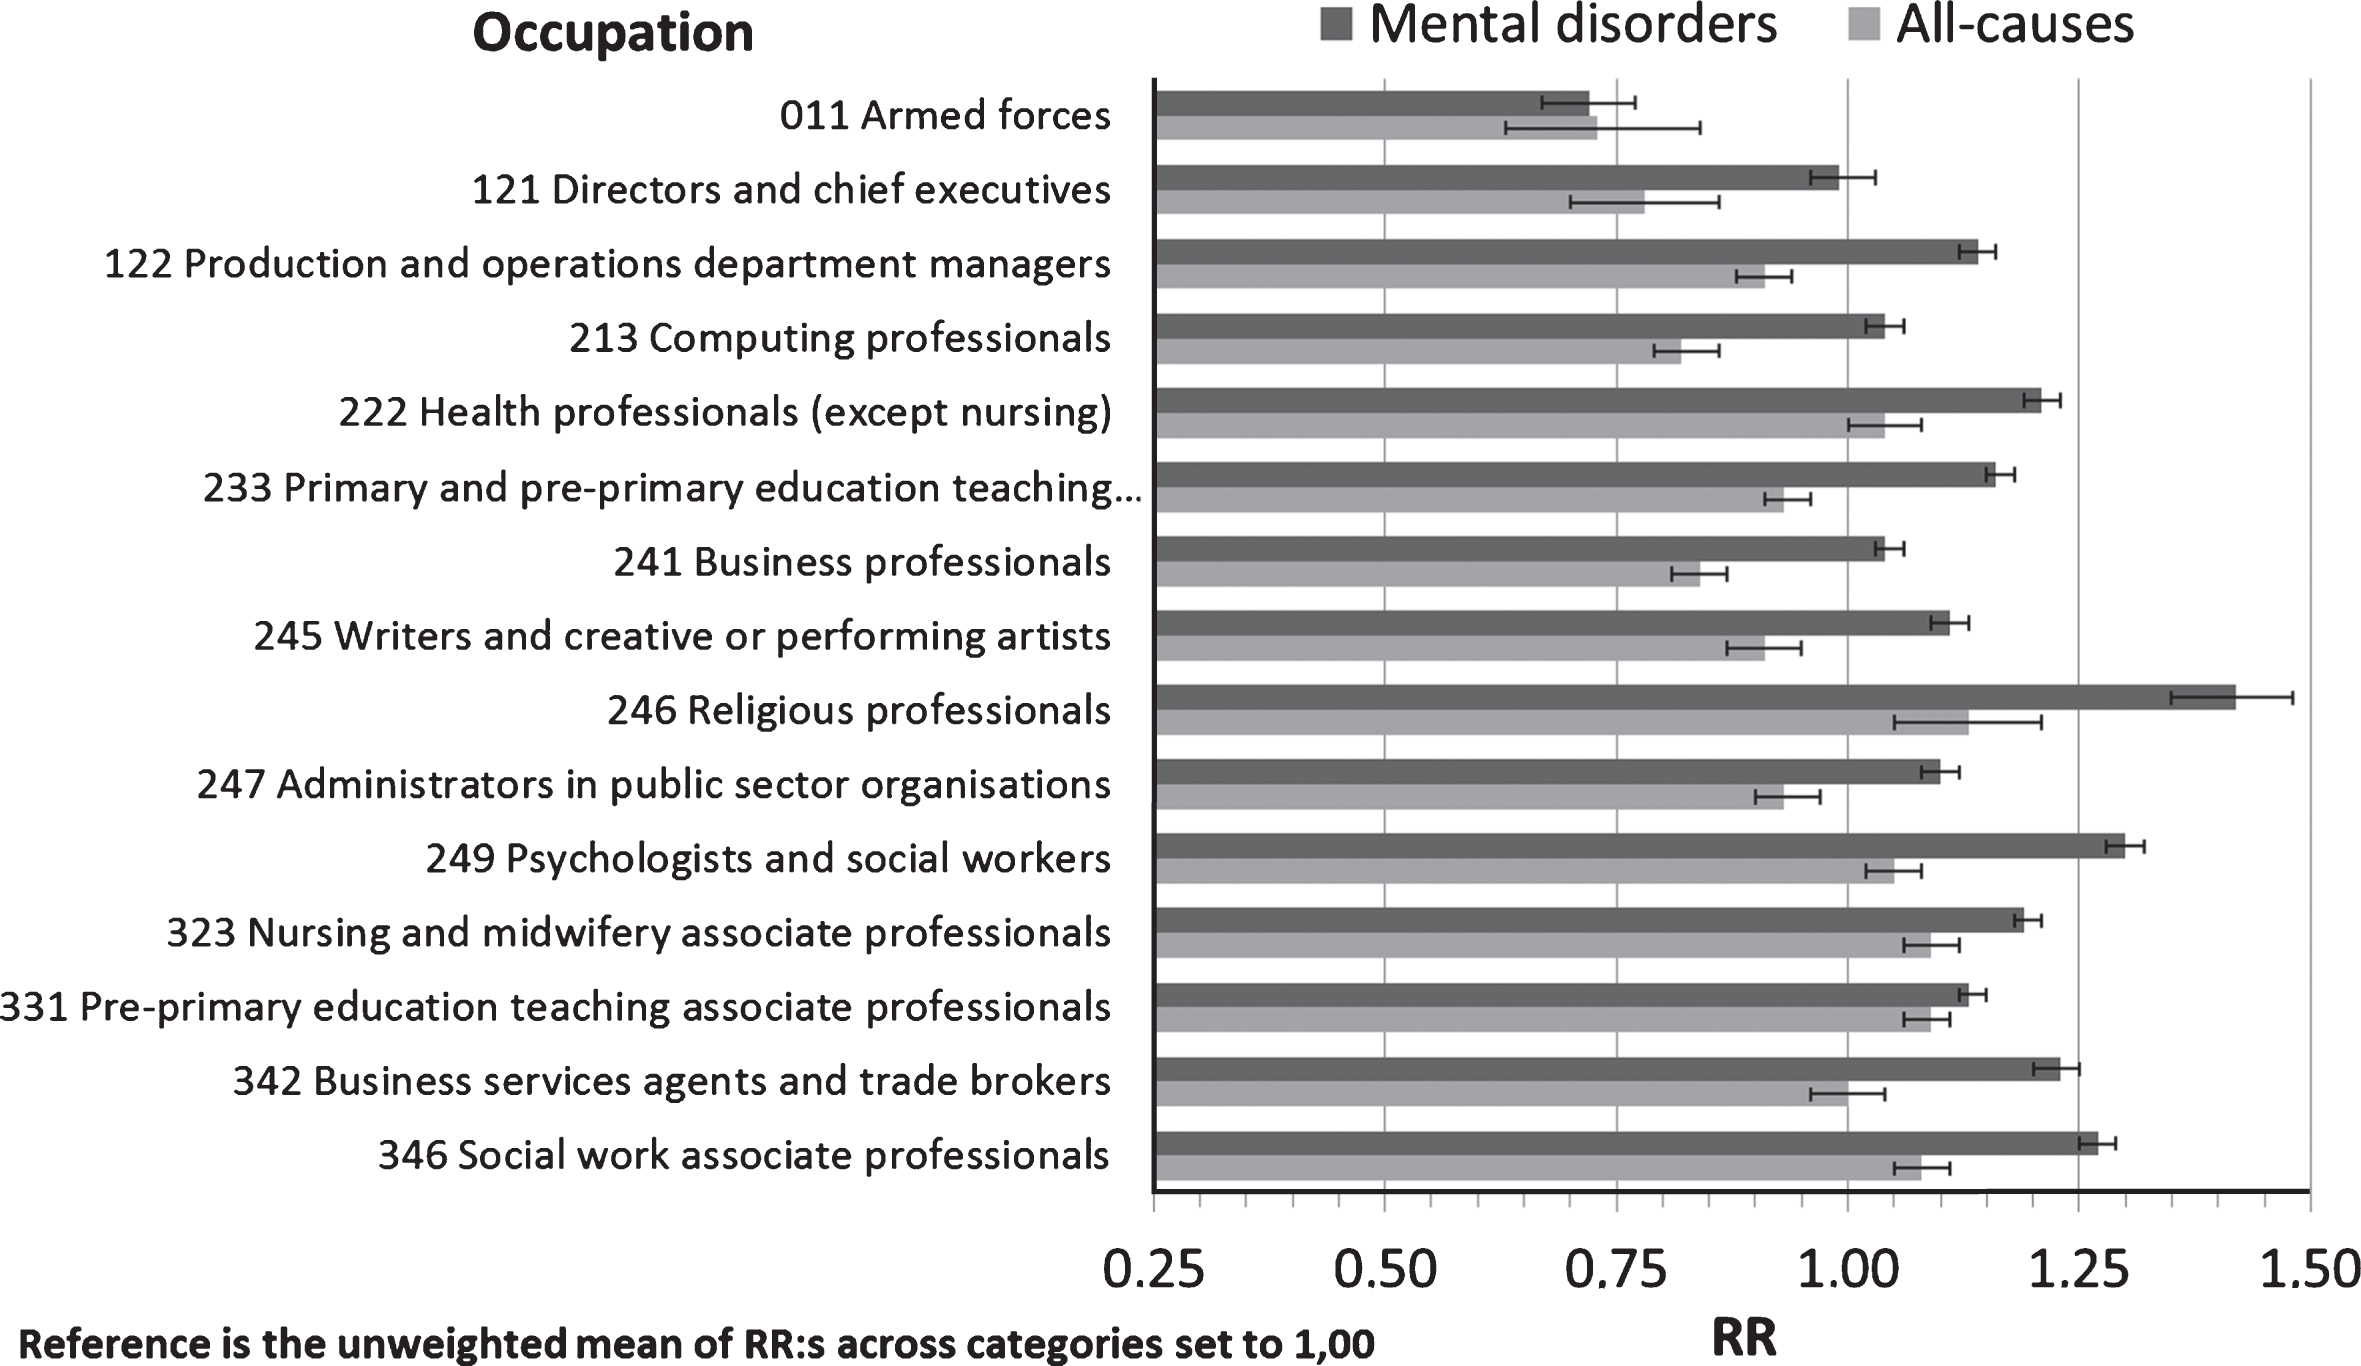
One year prospective sick leave >14 days by occupation (major group 0–3 ISCO-88) due to mental disorders or all-causes.
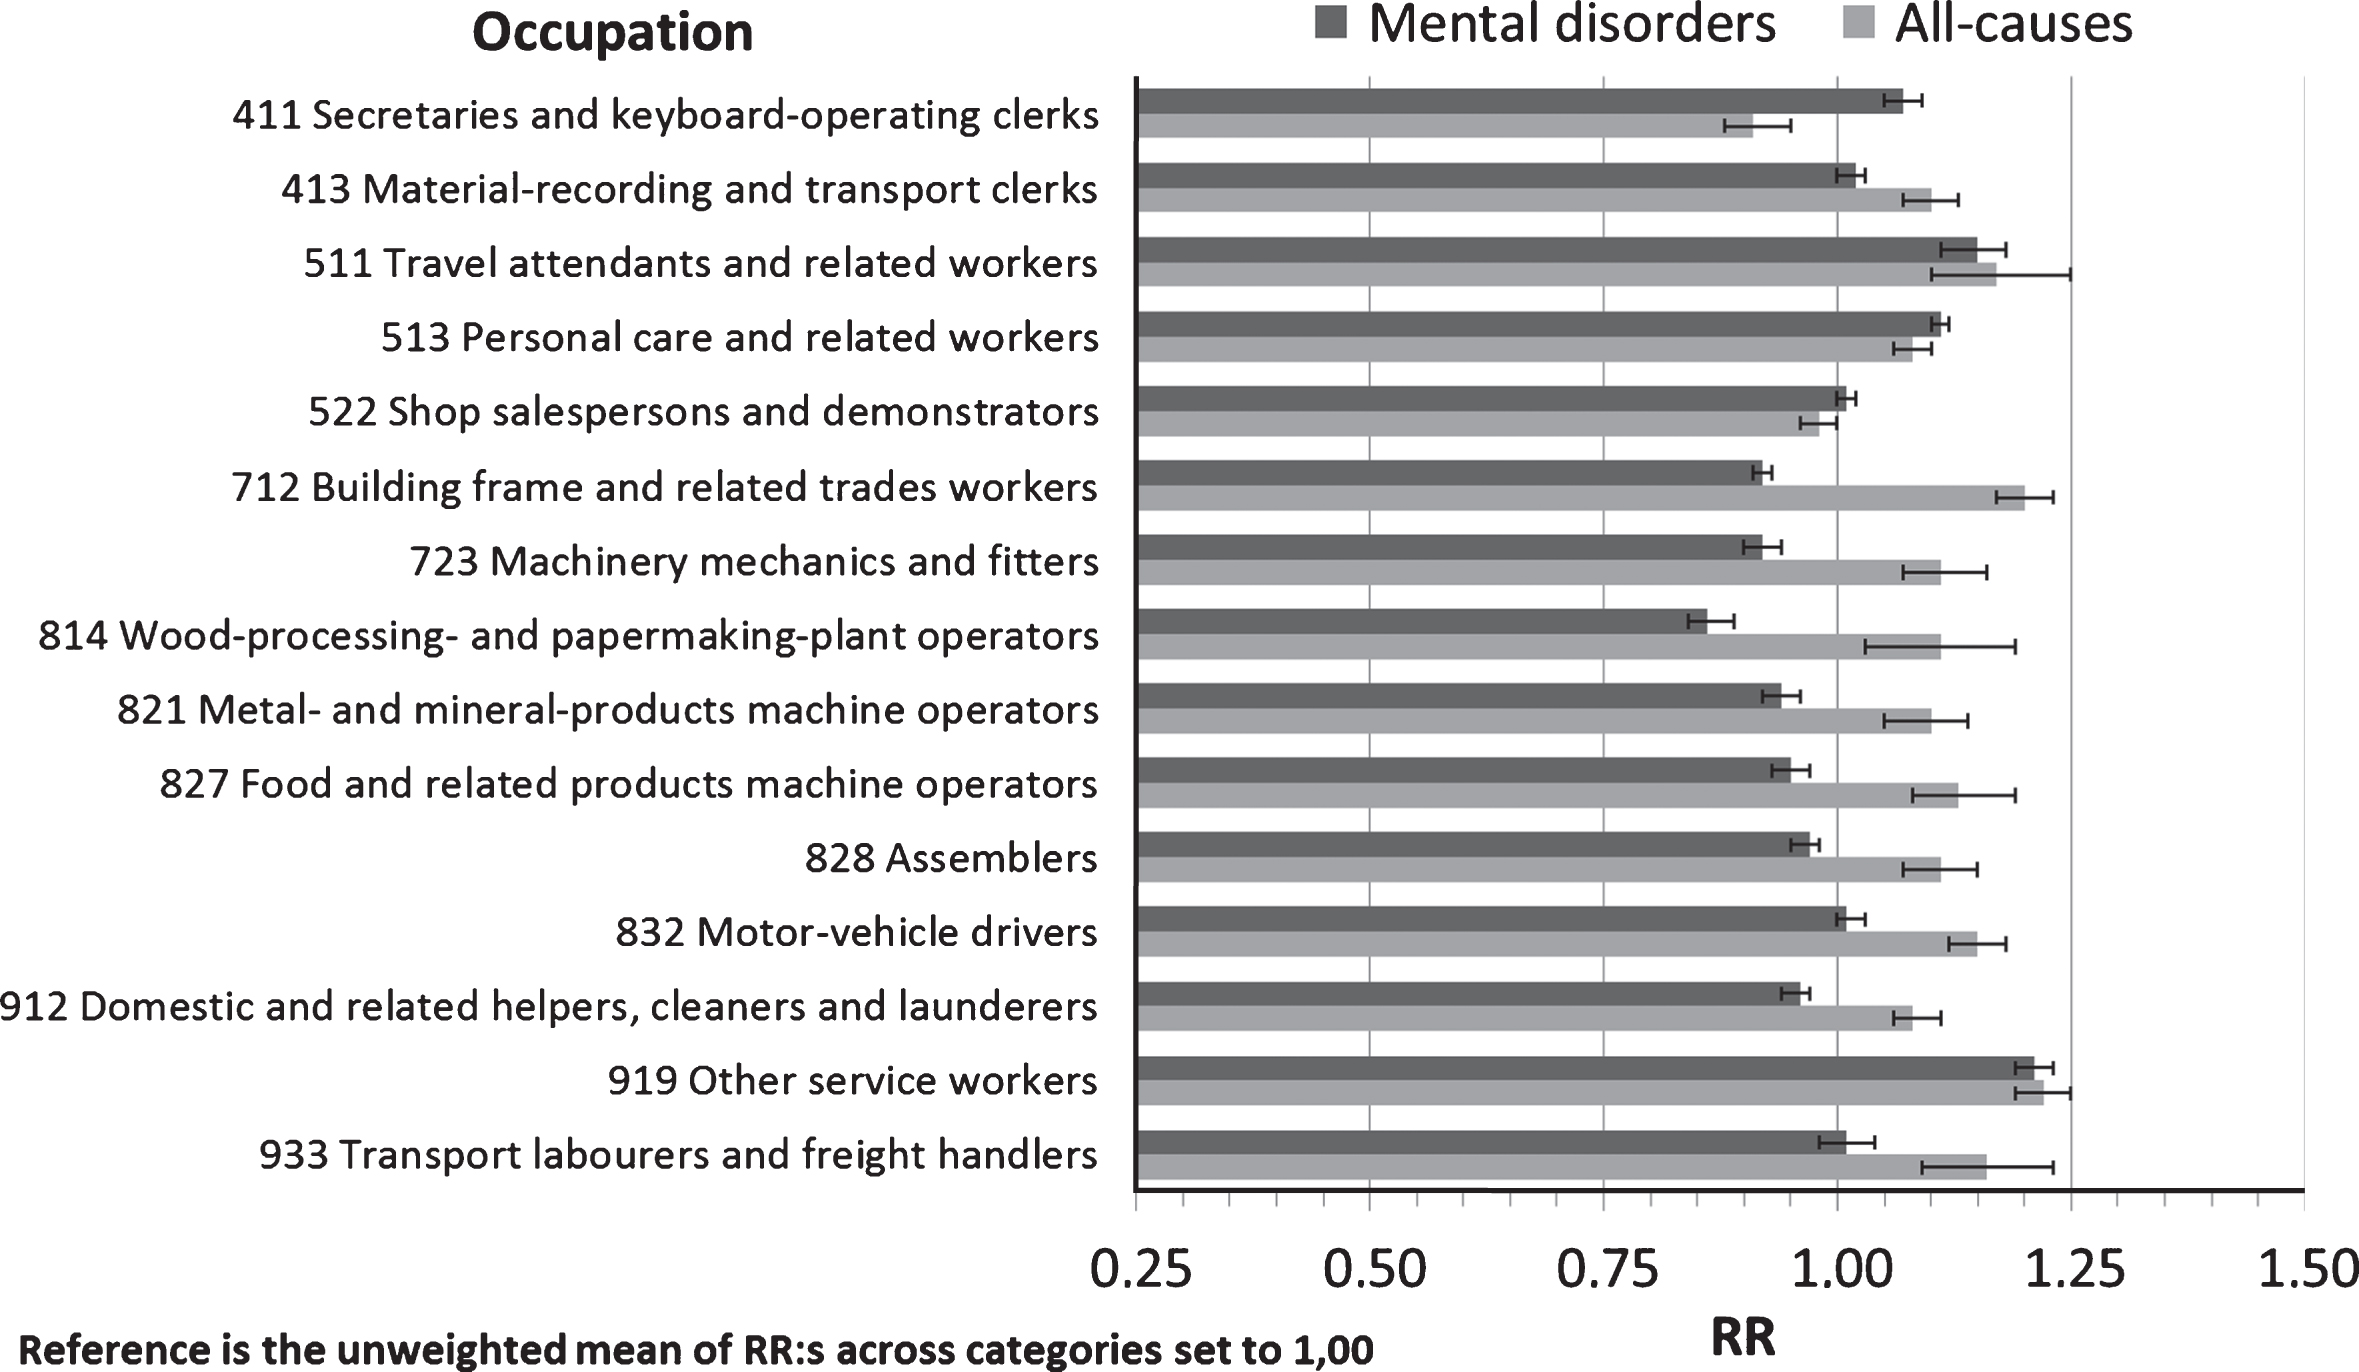
One year prospective sick leave >14 days by occupation (major group 4–9 ISCO-88) due to mental disorders or all-causes.
Women have a 24 percent higher incidence of all-cause sick leave than men, which is elevated to 28 percent for mental disorders. All-cause sick leave increases with age, but for mental disorder sick leave, the pattern is different with the highest risks in ages 30 to 39, see Fig. 1.
Civil status is also associated with prospective mental disorder sick leave, with higher incidence for unmarried persons, widows and widowers, and especially for those who are divorced, compared with married persons, see Fig. 2. Parents with children under 16 years of age do not have a higher risk of all-cause sick leave, but parents with children older than two years have a higher mental disorder sick leave incidence, see Table 1 (appendix).
Immigrant status may also influence sick leave, but for mental disorder sick leave, the incidence compared to native Swedes and those born in other Nordic countries is lower for those born in almost every other region of the world (Table 1; appendix).
For municipality of residence, a higher incidence of mental disorder sick leave was found in metropolitan (Stockholm, Gothenburg and Malmo) and suburban areas and a lower incidence in manufacturing and sparsely populated areas (Table 1; appendix).
Socioeconomic factors
As regards occupational status, persons not gainfully employed have an 18 percent lower risk of all-cause sick leave than those in gainful employment (employed or self-employed), see Table 1 (appendix). For mental disorders however, there is no difference in the risk of sick leave between those gainfully employed or not.
The sick leave incidence is higher among those below the median level of labour income and lower among those above the median. This holds for both all-cause and mental disorder sick leave but the higher risk is more pronounced for mental disorders among those just below the median income (Table 1; appendix).
The socioeconomic gradient is also reflected in education with a higher incidence of sick leave for both all-cause and mental disorder sick leave among those with nine or ten years of primary education and a lower incidence among those with post-secondary education (Table 1; appendix).
Occupational factors
As for employment sector, those employed in the public sector - including state, municipal and county council employees and employees in public sector enterprises - have higher risk of sick leave than persons employed in private enterprises (Table 1; appendix). This is true for both all-cause and mental disorder sick leave.
Turning to occupation the general pattern is on one hand that mental disorder sick leave is more common in occupations requiring post-secondary education, where all-cause sick leave is more uncommon. On the other hand, all-cause sick leave is more common in lower white collar and blue collar occupations where mental disorder sick leave is more uncommon (Table 1; appendix). In Fig. 3 and 4 a selection of occupations is presented based on size, or because they are considered to be archetypical within each minor group of occupations.
In Fig. 3, occupations mostly requiring higher education are presented. Persons employed within the armed forces and higher rank bosses have lower risk of all-cause sick leave than the average across all occupations. Lower rank bosses however, such as production and operations department managers, have a higher risk for sick leave with a mental disorder than the average employee. The same holds for computing professionals albeit their risk of all-cause sick leave is considerably lower. Other occupational groups with lower than average risk of sick leave in general but higher risk of sick leave with a mental disorder are business professionals, business services agents, public sector administrators, writers and artists and primary school teachers. Other professions with high educational requirements and a higher than average risk of both all-cause and mental disorder sick leave are health professionals (e.g. medical doctors), nursing and midwifery professionals, religious professionals, psychologists and social workers, and pre-primary school teachers.
In Fig. 4, occupations with lower educational requirements are presented. Persons employed as secretaries and keyboard operating clerks resemble the sick leave pattern of computing and business professionals in Fig. 3. Material-recording and transport clerks and especially travel attendants have an excess risk of both all-cause and mental disorder sick leave. The same holds for personal care and related workers (child-care workers, institution-based personal care workers and home-based personal care workers). Another service work group, with an opposite pattern of low or average risk of sick leave, is shop salespersons and demonstrators. Turning to male dominated blue collar manual workers the risk of sick leave is considerably above the average risk of all-cause, but not for mental disorder sick leave. Finally, among occupations without formal education requirements, other service workers have high relative risks for both all-cause and mental disorder sick leave.
Discussion
Some results have a rather straightforward interpretation. Persons with earnings from work of less than 1,178 € annually are in general not qualified for sickness insurance in Sweden, which is consistent with the low risk for compensated sick leave in this group. In addition, subjects with previous sick leave or partial disability pension have a higher risk of sick leave which reflects baseline ill-health accompanied with reduced work ability [18, 48].
Demographic factors
This study confirms previous reports of higher incidence of mental disorder sick leave among women [18, 42] which may be partly attributed to gender differences in illness behaviour with women more inclined to seek professional help for mental illnesses [19]. Besides gendered health behaviour, there are evident differences in exposures with more women being exposed to adverse psychosocial work environments [41], for instance effort-reward imbalance [39]. Among women in Sweden there is also a higher exposure to double burden and work-family interference [23, 41], which is negative for mental health [22], and increases the risk of mental disorder sick leave [20].
The presence of younger children in the family is a factor that gives a higher risk of mental disorder sick leave, probably due to double burden and work-family interference among parents. The mitigating effect of Swedish social insurance, with paid parental leave for young children, cease when both parents resume paid work which in Sweden is when the child is around two years old [50].
The incidence pattern for mental disorder sick leave by age has an inverse U-shape compared to all-cause sick leave with higher incidence for older age groups. The risk of mental disorder sick leave peak in ages 30–39 years when most people in Sweden get a stronger foothold on the labour market and establish a family with children, increasing double burden and work-family interference. It is also possible that underlying mental morbidity will become manifest during this phase in life. A previous extensive review found no clear evidence regarding age and mental disorder sick leave [17], and a more recent study had an age distribution which was not comparable to the current study [18]. Hence, the age-pattern in mental disorder sick leave reported in the current study may be restricted to the contemporary Swedish context where a vast majority of both women and men are in gainful employment also during the child rearing ages.
The results also show a higher incidence of mental disorder sick leave for unmarried persons, widows and widowers, and most notably for those who are divorced compared to those who are married. This is in line with the Whitehall II study of British civil servants, where widowed and divorced had higher rates of sick leave exceeding one week [42]. The interpretation is that civil status indicates a probability of a higher exposure to weak social support from close relatives outside work which has been found to increase the risk for lengthy sick leave spells among men in the Whitehall II study [43]. In addition, being a widow, widower or being divorced also indicate a stressful life event which has previously been found to be associated with increased mental distress and sick leave, especially among men [23, 44].
Immigrants from other Nordic countries, the region consisting of the Middle East, North Africa and Turkey, and South America had a higher incidence of all-cause sick leave while native Swedes and other Nordics had higher risk of mental disorder sick leave. This pattern has no simple explanation but differences in labour market attachment, time spent in Sweden and other sociodemographic and sociocultural factors could play a role [55].
There are also spatial differences in the risk of mental disorder sick leave with a higher risk of mental disorder sick leave in metropolitan and suburban areas and a lower incidence in manufacturing and sparsely populated areas. The pattern of psychiatric disorder rates being higher in urban than rural areas is well established in developed countries, although the mechanisms are not well understood [56]. However, some potentially important factors may be highlighted: problems related to commuting and disturbances in public transportation and traffic jams, less access to recreation areas and weaker social ties, might play a role.
Socioeconomic factors
Turning to socioeconomic factors the incidence of sick leave is higher among those whose income is below the median labour income and lower among those above the median, which is more pronounced for mental disorders. However, among persons earning less than 16,629 € annually the risks are lower, which is probably due to part-time work. Part-time work could be a coping strategy in the presence of illness, reduced work capacity or extensive unpaid work duties. Among the income-groups just below the median a possible mechanism for increased mental disorder sick leave is higher exposure to effort-reward imbalance, with well-known adverse health effects [30–32, 57].
The incidence of sick leave is also higher for both all-cause and mental disorder sick leave among those with nine or ten years of primary education and lower among those with post-secondary education, which has also been reported from a recent Norwegian study [18]. Both education and income may be considered important markers of socioeconomic status with lower status being detrimental to mental health and health in general [42, 45]. Immigrants from outside the OECD-countries are overrepresented among those with recorded education less than 9 years and their lower risk may reflect a lack of labour income and sickness insurance.
In Sweden, unemployed persons have sickness benefit insurance if their ability to seek work is reduced due to illness or injury. According to this study, the unemployed have a lower risk of all-cause sick leave than employed. This may be due to a combination of a lack of sickness insurance due to low income and a lack of work demands. However, this lower risk among unemployed is not present for mental disorder sick leave which is probably a reflection of the health adversities accompanying unemployment as well as high risk of unemployment among persons with mental illness [46].
Occupational factors
All those employed in the public sector, including state, municipalities, county councils and public sector enterprises, have a higher risk of both all-cause and mental disorder sick leave than those employed in the private sector. Those employed in other organisations also have a higher risk of mental disorder sick leave. There are no clear-cut explanations to these differences. Nevertheless, some possible explanations should be put forward. One is that the higher incidence of mental illness among public sector employees may reflect higher exposure to effort-reward imbalance [37, 39]. In tax funded organisations there could be high efforts, low job esteem, low job security and low job promotion due to increased financial strain. Most public employees are probably aware about the restriction put on wages. However, there could be a strong sense of working for the common good and having a meaningful job [41], which should be important for professional status and self-esteem. The provision of good quality public service could be an essential part of work when working within healthcare, education and other welfare services [58]. Understaffing can be detrimental for health [59] and potentially more for those working within the provision of welfare services where there is an obligation to provide help and assistance.
Lastly, the general pattern between occupations is that mental disorder sick leave is more common in occupations requiring post-secondary education where all-cause sick leave is more uncommon. Conversely, all-cause sick leave is more common in lower white collar and blue collar occupations where mental disorder sick leave is more uncommon. This is most probably a reflection of more adverse physical work environments among the latter socioeconomic groups [41], for instance ergonomic strain which is associated with musculoskeletal disorders [40, 60].
High mental disorder sick leave risks accompanied with above average all-cause sick leave risks are found among professions with high educational requirements, working with people in crisis situations or with particular needs within healthcare, social services or education. Examples of such occupational groups are medical doctors, nurses and midwifes, religious professionals, social workers and pre-primary school teachers. These are occupations that score above average regarding psychosocial factors at work, for instance job strain [41].
Some lower white collar and blue collar occupations need to be mentioned specifically due to high risk of both all-cause and mental disorder sick leave. These are personal care workers, travel attendants, and other service workers. Personal care workers score above average regarding both psychosocial and ergonomic factors at work [41], which in conjunction increase the risk of musculoskeletal pain [40]. Personal care workers should also be given special attention since it is a large occupational group, predominantly women. Hence, the fraction of sick leave attributable to this occupation is substantial due to the size of the group. Travel attendants are mainly working in public transportation daily facing a number of commuters, which could be highly stressful during traffic disturbances. Among other service workers without any formal educational requirements there is, besides potential work environment and socioeconomic adversities, possibly an adverse health selection of workers. This could be a factor within all occupations but should be stronger between occupations with different educational requirements than between occupations with similar requirements [61].
A final remark is in place regarding occupations and sectors providing welfare services within healthcare, social services and education, where employees are at particular risk for all-cause and mental disorder sick leave. This is of course problematic and costly both for people working in these occupations and their employers. In addition, it is most probably also detrimental for the quality of the welfare services provided for patients, clients and pupils. Indirectly this will increase stress, workload and double burden for relatives, and further reducing welfare in society.
Strengths and limitations
This study has several advantages including the prospective design and accounting for baseline health as reflected in sickness insurance and a heterogeneous working population of an entire country. In addition, register-data are in general very reliable and not hampered with low response rates, though registration errors cannot be entirely ruled out. As the entire Swedish population in ages 16 to 64 years and all sick leave in the Swedish sickness insurance scheme were included in the study, the validity for the Swedish setting is evident as well as for comparable societies.
A further strength of the study is that a number of relevant predictors were assessed in the regression analysis. Still, the observational nature of the study inherently opens up for the possibility that other potential predictors influence the outcomes. For instance, exposure to adverse conditions in work environments and their underlying mechanisms could not be directly analysed. But the use of indirect measures such as sector of employment and occupation has the advantage of eliminating the risk of reversed causality, i.e. impaired health and low work ability influencing self-reported work environment exposures [62]. What’s more, to our knowledge this is the first study presenting a comprehensive analysis of medically certified sick leave across all occupations controlling for a number of other relevant predictors.
The study also has some obvious limitations. One is that the major diagnosis first reported in the sick leave spell have been used in the analyses. This could be a source of bias since it may be difficult to make a diagnosis early in the course of a disease. Comorbidity is also common for mental disorders, which has not been accounted for in the current study.
Hence, due to uncertainties about the diagnosis reported on the sickness certificate, the reporting of all-cause sick leave alongside mental disorder sick leave give an unbiased point of reference in the current study. Most of our attention has also been directed towards groups with high incidence for both mental disorder and all-cause sick leave, where it is apparent that their high rates of sick leave are driven by mental disorders, e.g. for persons working with the provision of welfare services with well-known exposures to adverse psychosocial work environments. For groups with high rates of mental disorder sick leave and low overall rates of sick leave it is apparent that their disease and work ability pattern is different due to socioeconomic and work related factors, e.g. in most white collar occupations. The third group is where the incidence of sick leave is low for mental disorder sick leave, but high for sick leave in general. This indicates that physical injuries and diseases dominate and are the drivers of high sick leave rates, e.g. typical in most blue collar occupations. This may be due to socioeconomic factors, but probably most important is their exposure to adverse physical work environments, which possibly overrides and aggravates the effects of exposures to adverse organisational and social work factors.
Another potential shortcoming is reversed causation since baseline health and mental morbidity could not be fully accounted for. This is probably of some importance for the associations found for the socioeconomic predictors such as education, employment and income, and perhaps in the selection to occupations. Hence, unaccounted differences in baseline health may have influenced some of the associations reported in the current study [46, 61].
Conclusions
The majority of mental disorders consist of anxiety and depression, both of which are normally treatable. Consequently, the potential for retaining employees at the workplace as well as expecting them to return to work is in general high. Still, improvements in psychosocial work environments are essential to prevent sick leave. In particular, certain welfare occupations with well-known high exposure to organisational and social risk factors are at high risk of mental disorder sick leave. If the provision of high quality welfare services is at risk, this will also have extensive welfare consequences for the society as a whole. In addition, increased work-life balance for families with younger children could mitigate the effects of high total workload during that particular phase in life.
Conflict of interest
None to report.
Footnotes
Appendix
Fully adjusted relative risks of mental disorder and all-cause sick leave >14 days during 2012 among residents aged 16–64 in Sweden
| Mental disorder sick leave | All-cause sick leave | ||||
| n | RR | (95% CI) | RR | (95% CI) | |
| Man (ref.) | 3 186 783 | 1.00 | 1.00 | ||
| Woman | 3 005 614 | 1.28 | (1.27 1.29) | 1.24 | (1.23 1.24) |
|
|
|||||
| 16–19 | 488 135 | 0.36 | (0.33 0.39) | 0.61 | (0.60 0.63) |
| 20–24 | 653 843 | 0.77 | (0.75 0.79) | 0.83 | (0.82 0.84) |
| 25–29 | 616 494 | 0.94 | (0.92 0.96) | 0.95 | (0.94 0.96) |
| 30–34 | 616 940 | 1.04 | (1.03 1.06) | 1.02 | (1.01 1.02) |
| 35–39 | 656 066 | 1.03 | (1.02 1.05) | 1.00 | (0.99 1.01) |
| 40–44 (ref.) | 677 193 | 1.00 | 1.00 | ||
| 45–49 | 687 306 | 0.96 | (0.95 0.98) | 1.03 | (1.02 1.04) |
| 50–54 | 601 679 | 0.91 | (0.90 0.92) | 1.07 | (1.06 1.07) |
| 55–59 | 587 190 | 0.84 | (0.82 0.85) | 1.10 | (1.09 1.11) |
| 60 and above | 607 551 | 0.61 | (0.59 0.62) | 1.01 | (1.01 1.02) |
|
|
|||||
| Married (ref.) | 2 255 586 | 1.00 | 1.00 | ||
| Unmarried | 3 044 245 | 1.05 | (1.05 1.06) | 0.98 | (0.97 0.98) |
| Divorced | 608 257 | 1.20 | (1.19 1.21) | 1.08 | (1.08 1.09) |
| Widow/widower | 53 087 | 1.09 | (1.06 1.13) | 0.97 | (0.96 0.99) |
| Civil status unknown | 231 222 | ||||
|
|
|||||
| No children 0–2 (ref.) | 5 586 298 | 1.00 | 1.00 | ||
| Children 0–2 | 606 099 | 0.83 | (0.82 0.84) | 0.94 | (0.93 0.94) |
| No children 3–8 (ref.) | 5 237 974 | 1.00 | 1.00 | ||
| Children 3–8 | 954 423 | 1.05 | (1.04 1.06) | 1.01 | (1.00 1.01) |
| No children 9–12 (ref.) | 5 545 554 | 1.00 | 1.00 | ||
| Children 9–12 | 646 843 | 1.04 | (1.03 1.05) | 1.00 | (1.00 1.01) |
| No children 13–15 (ref.) | 5 674 804 | 1.00 | 1.00 | ||
| Children 13–15 | 517 593 | 1.02 | (1.01 1.03) | 1.00 | (0.99 1.00) |
|
|
|||||
| Sweden (ref.) | 5 122 257 | 1.00 | 1.00 | ||
| Other Nordic countries | 148 439 | 0.99 | (0.97 1.01) | 1.03 | (1.02 1.04) |
| Other European union countries (EU 27) | 163 825 | 0.94 | (0.91 0.96) | 1.00 | (0.99 1.01) |
| Other European countries | 180 484 | 0.99 | (0.97 1.01) | 1.01 | (1.00 1.02) |
| Africa south of Sahara | 82 582 | 0.61 | (0.57 0.65) | 0.89 | (0.87 0.91) |
| Asia except Middle East | 146 077 | 0.75 | (0.72 0.78) | 0.87 | (0.86 0.88) |
| Middle East, North Africa, Turkey | 266 114 | 0.91 | (0.90 0.94) | 1.08 | (1.07 1.09) |
| North America | 24 029 | 0.92 | (0.86 0.98) | 0.98 | (0.95 1.02) |
| South America | 54 705 | 0.94 | (0.91 0.98) | 1.04 | (1.02 1.06) |
| Oceania | 3 769 | 0.87 | (0.70 1.05) | 0.85 | (0.76 0.94) |
| Country of birth unknown | 116 | ||||
|
|
|||||
| Metropolitan municipalities | 1 125 175 | 1.05 | (1.04 1.06) | 1.01 | (1.00 1.01) |
| Suburban municipalities | 949 206 | 1.05 | (1.04 1.06) | 1.03 | (1.02 1.04) |
| Large cities (ref.) | 1 789 293 | 1.00 | 1.00 | ||
| Suburban municipalities to large cities | 196 098 | 1.02 | (1.00 1.04) | 1.03 | (1.02 1.04) |
| Commuter municipalities | 421 105 | 1.01 | (1.00 1.03) | 1.02 | (1.01 1.03) |
| Tourism and travel industry municipalities | 170 973 | 1.00 | (0.98 1.02) | 1.01 | (0.99 1.02) |
| Manufacturing municipalities | 477 325 | 0.96 | (0.95 0.97) | 1.00 | (0.99 1.00) |
| Sparsely populated municipalities | 93 729 | 0.92 | (0.89 0.95) | 1.01 | (1.00 1.02) |
| Municipalities in densely populated regions | 510 324 | 1.00 | (0.99 1.01) | 1.00 | (0.99 1.01) |
| Municipalities in sparsely populated regions | 191 079 | 0.96 | (0.94 0.98) | 1.00 | (0.99 1.01) |
| Municipality of residence unknown | 268 090 | ||||
|
|
|||||
| 0 | 894 915 | 0.22 | (0.20 0.23) | 0.19 | (0.18 0.20) |
| 0.1 – 1 177 | 193 661 | 0.39 | (0.36 0.43) | 0.35 | (0.33 0.36) |
| 1 178 – 7 861 | 507 285 | 0.68 | (0.66 0.71) | 0.62 | (0.60 0.63) |
| 7 862 – 16 628 | 508 198 | 0.93 | (0.91 0.95) | 0.84 | (0.83 0.85) |
| 16 629 – 23 127 | 509 591 | 1.06 | (1.04 1.07) | 0.99 | (0.98 0.99) |
| 23 128 – 27 530 | 510 820 | 1.08 | (1.06 1.09) | 1.03 | (1.02 1.03) |
| 27 531 – 31 164 | 511 400 | 1.04 | (1.03 1.05) | 1.02 | (1.01 1.03) |
| 31 165 – 34 524 (ref.) | 511 596 | 1.00 | 1.00 | ||
| 34 525 – 38 374 | 511 635 | 0.97 | (0.95 0.98) | 0.97 | (0.97 0.98) |
| 38 375 – 43 674 | 511 489 | 0.91 | (0.89 0.92) | 0.93 | (0.92 0.94) |
| 43 675 – 53 944 | 511 532 | 0.86 | (0.84 0.87) | 0.87 | (0.86 0.88) |
| 53 945 and above | 510 275 | 0.74 | (0.72 0.76) | 0.75 | (0.74 0.76) |
|
|
|||||
| Primary education <9 years | 188 618 | 0.88 | (0.85 0.90) | 0.98 | (0.97 1.00) |
| Primary education 9 or 10 years | 812 418 | 1.10 | (1.08 1.11) | 1.06 | (1.05 1.06) |
| Secondary education (ref.) | 2 667 371 | 1.00 | 1.00 | ||
| Post-secondary education <2 years | 399 965 | 0.97 | (0.95 0.98) | 0.91 | (0.91 0.92) |
| Post-secondary education≥2 years | 1 583 331 | 0.98 | (0.97 0.99) | 0.91 | (0.90 0.91) |
| Doctoral education | 55 568 | 0.88 | (0.83 0.93) | 0.80 | (0.77 0.82) |
| Educational attainment unknown | 485 126 | ||||
|
|
|||||
| State (incl. state owned public utilities) | 242 986 | 1.10 | (1.08 1.12) | 1.05 | (1.04 1.06) |
| Municipal | 881 880 | 1.09 | (1.07 1.10) | 1.06 | (1.05 1.06) |
| County council | 247 520 | 1.05 | (1.03 1.06) | 1.05 | (1.04 1.06) |
| Private enterprises (ref.) | 3 099 667 | 1.00 | 1.00 | ||
| State, Municipal or county council owned enterprises | 225 343 | 1.07 | (1.05 1.09) | 1.06 | (1.05 1.07) |
| Other organisations | 213 396 | 1.09 | (1.07 1.11) | 1.01 | (1.00 1.02) |
| Employer unknown | 1 281 605 | ||||
|
|
|||||
| 11 Armed forces | 15 948 | 0.72 | (0.62 0.83) | 0.73 | (0.68 0.78) |
| 111 Legislators | 3 342 | 0.96 | (0.77 1.16) | 0.72 | (0.63 0.82) |
| 112 Senior officials of special-interest organisations | 1 152 | 0.99 | (0.71 1.27) | 0.85 | (0.71 1.00) |
| 121 Directors and chief executives | 23 637 | 0.99 | (0.91 1.07) | 0.78 | (0.75 0.82) |
| 122 Production and operations department managers | 84 706 | 1.14 | (1.11 1.17) | 0.91 | (0.89 0.93) |
| 123 Other department managers | 73 652 | 1.04 | (1.00 1.08) | 0.81 | (0.79 0.83) |
| 131 General managers | 83 401 | 1.01 | (0.98 1.05) | 0.88 | (0.86 0.90) |
| 211 Physicists, chemists and related professionals | 7 352 | 0.97 | (0.85 1.09) | 0.79 | (0.73 0.86) |
| 212 Mathematicians, statisticians and related professionals | 1 802 | 0.96 | (0.74 1.19) | 0.85 | (0.74 0.97) |
| 213 Computing professionals | 104 061 | 1.04 | (1.01 1.08) | 0.82 | (0.80 0.84) |
| 214 Architects, engineers and related professionals | 82 591 | 1.05 | (1.01 1.09) | 0.88 | (0.86 0.90) |
| 221 Life science professionals | 4 693 | 1.12 | (1.00 1.23) | 0.94 | (0.88 1.01) |
| 222 Health professionals (except nursing) | 49 409 | 1.21 | (1.17 1.25) | 1.04 | (1.02 1.06) |
| 223 Nursing and midwifery professionals | 32 757 | 1.13 | (1.09 1.17) | 1.07 | (1.05 1.09) |
| 231 College, university and higher education teaching professionals | 36 993 | 1.10 | (1.05 1.15) | 0.84 | (0.81 0.87) |
| 232 Secondary education teaching professionals | 61 043 | 1.16 | (1.13 1.19) | 0.94 | (0.92 0.96) |
| 233 Primary and pre-primary education teaching professionals | 86 157 | 1.16 | (1.14 1.19) | 0.93 | (0.92 0.95) |
| 234 Special education teaching professionals | 7 919 | 1.20 | (1.13 1.27) | 1.01 | (0.97 1.05) |
| 235 Other teaching professionals | 23 937 | 1.18 | (1.13 1.22) | 0.96 | (0.93 0.98) |
| 241 Business professionals | 114 887 | 1.04 | (1.01 1.07) | 0.84 | (0.83 0.86) |
| 242 Legal professionals | 18 933 | 0.94 | (0.87 1.01) | 0.85 | (0.81 0.88) |
| 243 Archivists, librarians and related information professionals | 9 558 | 1.02 | (0.95 1.10) | 0.88 | (0.84 0.92) |
| 244 Social science and linguistic professionals | 4 971 | 1.01 | (0.89 1.12) | 0.90 | (0.84 0.97) |
| 245 Writers and creative or performing artists | 46 677 | 1.11 | (1.07 1.15) | 0.91 | (0.89 0.93) |
| 246 Religious professionals | 3 698 | 1.42 | (1.34 1.50) | 1.13 | (1.06 1.19) |
| 247 Administrators in public sector organisations | 50 700 | 1.10 | (1.07 1.14) | 0.93 | (0.91 0.95) |
| 248 Administrators in special-interest organisations | 7 923 | 1.12 | (1.03 1.20) | 0.94 | (0.89 0.99) |
| 249 Psychologists and social workers | 36 753 | 1.30 | (1.27 1.33) | 1.05 | (1.03 1.07) |
| 311 Physical and engineering science technicians | 132 010 | 1.01 | (0.97 1.04) | 0.91 | (0.89 0.92) |
| 312 Computer associate professionals | 48 981 | 1.13 | (1.09 1.16) | 0.92 | (0.90 0.94) |
| 313 Optical and electronic equipment operators | 11 998 | 0.99 | (0.91 1.08) | 0.92 | (0.88 0.96) |
| 314 Ship and aircraft controllers and technicians | 6 781 | 0.63 | (0.46 0.81) | 0.98 | (0.92 1.04) |
| 315 Safety and quality inspectors | 8 274 | 1.06 | (0.97 1.16) | 1.03 | (0.98 1.07) |
| 321 Life science technicians and related associate professionals | 3 431 | 0.99 | (0.83 1.15) | 0.94 | (0.87 1.02) |
| 322 Modern health associate professionals (except nursing) | 40 005 | 1.03 | (0.99 1.07) | 0.98 | (0.96 1.00) |
| 323 Nursing and midwifery associate professionals | 76 155 | 1.19 | (1.16 1.22) | 1.09 | (1.08 1.11) |
| 324 Biomedical analysts | 10 377 | 1.00 | (0.93 1.08) | 0.96 | (0.93 1.00) |
| 331 Pre-primary education teaching associate professionals | 91 712 | 1.13 | (1.10 1.15) | 1.09 | (1.08 1.11) |
| 332 Other teaching associate professionals | 8 019 | 1.09 | (1.00 1.17) | 0.99 | (0.94 1.03) |
| 341 Finance and sales associate professionals | 205 416 | 1.05 | (1.02 1.07) | 0.88 | (0.87 0.89) |
| 342 Business services agents and trade brokers | 24 658 | 1.23 | (1.19 1.27) | 1.00 | (0.97 1.02) |
| 343 Administrative associate professionals | 81 040 | 1.04 | (1.01 1.07) | 0.86 | (0.85 0.88) |
| 344 Customs, tax and social insurance government professionals | 24 104 | 1.12 | (1.07 1.16) | 0.93 | (0.90 0.95) |
| 345 Police inspectors and detectives | 17 835 | 0.94 | (0.87 1.01) | 1.05 | (1.02 1.08) |
| 346 Social work associate professionals | 38 643 | 1.27 | (1.24 1.30) | 1.08 | (1.06 1.10) |
| 347 Artistic, entertainment and sports associate professionals | 21 671 | 0.92 | (0.86 0.98) | 0.96 | (0.93 0.99) |
| 348 Religious associate professionals | 1 413 | 1.28 | (1.11 1.43) | 0.90 | (0.78 1.01) |
| 411 Secretaries and keyboard-operating clerks | 35 835 | 1.07 | (1.04 1.11) | 0.91 | (0.89 0.93) |
| 412 Numerical clerks | 59 735 | 0.98 | (0.95 1.02) | 0.82 | (0.80 0.83) |
| 413 Material-recording and transport clerks | 78 691 | 1.02 | (0.99 1.05) | 1.10 | (1.08 1.11) |
| 414 Library, mail and related clerks | 4 742 | 1.07 | (0.97 1.16) | 0.97 | (0.92 1.02) |
| 415 Mail carriers and others | 25 231 | 0.88 | (0.83 0.94) | 1.05 | (1.03 1.08) |
| 419 Other office clerks | 104 619 | 1.03 | (1.01 1.06) | 0.90 | (0.88 0.91) |
| 421 Cashiers, tellers and related clerks | 29 071 | 1.04 | (0.99 1.08) | 1.01 | (0.99 1.04) |
| 422 Client information clerks | 59 451 | 1.07 | (1.04 1.11) | 0.96 | (0.94 0.98) |
| 511 Travel attendants and related workers | 7 825 | 1.15 | (1.08 1.23) | 1.17 | (1.13 1.20) |
| 512 Housekeeping and restaurant services workers | 71 483 | 0.90 | (0.87 0.94) | 1.00 | (0.99 1.02) |
| 513 Personal care and related workers | 600 907 | 1.11 | (1.09 1.13) | 1.08 | (1.07 1.09) |
| 514 Other personal services workers | 19 100 | 0.83 | (0.77 0.89) | 0.97 | (0.94 1.00) |
| 515 Protective services workers | 38 372 | 1.07 | (1.03 1.11) | 1.08 | (1.06 1.10) |
| 521 Fashion and other models | 155 | 1.13 | (0.58 1.60) | 0.83 | (0.48 1.23) |
| 522 Shop salespersons and demonstrators | 256 250 | 1.01 | (0.99 1.03) | 0.98 | (0.97 0.99) |
| 611 Market gardeners and crop growers | 27 805 | 0.95 | (0.89 1.00) | 1.03 | (1.00 1.05) |
| 612 Market-oriented animal producers and related workers | 20 086 | 0.70 | (0.62 0.78) | 0.97 | (0.94 1.00) |
| 613 Market-oriented crop and animal producers | 11 513 | 0.85 | (0.75 0.96) | 0.97 | (0.92 1.01) |
| 614 Forestry and related workers | 5 076 | 0.81 | (0.66 0.98) | 1.02 | (0.96 1.07) |
| 615 Fishery workers, hunters and trappers | 1 502 | 0.65 | (0.38 1.00) | 0.95 | (0.84 1.07) |
| 711 Miners, shotfirers, stone cutters and carvers | 4 080 | 0.77 | (0.60 0.97) | 1.13 | (1.07 1.19) |
| 712 Building frame and related trades workers | 124 311 | 0.92 | (0.89 0.95) | 1.20 | (1.19 1.21) |
| 713 Building finishers and related trades workers | 108 580 | 0.96 | (0.92 0.99) | 1.13 | (1.12 1.15) |
| 714 Painters, building structure cleaners and related trades workers | 27 284 | 0.96 | (0.90 1.02) | 1.16 | (1.14 1.18) |
| 721 Metal moulders, welders, sheet and structural metal workers | 35 819 | 0.92 | (0.86 0.97) | 1.18 | (1.16 1.20) |
| 722 Blacksmiths, tool-makers and related trades workers | 10 718 | 0.90 | (0.80 1.00) | 1.12 | (1.09 1.16) |
| 723 Machinery mechanics and fitters | 59 413 | 0.92 | (0.88 0.97) | 1.11 | (1.09 1.13) |
| 724 Electrical and electronic equipment mechanics and fitters | 33 183 | 0.86 | (0.80 0.93) | 1.03 | (1.01 1.06) |
| 731 Precision workers in metal and related materials | 5 414 | 0.98 | (0.85 1.10) | 1.00 | (0.95 1.06) |
| 732 Potters, glass-makers and related trades workers | 1 349 | 1.03 | (0.82 1.25) | 0.95 | (0.84 1.06) |
| 733 Handicraft workers in wood, textile, leather etc. | 280 | 1.20 | (0.80 1.54) | 0.96 | (0.73 1.19) |
| 734 Printing and related trades workers | 5 360 | 0.90 | (0.77 1.02) | 0.88 | (0.82 0.94) |
| 741 Food processing and related trades workers | 12 227 | 0.85 | (0.76 0.94) | 1.08 | (1.04 1.11) |
| 742 Wood treaters, cabinet-makers and related trades workers | 2 686 | 1.02 | (0.85 1.19) | 1.06 | (0.99 1.13) |
| 743 Textile, garment and related trades workers | 3 482 | 1.02 | (0.89 1.15) | 0.97 | (0.91 1.03) |
| 744 Pelt, leather and shoemaking trades workers | 575 | 0.73 | (0.35 1.21) | 0.80 | (0.63 0.99) |
| 811 Mining- and mineral-processing-plant operators | 1 861 | 0.97 | (0.74 1.20) | 1.12 | (1.04 1.21) |
| 812 Metal-processing-plant operators | 16 768 | 0.93 | (0.85 1.01) | 1.16 | (1.13 1.18) |
| 813 Glass, ceramics and related plant operators | 1 917 | 0.91 | (0.70 1.13) | 1.13 | (1.05 1.21) |
| 814 Wood-processing- and papermaking-plant operators | 20 103 | 0.86 | (0.78 0.94) | 1.11 | (1.09 1.14) |
| 815 Chemical-processing-plant operators | 6 817 | 0.86 | (0.73 0.99) | 1.02 | (0.97 1.07) |
| 816 Power-production and related plant operators | 10 205 | 0.93 | (0.84 1.03) | 0.98 | (0.94 1.02) |
| 817 Automated-assembly-line and industrial-robot operators | 1 447 | 1.00 | (0.75 1.25) | 1.09 | (0.98 1.19) |
| 821 Metal- and mineral-products machine operators | 49 049 | 0.94 | (0.89 0.98) | 1.10 | (1.08 1.12) |
| 822 Chemical-products machine operators | 14 470 | 0.99 | (0.92 1.06) | 1.12 | (1.09 1.15) |
| 823 Rubber- and plastic-products machine operators | 14 739 | 0.84 | (0.76 0.92) | 1.11 | (1.08 1.14) |
| 824 Wood-products machine operators | 13 241 | 0.97 | (0.89 1.05) | 1.14 | (1.11 1.17) |
| 825 Printing-, binding- and paper-products machine operators | 13 387 | 0.86 | (0.78 0.95) | 1.05 | (1.01 1.08) |
| 826 Textile-, fur- and leather-products machine operators | 7 479 | 0.94 | (0.84 1.03) | 1.06 | (1.02 1.10) |
| 827 Food and related products machine operators | 22 967 | 0.95 | (0.90 1.01) | 1.13 | (1.11 1.15) |
| 828 Assemblers | 58 135 | 0.97 | (0.93 1.01) | 1.11 | (1.09 1.12) |
| 829 Other machine operators and assemblers | 36 227 | 1.00 | (0.95 1.05) | 1.13 | (1.11 1.15) |
| 831 Locomotive-engine drivers and related workers | 5 874 | 1.04 | (0.92 1.16) | 1.11 | (1.06 1.16) |
| 832 Motor-vehicle drivers | 117 695 | 1.01 | (0.98 1.04) | 1.15 | (1.14 1.17) |
| 833 Agricultural and other mobile-plant operators | 40 143 | 0.80 | (0.74 0.86) | 1.05 | (1.03 1.07) |
| 834 Ships deck crews and related workers | 2 194 | 0.85 | (0.61 1.10) | 0.90 | (0.80 1.00) |
| 911 Street vendors and related workers | 479 | 0.91 | (0.48 1.38) | 1.02 | (0.82 1.22) |
| 912 Domestic and related helpers, cleaners and launderers | 97 596 | 0.96 | (0.94 0.99) | 1.08 | (1.06 1.09) |
| 913 Kitchen- and restaurant labourers | 83 839 | 0.96 | (0.93 1.00) | 1.03 | (1.01 1.04) |
| 914 Messengers, porters, caretakers and related workers | 17 801 | 1.01 | (0.94 1.07) | 1.04 | (1.01 1.07) |
| 915 Waste disposal, recycling and related labourers | 11 148 | 1.01 | (0.93 1.10) | 1.16 | (1.13 1.20) |
| 919 Other service workers | 37 506 | 1.21 | (1.18 1.24) | 1.22 | (1.20 1.24) |
| 921 Agricultural, fishery and related labourers | 4 441 | 0.90 | (0.76 1.04) | 1.06 | (1.00 1.12) |
| 931 Mining and construction labourers | 5 552 | 0.92 | (0.78 1.05) | 1.18 | (1.13 1.23) |
| 932 Manufacturing labourers | 38 108 | 0.98 | (0.93 1.02) | 1.12 | (1.10 1.14) |
| 933 Transport labourers and freight handlers | 17 444 | 1.01 | (0.94 1.08) | 1.16 | (1.13 1.19) |
| Occupation unknown | 1 600 380 | ||||
|
|
|||||
| In gainful employment (ref.) | 4 298 777 | 1.00 | 1.00 | ||
| Not in gainful employment | 1 514 401 | 1.00 | (0.97 1.02) | 0.82 | (0.81 0.83) |
| Employment status unknown | 379 219 | ||||
|
|
|||||
| No sick leave >14 days during 2010/2011 (ref.) | 5 560 116 | 1.00 | 1.00 | ||
| Sick leave >14 days during 2010/2011 | 632 281 | 1.85 | (1.87 1.83) | 1.87 | (1.89 1.86) |
|
|
|||||
| Full activity compensation (individuals <30 years of age) | 25 828 | 0.93 | (0.80 1.05) | 0.81 | (0.73 0.90) |
| Full sickness compensation (individuals >30 years of age) | 246 632 | 0.24 | (0.22 0.26) | 0.13 | (0.12 0.14) |
| Partial activity compensation (individuals <30 years of age) | 1 608 | 1.52 | (1.43 1.60) | 1.42 | (1.35 1.48) |
| Partial sickness compensation (individuals >30 years of age) | 107 571 | 1.13 | (1.11 1.15) | 1.18 | (1.17 1.19) |
| No disability pension benefit (ref.) | 5 810 758 | 1.00 | 1.00 | ||