
Abstract
BACKGROUND:
Previous research has shown that today’s crane cabins fail to meet the needs of a large proportion of operators. Performance and financial losses and effects on safety should not be overlooked as well.
OBJECTIVE:
The first aim of this survey is to model the crane cabin interior space using up-to-date crane operator anthropometric data and to compare the multivariate and univariate method anthropometric models. The second aim of the paper is to define the crane cabin interior space dimensions that enable anthropometric convenience.
METHODS:
To facilitate the cabin design, the anthropometric dimensions of 64 crane operators in the first sample and 19 more in the second sample were collected in Serbia. The multivariate anthropometric models, spanning 95% of the population on the basis of a set of 8 anthropometric dimensions, have been developed. The percentile method was also used on the same set of data.
RESULTS:
The dimensions of the interior space, necessary for the accommodation of the crane operator, are 1174×1080×1865 mm. The percentiles results for the 5th and 95th model are within the obtained dimensions.
CONCLUSIONS:
The results of this study may prove useful to crane cabin designers in eliminating anthropometric inconsistencies and improving the health of operators, but can also aid in improving the safety, performance and financial results of the companies where crane cabins operate.
Introduction
Cranes are a central component of many operations. They are used in the construction industry to move materials, in the manufacturing industry to transport and assemble heavy equipment, in the maritime industry for shipbuilding and maintenance, in the railroad industry to load/unload cargo etc. [1–5]. Occupational fatalities and injuries caused by the operation of cranes pose a serious public problem [6]. When properly operated, cranes contribute substantially to the efficient progress of work, but they also have the potential to cause enormous loss of life and property [7]. Some estimates suggest that cranes are involved in up to one-third of all construction and maintenance fatalities [8]. A tipped, dropped, or mishandled load can lead to lethal injuries, non-lethal permanent injuries and recoverable injuries [6]. The risk of loss is not limited only to those directly involved in construction operations, but may also affect pedestrians, who have been killed in such accidents as well [8]. Obviously, this kind of accidents also has immense cost implications [9]. Worldwide accident records over the last 5 years show that under existing regulation regarding crane safety, the rates of injuries/illness can be considered constant, while poor human performance as an influential factor has a growing trend [1, 10]. Mobile cranes are the type of cranes with the highest accident rates [1]. The part of the world where most of the accidents take place is North America [1].
Crane operators remain in cabins for the whole day [11, 12]. As shown by the safety factors analysis in the example of the construction site in China tight schedules usually hinder the implementation of site safety [11]. Construction sites have special safety regulation made by a large number of bodies [13]. The space within the crane cabin is adequate for only 18.5 % of operators, while 28.9 % of them feel extremely uncomfortable [14]. A possible reason may be found in the fact that today’s available standards and manufacturers rely on anthropometric data of the general population [15]. Zunjic et al. in study [15] tested the hypothesis whether the dimensions of the cabin and the layout of equipment would rely on the data derived from the general population of Serbian citizens (using the biggest known sample of the published data) instead from the population of crane operators and confirmed that on the level of significance of 0.05, more than 50% anthropometric dimensions showed disagreement. They [15] provided recommendations for designing the individual components within the crane cabin. The recommendations included qualitative advice to use transparent material in the design of the floor, ceiling and the lateral parts of the cabin and to remove all accompanying elements of construction from the visual field of the operator. Still, Zunjic et al. [15] did not define the interior space dimensions that enable anthropometric convenience.
Multivariate anthropometric models have not been used to design crane cabin interior space so far. It is expected that a contribution in this area could benefit the design of future crane cabins which, in turn, would help promote the safety and health of the crane operators. Hence, the first aim of this survey is to model the crane cabin interior space using up-to-date crane operator anthropometric data and to compare the multivariate and univariate method anthropometric models. The second aim of the paper is to define the crane cabin interior space dimensions that enable anthropometric convenience. Thus, the paper focuses on the following objectives: (i) collecting data on anthropometric dimensions of crane operators; (ii) multivariate and univariate (percentiles) statistics application on anthropometric dimensions of crane operators; (iii) crane operators’ multivariate models accommodation in the interior crane cabin space on the basis of kinematics mechanism; (iv) the 5th and 95th percentile crane operators’ models accommodation in the interior crane cabin space; (v) survey verification and (vi) suggesting recommendations for improving performance and safety through the new crane cabin interior design. Our survey is based on the anthropometric data of 64 crane operators, while additional 19 operators were used for survey validation. After the introduction provided in Section 1,the need for the optimization of the crane cabin interior according to operators’ needs is pointed out through analysis of previous research points in Section 2. Section 3 describes the methodology of an anthropometric optimization of the crane cabin for operators’ accommodation, while Section 4 provides its results. Section 5 offers the discussion about the modeling of the crane cabin interior according to our results, while Section 6 deals with modeling verification. Sections 7 and 8 provide the discussion and conclusions.
Previous research
A large number of standards, issued on the national or international level, by governmental, military, manufacturing or other organizations, could be implemented in the crane cabin design. The National Aeronautics and Space Administration (NASA) [13] prepared guidelines covering all existing standards for overhead cranes in order to aid human factors engineers in evaluating the existing cranes during accident investigations or safety reviews. For instance, the ISO 8566-5 standard [16] defines the necessary crane cabin dimensions as 1300×900×1600 mm.
Crane operators spend long hours operating cranes and often work under pressure. They spend at least 6 and often even 8 hours a day working in shifts in a static sedentary position in the cabins that are often located high above the floor [11–13, 17–20]. The crane operators’ job in current crane cabins demands frequent body twisting to reach controls and see the load, deep sideways banding and exposure to vibrations due to load stopping [12, 20–23]. Physical demands of the crane operator job include forceful and/or repetitive movement and awkward and static posture of different body segments under vibrations exposure. In the mental sense, they have to keep an eye on their work and be aware of the position of the hook and the object in relation to other equipment, the building and other personnel [15, 23].
Kushwaha and Kane [17] noticed in their sample of 27 operators that all of them continuously suffered from some kind of a musculoskeletal disorder. Neck, upper back and lower back pain, thigh/hip and knee pain were the most frequently reported disorders [17]. Burdorf and Zonderman [24] carried out a survey among 33 crane operators in a steel factory and recommended to persons with a history of back complaints not to seek employment as crane operators because further vibrations caused by crane movement would exacerbate their health problems. Zunjic et al. [15] also noticed that crane operators complained about the fatigue, discomfort and pain, mostly located in the back, neck and shoulders. Bovenzi, Pinto and Stacchini [21] found there were 40–60% of operators with a 12-month prevalence of low back pain. Kittusamy and Buchholz [23] further argued that awkward posture during the operation of heavy construction equipment was a consequence of the improper cabin design and work procedures. They [23] emphasized that poor visibility of the task, limited room in the cabin, excessive force required to operate levers/pedals, and improper seat designs were some of the characteristics of a poorly designed cabin.
Summarized statistics for 64 crane operators
Summarized statistics for 64 crane operators
Compared to other operators, tall crane operators (over 170 cm) are probably the most vulnerable workers because they have a more forward-flexed posture which induces very high flexion-relaxation response and ligaments tension [18, 19]. Carragee et al. [25] synthesized the literature and presented the fact that among workers in manual occupations, the annual prevalence of neck pain varied from 16.5% in spinning industry production line workers in Lithuania to 74% in Swedish crane operators, who are among the tallest in Europe. Ray and Tewari in [18] studied 23 body dimensions of 21 crane operators to minimize the anthropometric mismatch within the enclosed workspace. They found many misfits of even the 50th percentile Indian crane operator population on site with the existing work system [18]. Using the example of the crane cabin manufactured by Mac Gregor that operates in Sweden, Nordin and Olson [26] discussed crane operators’ comfort. They [26] concluded that the given cabin was not suitable for the majority of users due to inadequate posture, incorrect placement of regulators and indicators, and the bad visual field of an operator. The uncomfortable working position, which often limits unconstrained performing of working movements, together with the mental effort needed to ensure as good as possible vision field, forces the operator to work more slowly and hence decreases productivity and safety [15].
The previous research has pointed out that crane operators’ strenuous work postures and different occupational diseases in current crane cabin spaces stem from the unsuitability between the anthropometric characteristics of operators and the dimensions and designer’s solutions of contemporary cabins. The need to increase the well-being of crane operators and avoid discomfort could be fulfilled through anthropometric optimization. Further anthropometric characteristics analysis is a way to improve productivity and safety and also prevent crane related fatalities and injuries.
The share of crane operators working in crane cabins in the general Serbian population is quite low (according to the Serbian Chamber of Commerce, the population is smaller than 450). Our first sample comprised 64 participants, which is almost 15% of population, and this is considered to fulfill the requirements for a representative sample of such population. The second sample with 19 more participants, which represent more than 4% of population, was used to verify the model. Previous research [17, 23] in the same field was based on even smaller sample sizes collected in a single company (Kushwaha and Kane [17] –27 crane operators, Ray and Tavari [18] –21 crane operators, Bovenzi et al. [21] –46 crane operators and Burdorf et al. [23] –33 crane operators). In previous research [17, 23], the method of participants’ recruitment was not clarified or even mentioned. It seems that authors in[17, 23] have included either all operators in the factory or a certain percentage of operators who agreed about the participation in the experiment. Regarding the procedure, in previous studies [17, 23], anthropometric measurements were taken in a standard setup of a straight sitting posture on an ergonomic adjustable chair. In the present survey, all available operators were recruited and measured using standard anthropometric instruments andprocedure.
Participants
The Electric Power Industry of Serbia has 6 production companies, located throughout Serbia. Five production companies agreed to participate in the survey at the end of 2012, while the sixth company asked for the survey to be postponed for the first quarter of 2013 due to revitalization deadline. In the first plant, anthropometric measurements were taken for 15 operators, in the second plant 12 operators were measured, 14 operators were measured in the third plant, while in the fourth and the fifth plant, anthropometric measurements were taken for 10 and 13 operators, respectively. The measurements obtained in the last, sixth production company, included 19 crane operators and served as a verification sample since those data were obtained in the second iteration. Iterative sampling is recommended as a procedure in [31] since it has been shown that when building the sample size through iterations, a smaller sample size is needed. All available operators at plants were willing to participate and were included in the study.
Data collection
Since anthropometric variables that are significantly related to fit or accommodation in the particular environment should be evaluated [21], foot length, stature, sitting height, knee height, buttock-knee length, bideltoid breadth, hip breadth and arm length were measured herein.
In this study, standard anthropometric instruments and procedure were used in data collection. The static anthropometry method, which implies measuring in the erect position during standing and sitting (so that the torso is at a 90° angle with the upper leg, and the upper leg at a 90° angle with the lower leg) using the instruments such as an anthropometer, a beam caliper, sliding calipers, a stool and a steel tape, was applied, similarly to the procedure used in previous research [15, 26–30]. All dimensions were determined with working clothes and footwear, similarly to previous studies [15, 30], since the aim was to find an interior space for accommodation in which operators work in working clothes and footwear, e.g. with personal protective equipment. Measurements were taken in the Electric Power Industry of Serbia.
Summarized statistics for 64 Serbian crane operators’ dimensions, together with participants’ demographics and the values of mean, standard deviation, maximum and minimum and confidence interval are given in Table 1.
The data given in Table 1 are comparable to the data available from previous studies. Our mean and standard deviation values for stature are 1750.30 and 53.25 mm, while Burdorf et al. [23] obtained 1765 and 74 mm on the data from Netherlands, and Bovenzi et al. [20] got the values 1780 and 68 mm on the data from Italy. The authors in study [18] did not give mean values, but they did state that for the control position of the longitudinal travel, main hoist, and auxiliary hoist, the 50th percentile Indian user had a 45 mm of misfit.
Later on, the data for verification study were collected in the same manner.
Data analysis
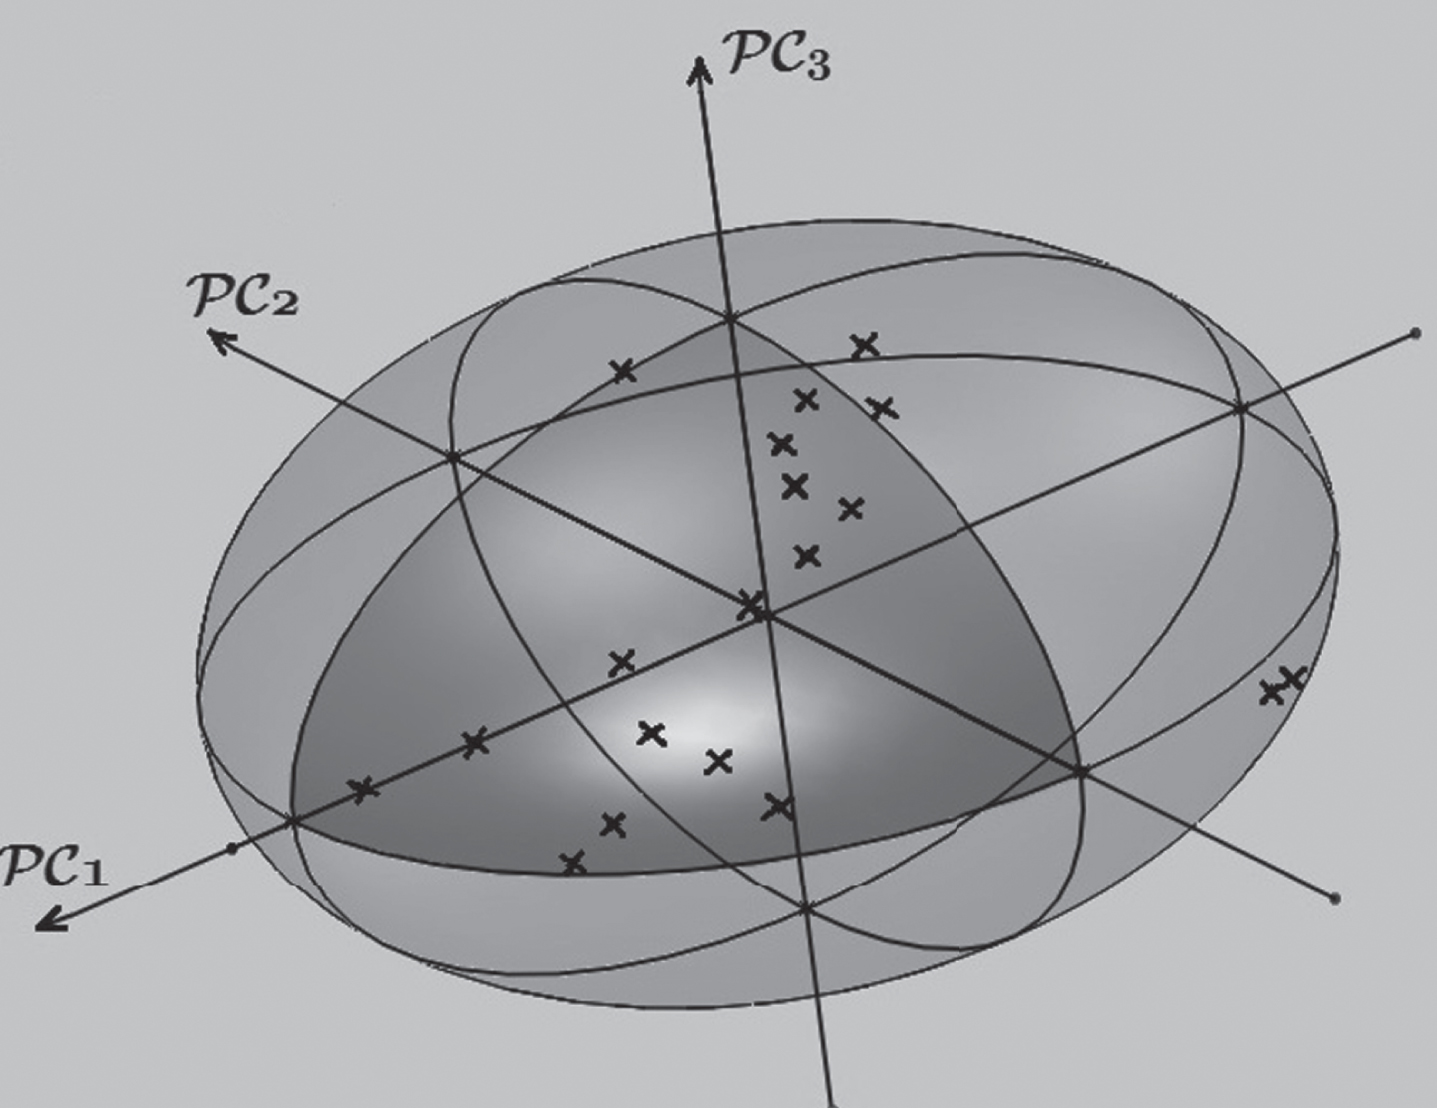
Both multivariate and univariate approaches for modeling were applied on the obtained data. The procedure of multivariate modeling included principal components analysis (PCA) to obtain representative body models. PCA is essentially a rotation of the coordinate axes, chosen in such a way that each successful axis captures as much variance as possible and can be thought of as fitting an n-dimensional ellipsoid to the data [32]. After determining the principal components on the collected anthropometric data, the component scores are calculated and later transformed to anthropometric measurements dimensions of the representative body models on the boundaries or on the surface of the ellipsoid by a reverse process of calculating matrices of eigenvalues, eigenvectors and factor loadings. If each variable loads on only one factor simultaneously and there is a clear difference in intensity between the relevant factors whose eigenvalues are clearly larger than one, while the noise represented by factors with eigenvalues is clearly smaller than one, then further rotation is likely to provide a solution that is more reliable than the original solution. Otherwise, there is no need to implement PCA because the rotation would make the solution less replicable and potentially harder to interpret since the mathematical properties of PCA have been lost [32, 33]. Few statistical software packages, such as SPSS-IBM, Statistica-StatSoft etc., offer the possibility for PCA procedure execution, while other calculations can be done in software such as Excel-Microsoft. Univariate, 5th and 95th percentile models will also be obtained and compared to multivariate results. In the end, both multivariate and univariate crane operators’ models were used to determine the dimensions of the interior space necessary to accommodate all of them in an ergonomically designed crane cabin.
Results of the anthropometric optimization
The decision to use the first three principal components (PCs) to define body models is made on the basis of scree test. PC1, PC2 and PC3, which are orthogonal to one another, were found to account for 80.25% of the total variance. Choosing a cut-off total variance somewhere between 70% and 90% and retaining m PCs provides a rule which in practice preserves in the first m PCs most of the information [34]. The desired level of sample inclusion was set to 95% (95% confidence ellipsoid) and was accomplished by fitting an ellipsoid in a three-dimensional space, where cases were plotted by factor scores. The next step was to determine the critical models on the surface of the ellipsoid, where the 5th and 95th percentile were also included, to check if they were in the boundary space. There were 14 points from PCA on the ellipsoid surface representing the diverse body size and shape combinations (Fig. 1). Six of them are intercepts on the ellipsoid surface by the three axes (points U, V, W, X, Y, and Z), while eight octant midpoints are located at the surface center of each of the eight sections (octants) divided by the three axes of this ellipsoid (points A, B, C, D, E, F, G, and H) [28]. These 14 points, together with the centroid of the ellipsoid (point O), formed the basis for the selection of the anthropometric models.

The centroid, intercept points and octant midpoints of 95% enclosure ellipsoid [30].
Factor scores were obtained by multiplying the matrix of standardized variable values for all participants and the matrix of eigenvectors divided by a square root of eigenvalues. They were later transformed into the corresponding anthropometric dimensions by a reverse process of calculating matrices of eigenvalues, eigenvectors and factor loadings. Table 2 addresses the PCA application output. It consists of three PCs that were preserved according to the criterion that their eigenvalues should be greater than 1 [29, 35], which implies a minimum variance of 11.88. Such a result is in accordance with the variance criterion given in [34], as can be seen in Table 2. PC1, which accounts for 37.82% of the total variation, looking at the factor loadings and sample size needed for significance [34], mostly explains stature, knee height, buttock-knee height and arm’s length (all refer to the overall height, so PC1 can be interpreted as ‘height’). PC2, accounting for 30.53% of the variation, counted mostly from bideltoid breadth and hip breadth, is interpreted as ‘width’. PC3, accounting for 11.90% of the variation, mostly explains the variable foot length, and is hence interpreted as ‘depth’.
First three PCs and their correlations with variables
All 15 body models (14 critical and one average) are representative body sizes and types for the crane operators’ population derived from PCA in such a way that:
Model O, at the center of the ellipsoid, represents an average person in all body dimensions.
Model U represents an individual with large overall height, and average width and foot length.
Model V represents an individual with small overall height, and average width and foot length, e.g. shoe number.
Model X represents an individual with large width, and average overall height and foot length.
Model Z represents an individual with small width, and average overall height and foot length.
Model Y represents an individual with large foot length, and average overall height and width (shoe number).
Model W represents an individual with small foot length, and average overall height and width (shoe number).
Model A represents an individual with relatively large width, but small overall height and small foot length.
Model G, in contrast to Model A, represents an individual with relatively small width, but large overall height and small foot length, as can be seen in Fig. 2.
Model B represents an individual with relatively small overall height, but large width and large foot length.
Model H, in contrast to Model B, represents an individual with relatively large overall height, but small width and small foot length.
Model C represents an individual with small overall height and small width, but relatively large foot length.
Model E, in contrast to Model B, represents an individual with large overall height and large width, but relatively small foot length.
Model D represents an overall small individual.
Model F, in contrast to Model D, represents an overall large individual.

Contrasting models A (left) and G (right) in standing and sitting position.
Table 3 presents standardized values of 8 anthropometric dimensions for representative body models according to models O to F notations and the 5th and 95th percentile models.
Standardized values of 8 anthropometric dimensions for representative body models
Table 4 shows anthropometric dimensions for the representative models, both for PCA and the percentiles, which have been obtained as the sum of the mean value of the appropriate dimension and the value of product of its standardized value and the standard deviation.
Anthropometric dimensions of representative body models
Figure 2 presents contrasting models A (left) and G (right) in standing and sitting position.
The percentiles results fall inside the obtained ellipsoid, as can be seen in Table 4.
The modeling of the cabin interior for representative operators derived through PCA, according to the kinematics mechanism behavior [30], starts by adjusting the elements of the human-cabin system to comfort posture, along with fixing the origin of the coordinate system. Vogt et al. [36] suggest fixing the joint visual angle or operator’s hip for the heel, hip or hand, while Klarin et al. [30] use the heel for vehicle design. The crane cabin also requires the construction measured by the coordinate system with the fixed point in the operator’s heel, which is in front of the foot pedal. Fixing the zero coordinate point is enabled by the kinematics of heel movement, which for large legs and feet, due to seat movement backwards and downwards, moves the heel relatively towards the front along with an increase in the foot’s angle with the floor. In the opposite case, this is achieved by moving the heel, e.g. in small anthropometric measurements, towards the back and reducing the angle between the foot and the floor, along with an increase in the angle between the lower and the upper leg, as well as between the upper leg and the seat height, all aimed at the maximum overlapping of visualangles.
A vertical projection of the space required for operator’s accommodation in the cabin shows how representative models U, V, H, B, A and G determine the cabin interior dimensions towards the x and z axes.
Figure 3 shows that, for the operators corresponding to models U and V, which overlap in two extreme positions, the angle of 60° is enabled when looking downwards, where the angle between the torso and upper leg is optimal 109° for both models. A mobile camera and a display system can provide wider angles. As suggested in [9], it is possible to install a video camera on the crane, and develop the equipment for the transmission of the video signal to display, placed in the cabin. In that way, the operator can control picture on the monitor. Enabling a continuous view of the working task, the system prevents accidents and increases work safety, making night work possible whenever needed. Thus, workers who signalize to the operator from the ground are no longer necessary. Furthermore, the optimal angle of the seat surface is enabled in all positions, so that the femur is horizontal, and the hip and the seat surface form an angle of 7°. The arm span for using manual commands for those two models amounts to 606 and 764 mm. It is in accordance with the head position and movement, the horizontal and vertical seat adjustment and other dimensions and angles, from the shoulder joint (semi-centre of rotation) to the hand with folded fingers. Also, the arm span of model H, with a maximum of 783 mm, as well as of model B, with a minimum of 596 mm, should be considered. The arm flexibility of the user with the smallest arm enables, within the reduced field, normal work and commands usage. The chair should be adjustable to 200 mm horizontally, and 60–110 mm vertically. The adjustability of 110 mm enables minimizing of the space that is required for the operator U, so the operator U is moved to the position U’. The overall height of the cabin should be 1865 mm, so that a comfortable entrance of model G in the cabin is enabled. The seat length of 400 mm and the back rest height of 550 mm are determined by anthropometric measures of models U and V. Model G with the largest shoe length (shoe number) determines the length on the negative side on x-axis.
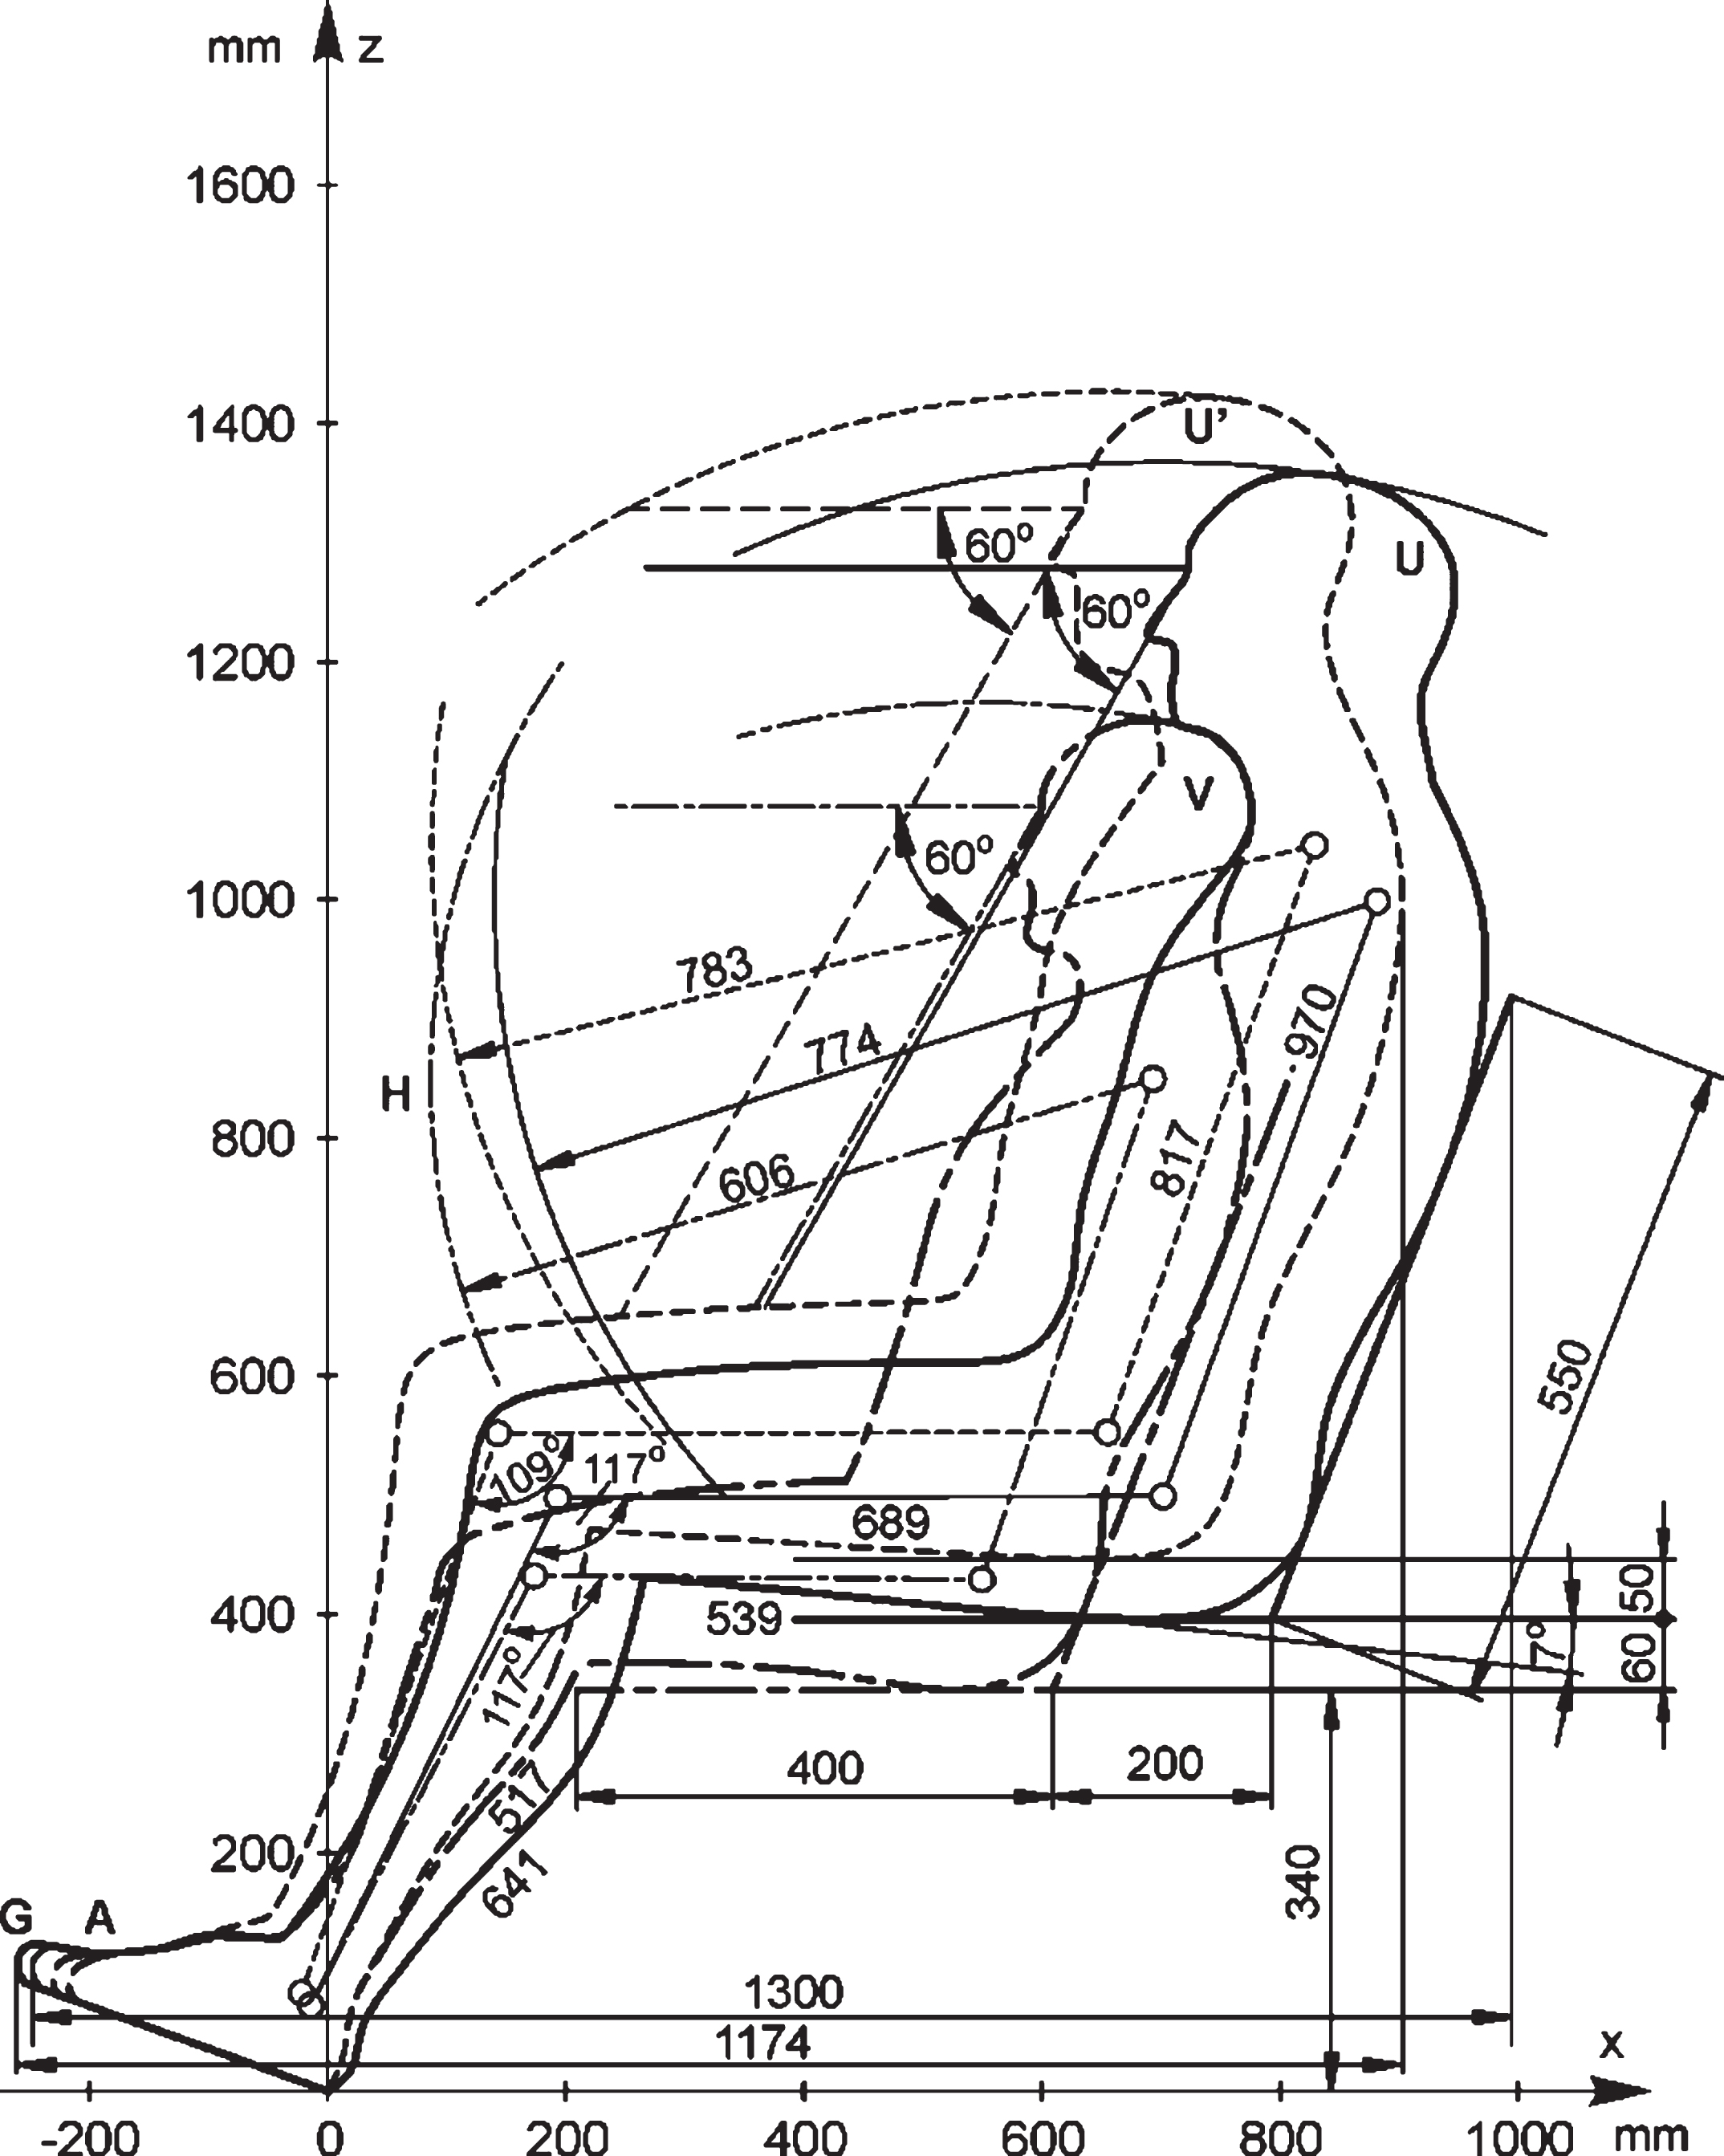
Space required for accommodation of the crane operator in the cabin, in x-z plane.
Figure 3 shows how the dimension of 1174 mm was obtained. In a similar manner, the y-axis dimension of 1080 mm (250 + 35 + 510 + 250 + 35) was determined by the shoulder and hip breadth and arm and leg haptic fields, as shown in Fig. 4. Actually, in the x-y plane, the y-axis dimensions were determined by the shoulder and hip breadth and arm and leg haptic fields. The shoulder breadth for model Z is 375 mm, and for model X it is 560 mm. The hip breadth for model D is 298 mm, and for model X it is 509 mm, which determines seat width close to 510 mm. Horizontal adjustability of the seat by 50 mm provides comfort accommodation of the operator in the x-z plane.
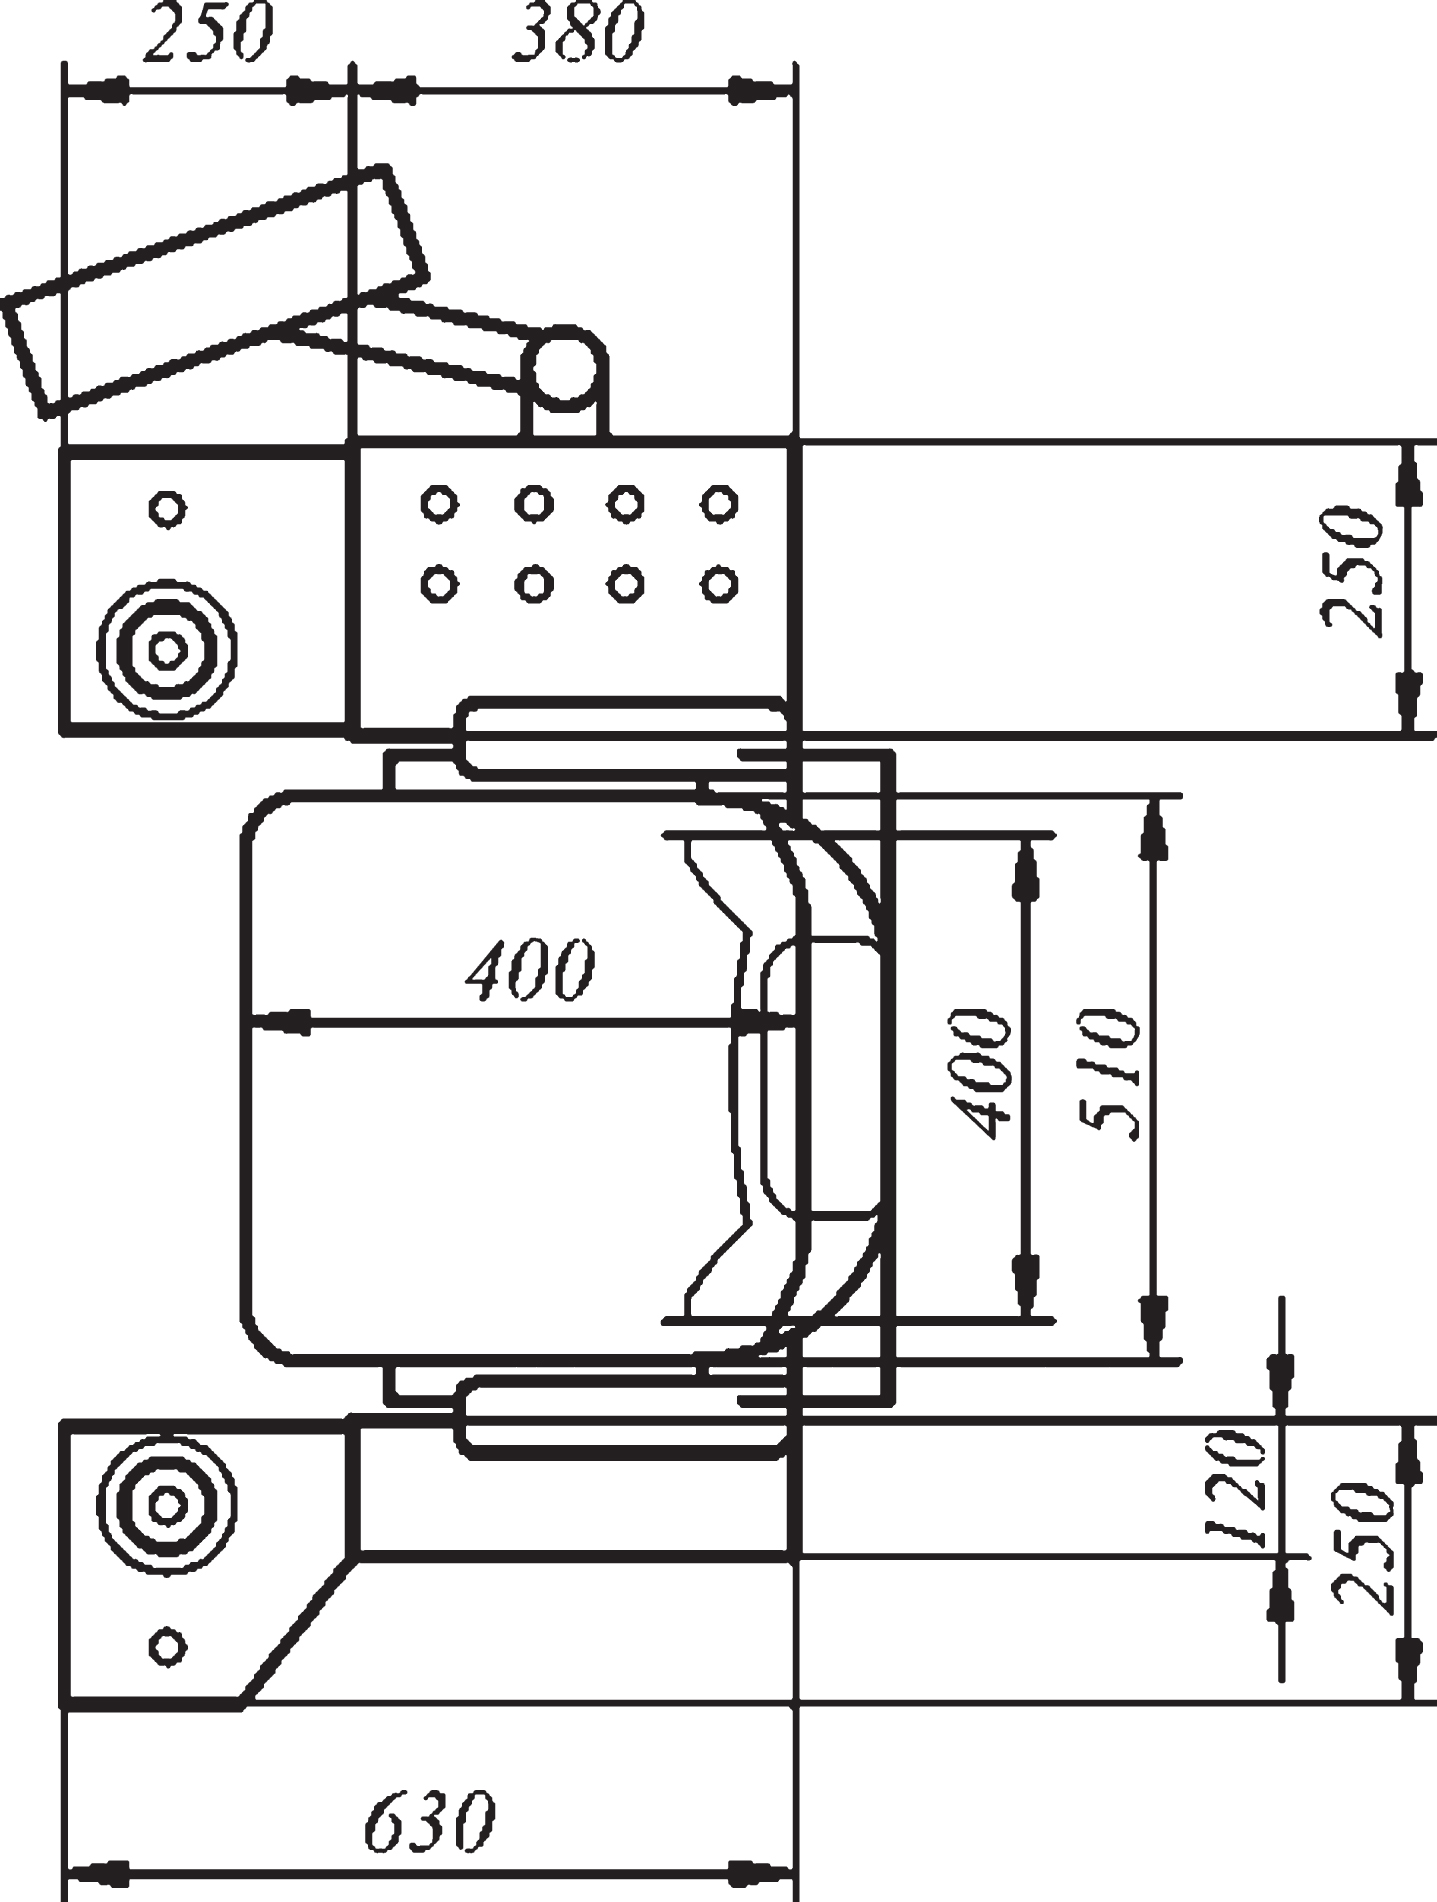
Space required for accommodation of the crane operator in the cabin, in x-y plane.
The problem of the armrest height is reduced to a compromise between the requirements of standard ergonomics and the need to use both hands simultaneously. The ergonomics of arm movements during work requires the placement of the work object in the optimal haptic field. It implies the field at elbow height with the upper arms hanging loosely next to the body, while the angle between the lower arm and the upper leg is 90° while forming arches in the horizontal plane of the left and right arm. The intersection of the fields of both arches directed towards the body is the optimal haptic field. Since in this case the position of the commands would obstruct the visual angle, they need to be separated into consoles, which also serve as armrests. The armrest and the seat should be adjustable, both in terms of height (z-axis) and length (x-axis). The position of the backrest with the commands is restricted by the maximum arm span, bearing in mind that the field within the optimal visible visual angle of 60 should be discarded. The next restriction refers to the depth of the chest, and hence the command should have a vertical axis on the straight line x = 500 mm. The backrest position in relation to the seat surface is the result of two movements: movement due to differences in seating height and due to the difference in the height of the bent elbow. In the same manner, utilizing critical models, the basic dimensions of operators’ seat are derived in the x-y plane (Fig. 4).
The interior space height is determined by model G. Final minimal dimensions of the crane cabin, based on working requirements and appropriate comfort and safety, according to PCA and new anthropometric measures, are 1174×1080×1865 mm.
The second sample of 19 crane cabin operators was collected in 2013 in the sixth EPS production company in Serbia, using the same method as for the first one. The results of their anthropometric measurements are given in Table 5, together with participants’ demographics. The sample data given in Table 5 demonstrate that participants were similar to those in the initial group.
Anthropometric dimensions for 19 crane cabin operators in the second sample
Anthropometric dimensions for 19 crane cabin operators in the second sample
The purpose of the second sample consisting of 19 crane cabin operators was to verify the presented method. Factor coordinates of these 19 participants were calculated using the same procedure as for the first sample. The obtained coordinates were placed into the first sample’s enclosure space and it was found that all the participants of the verification sample were within the ellipsoid, as can be seen in Fig. 5.
The ellipsoid verification with the second sample.
In recent years, the traditional percentile approach has been criticized because of its univariatenature [27]. This assumption has been confirmed in the present paper. The percentiles usually accommodate the persons from the 5th to 95th percentile, which means that the product is designed and manufactured to fit 90% of the population of interest. A practical problem with this approach lies in the fact that percentiles are not additive, and a model composed entirely of the 95th percentile segments has a stature that substantially exceeds the 95th percentile stature of the population, whereas a model composed entirely of the 5th percentile segments substantially underestimates the actual 5th percentile stature. When it is necessary to include several dimensions for proper fitting in the design, there is a problem of including less than the intended 90% of the population. For example, if a 90% of the population have a 5th–95th percentile stature, only 82% of those 90% would have a 5th–95th percentile chest circumference, and only 78% of them a 5th–95th percentile shoulder breadth. Similarly, the percentage decreases more and more after adding further dimensions, in such a way that after the 8th dimension has been added, it amounts to 57% [37]. Generally, the rate of accommodation degradation in the percentile models varies as a function of the number of critical dimensions and the correlations among them. According to [38], percentile models always include less than the intended population proportion when the design problem has more than one body dimension critical to fit, and this has also been proved by the present survey. Furthermore, the percentile method includes only overall large and small individuals, disregarding the individuals with different body configurations, such as the multivariate models A-H and U-Z herein, which are of large significance for the determination of critical dimensions in design. Hence, this paper confirms the claim given in [39] that uniform percentile models, since they are neither realistic nor proportioned properly for good-fitting designs, could be replaced by using multivariate approaches. There are some other methods mentioned in the literature as alternatives to the percentile approach, but most of them also have certain shortcomings. For instance, the “Worst cases” models are usually not those composed of uniformly largest or smallest dimensions, but rather the models with one very large critical dimension and another critical dimension very small [38].
James et al. [40] and Adeyemi et al. [41] have shown the possibility of application of factor analysis in anthropometric data analysis and reduced anthropometric data using a multivariate technique – confirmatory factor analysis. Principalcomponents analysis (PCA), according to our results, also properly addresses the need for multivariate accommodation requirement, by defining design limits for realistic modes that include all extremes. This approach was first proposed by Bittner and later on validated through another study by the same author [35], but has been rarely applied in practice. Although the first paper appeared a few decades ago, a small number of researchers has used this approach [29, 42], so the percentile method still remains the most commonly used one today.
Nowadays, the sample size guidelines for using factor analysis or PCA are rare, although the sample size and the ratio of subjects to items are very important [43]. The ratio of subjects/participants to items/anthropometric measurements in our survey is 8, and it is usually proposed to be greater than 5 [44]. The verification also proved our sample size adequacy through shown stability of the obtainedresults [32].
The authors in [38, 45] believe that PCA is more efficient in interpreting anthropometric data and provides precise results for design. The results obtained herein give support to this belief. PCA identifies the direction of the maximum variance in the data and re-expresses the variation in the given data with a set of orthonormal axes – principal components. The first few PCs, herein three of them, describe maximum variances and they are used for the interpretation of the data. This interpretation simplifies the multivariate problem by reducing its dimensionality and thus proves research findings given in [31]. These PCs approximate an ellipse or ellipsoid in distribution, so that a set of body models different from the 5th and 95th percentile models is identified on the boundaries of the ellipse or on the surface of the ellipsoid. Our results have shown that the percentile models are inside the obtained ellipsoid, hence on the basis of multivariate models we arrived at interior space dimensions for crane operator accommodation in the cabin.
Conclusions
This study has shown that when it comes to the crane cabin interior design very important oversights can be made. If the cabin design is based on the data which are derived from the general population, the conducted anthropometric analysis showed that an error would appear. This error further reflects on operators’ comfort, and, depending on the size of the error, there are other negative effects, such as operator health problems, working inefficiency, economic loss and safety issues. For these reasons, the present study was based on a crane operators’sample.
The survey was based on the initial sample of 64 operators and the verification sample containing 19 crane cabin operators. The aim was to involve not only the operators with all the extreme measurements but also those with extreme combinations of different measurements. This was achieved through representative models obtained through PCA and the 5th and 95th percentile. The final cabin dimensions necessary to accommodate all models amount to 1174×1080×1865 mm and significantly differ from the contemporary cabins with respect to the standard ISO 8566 that have the dimensions of 1300×900×1600 mm.
In accordance with the results of this study, the most commonly used directives derived from the available standards should be partially corrected in order to solve today’s crane operators’ problems, so that: The seat vertical adjustability should be changed from 152.4 mm to a total of 110 mm (the percentile method requires 100 mm), with an increment no more than 30 mm. The seat width should be 510 mm (the percentile method requires 490 mm). The backrest height was between 381 mm and 508 mm, while the new results demand 550 mm. The backrest width that was between 300 mm and 360 mm should be increased to 400 mm (the percentile method requires 380 mm). The seat should have five legs or be fixed to the cabin floor, with the possibility to adjust the seat position towards the console. The swivel chair with the supporting legs should have a seat base of 457 mm (the directive remains, although a slight widening is possible). Instead of the range of 190 mm to 297 mm for armrest adjustability, armrests should be adjustable from 550 mm to 800 mm by height, which means 250 mm in range. The length of armrests should be 295 mm, instead of the recommended 203 mm.
Comparing the recommendations given in [13] and the PCA and percentile method, it is obvious that using PCA in the design provides more comfortable accommodation. In this case, it also shows that the percentile method results are within the multivariate boundaries, in such a way that now: The torso incline angle provides most comfort while sitting, along with the visual angle of 60° for all operators, and with an additional possibility to cover all cargo positions with the camera-display system. The seat vertical adjustability of the total of 110 mm provides more convenient sitting. The seat width that amounts to 510 mm provides comfort sitting even for those with the largest hip width. The backrest width that amounts to 400 mm provides more comfortable accommodation than the previous dimension that was between 300 mm and 360 mm according to othermethods.
Hence, the results of this research have confirmed and resolved the problems pointed out in [25]. It is to expect that the procedure proposed herein not only eliminates anthropometrical inconsistency, but also decreases the risks of musculoskeletal disorders, which further increases job satisfaction, lowers the risk of injuries and fatalities, and, therefore, results in an overall increase of productivity and safety as well.
It is evident from this survey that although Serbian population is among the tallest, the crane operators’ stratum includes lower growth and overweight persons. The suggestion for further research thus refers to the modeling by using the data of crane operators from other countries. Modeling on the basis of anthropometric measurement obtained in only one country may also be considered the limitation of oursurvey.
Conflict of interest
None to report.
Footnotes
Acknowledgments
This work is supported by MESTD - grants from the Eureka E!6761, SPRINCE- SAF€RA ERA NET and TR 35017 projects.