
Abstract
BACKGROUND:
Pallet truck pulling is one of the common manual materials handling tasks which could result in musculoskeletal injuries. The endurance time for sustained truck pulling tasks has been rarely discussed in the literature.
OBJECTIVE:
The objectives of this study were to measure the muscular fatigue after performing a pulling task and to establish models to predict the maximum endurance time for truck pulling tasks.
METHODS:
A simulated truck pulling experiment was conducted. Ten human participants were recruited. The participants pulled a handle simulating that of a pallet truck under two loading conditions until they could not pull any longer.
RESULTS:
The results indicated that hand/wrist and elbow had higher subjective ratings of muscular fatigue than the other body segments. A subjective rating of 5 or more was found on at least two of the body segments for all trials except one. An exponential model and a power model were established to predict the maximum endurance time of the pulling tasks.
CONCLUSION:
Hand/wrist and elbow were the body segments most likely to suffer muscular fatigue for the simulated truck pulling tasks. The endurance time models established may be adopted in job designs for one-handed truck pulling tasks.
Introduction
Manual materials handling (MMH) tasks are very common on work sites and have been blamed as the major contributors for musculoskeletal disorders (MSDs) [1, 2]. Scientific investigations [3] have been conducted on MMH tasks discussing the job demands and workers’ capacities issues aiming to reduce the risk of MSDs. Muscular fatigue has been one of the major issues related to MSDs. It results in pain, discomfort, and weakness in body segments for workers. Weakness of muscle, or alternatively reduction of muscular strength [4], reduces the capability of workers to perform manual tasks.
Estimation of muscular fatigue is of vital importance for job design/redesign. It may be conducted in different ways [5]. Measuring the reduction of maximum voluntary contraction (MVC) or muscular force output after performing a forceful exertion for a period of time is one way to do so. Zhang et al. [6] assessed single arm pushing strength during and after completing a 3-min pushing task for male and female participants in a factory. The pushing strengths for their male and female participants dropped 42% and 48%, respectively, at the end of the trials. Li and Chiu [7] assessed the isometric arm strength before and after performing loads carrying of 4 kg and 8 kg for 4 minutes and found 23% and 35% arm strength reductions, respectively. Li et al. [8] had their male participants carry a mass of 6 kg and 12 kg for 4 minutes using either dominant or non-dominant hand. They found that thereduction of carrying strength was significantly affected by both the weight carried (p < 0.05) and hand used (p < 0.0001). The authors established regression models to predict carrying strength after performing a one-handed carrying task for a time period t.
In addition to the study of muscular strength, quantification of the maximum endurance time (MET) is also one of the primary issues associated with muscle fatigue. The MET represents the maximum time during which a static muscular load can be maintained [9]. It has been adopted in job assessment especially to determine an acceptable duration to maintain a static muscular contraction [10]. The MET has also been adopted to determine work-rest allowance for static muscular work in industry [11, 12].
The MET for static manual tasks may be described using mathematical equations. Predictive MET models using mathematical functions have been established [13–22]. Most of those models adopt the percentage of maximum voluntary contraction (% MVC), or alternatively the relative force (f MVC = % MVC/100), as the independent variable [23]. They were normally established under static loading condition for specific body segment and posture and, therefore, may not be used in tasks involving other body segments and postures. There are also so-called “general model” in the literature [11, 14] which do not pertain to specific body part. Those models were, however, inadequate in predicting the MET for specific tasks [9, 20].
In addition to the body segment or posture specific MET models, MET model based on the theory of contraction decrement of muscle upon fatigue has also been reported. The model of Ma et al. [20, 22] was an example. This model was developed based on the concept that fatigue is both a growth function with the reciprocal of muscle force capacity and a growth function of time. The MET in their model is equal to negative natural logarithm of f
MVC
divided by the product of k and f
MVC
, where k is the fatigue rate or, alternatively fatigability (see Equation (1)). This MET model does not pertain to a specific body segment or posture. It may be applied to assess the MET of static work for various body segments [24].
A pallet truck is one of the most commonly used materials handling aids in industry [25]. In a warehouse superstore, St-Vincent et al. [26] found that pallet trucks were used, on average, 54 times during a five-hour work shift across different sections. The total cumulative weight handled per day for a truck ranged from approximately 300 to 4,400 kg. The results of another survey [27] on materials handling aids indicated that 40% of the workers interviewed used a pallet truck more than 10 times per day. The loads on the truck on one trip could be as high as 1,500 kg. Pulling a truck involves both static and dynamic components of muscular contractions. The static contractions occur on the upper body for truck steering and control. The dynamic contractions are associated with walking which occur mainly on the lower body. Static contraction should be the main focus in studying muscular fatigue as it leads to blood flow restriction, accelerating the onset of discomfort, fatigue, and even injury [28]. Truck pulling may be performed using either one hand or two hands. By examining the electromyography (EMG) data on the upper extremities, Bennett et al. [28] has shown that one-handed truck pulling was more taxing than two-handed pulling. The association between pulling and the risk of MSDs has been reported [29–31].
Even though many MET models have been reported, the MET estimates from different models could be quite different [9, 22] due to differences in the approaches of model developing, posture, and force applying conditions among different studies. Muscular fatigue and MET model developing for pallet truck handling were rare. The existing MET models in the literature may be inadequate in making predictions for truck pulling tasks. The objectives of this study were to report subjective ratings of muscular fatigue after performing pulling tasks and to establish MET models for truck pulling tasks using one hand. Comparisons between our models and those in the literature are discussed.
The literature [13–16] has indicated that the MET is inversely proportionate with the f
MVC
in a curvilinear pattern. Both exponential and power functions have been adopted to fit such patterns [13– 19, 23]. For the simulated pulling task in the current study, we assumed that the MET may be fitted using these two mathematic functions in Equations (2) and (3) :
where a and b are task-specific constants.
By taking natural logarithmic transformation, we have the following equations:
Equations (4) and (5) may be fitted using simple linear regression analysis if both the MET and f MVC are known.
An experiment was conducted to measure the MET for simulated truck pulling tasks. The experiment was performed in the laboratory with the temperature and humidity of 23.8 (±1.6)°C and 84.1 (±3.6)%, respectively.
Human participants
Five female and five male adults without history of musculoskeletal symptoms within one year of the study enrolled in this study. They read and signed informed consent before joining the experiment. The age, body mass, stature, body mass index (BMI), arm length, leg length, shoulder height, and knee height for the female participants were 20.6 (±0.8) yrs, 51.7 (±4.8) kg, 163.4 (±2.8) cm, 19.4 (±1.8) kg/m2, 69.1 (±1.5) cm, 93.5 (±2.6) cm, 134.5 (±2.5) cm, and 46.5 (±1.6) cm, respectively. The age, body mass, stature, BMI, arm length, leg length, shoulder height, and knee height for the male participants were 21.6 (±1.5) yrs, 59.4 (±8.3) kg, 164.7 (±2.6) cm, 21.3 (±2.46) kg/m2, 67.0 (±2.4) cm, 93.2 (±1.8) cm, 135.7 (±1.9) cm, and 46.4 (±1.3) cm, respectively. All the participants were right handlers. They were asked to refrain from sports or strenuous physical activities a day before joining the experiment.
Apparatus
Simulated stick-handle of a pallet truck
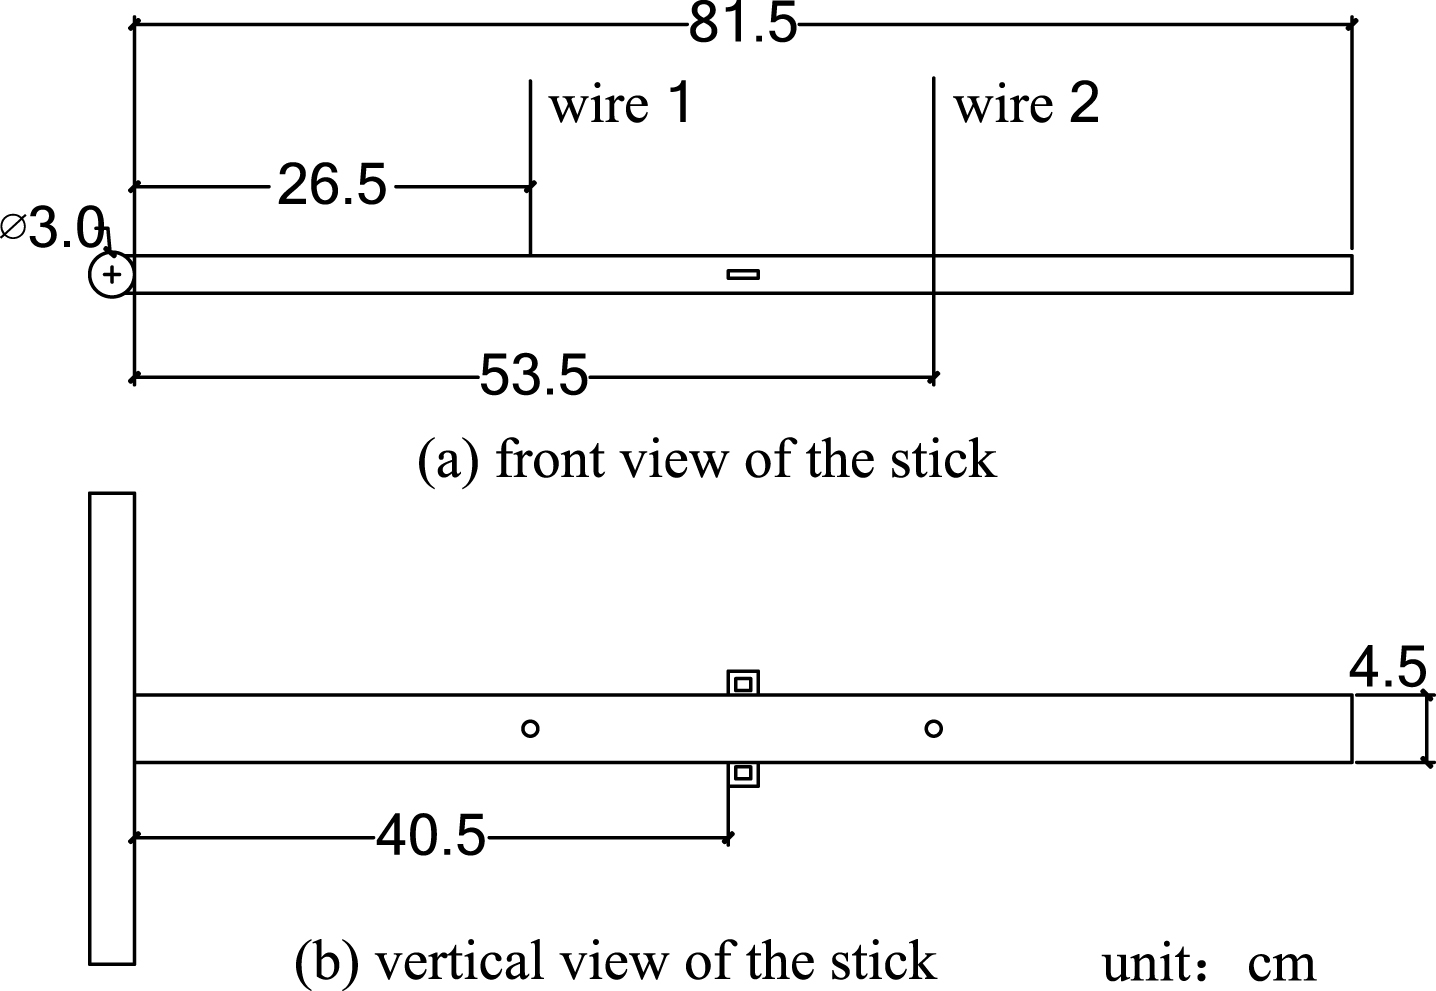
A stick-handle unit (see Fig. 1) for a pallet truck was fabricated [32]. The dimension of this steel unit followed that of a pallet truck which was purchased from a local supplier. This stick-handle unit was a T bar which had an arm of 81.5 cm in length and a cylindrical handle with a diameter of 3 cm on one end. To simulate a pulling task, this stick was suspended to the ceiling using two steel wires at one and two thirds from the end (see Fig. 2). The lower end of the stick was approximately 37 cm above the ground. The lengths of the wires were adjusted so that the angle between the stick and horizon was approximately 42°. This angle was typical for pallet truck pulling. Wires 1 and 2 in Fig. 2 were tilted with angles of 18° and 21° to the vertical, respectively. A weight was suspended at the middle of the stick to generate a back swing force. This force needed to be counterbalanced by the participant in the simulated pulling.
Stick-handle unit.

Pulling force on the simulated truck handle.
A force gauge (Lutron ® Inc., FG-5100) was adopted to measure the pulling strength of the participants. This gauge and the attached S-shape load cell were connected to a chain which was linked to a hook on a wall 37 cm above the ground. This height was that of the lower end of the pulling stick of a commercial pallet truck. The connection of the chain and the load cell allowed measurements of pulling force when the participant pulled the handle on the other end of the chain. The force gauge is capable of measuring a force up to 980N. A digital display on the gauge indicates the maximum force measured.
Borg CR-10
All participants were requested to report ratings of perceived body fatigue on a CR-10 scale [33] after performing a simulated pulling task.
Loading conditions
The load suspended on the stick was either 30 kg or 40 kg. The forces required to maintain static equilibrium under these two loading conditions in Fig. 2 were 87.7N and 123.5N, respectively. The f MVC may be obtained by dividing these two forces using the pulling strength of the participants.
Procedure of experiment
The basic information of the participants was collected upon their arrival in the laboratory. The participants were requested to have a warm up exercise following a commercial aerobic fitness video for 5 minutes.
Before the trial, the pulling strength of the participant was measured. The participant pulled a handle connected to the force gauge unit using his or her dominant arm as hard as he or she could for approximately 6 seconds. The posture of pulling was the same as if he or she was pulling a pallet truck using one hand (see Fig. 3). The peak value on the display of the force gauge was the maximum voluntary contraction (MVC).
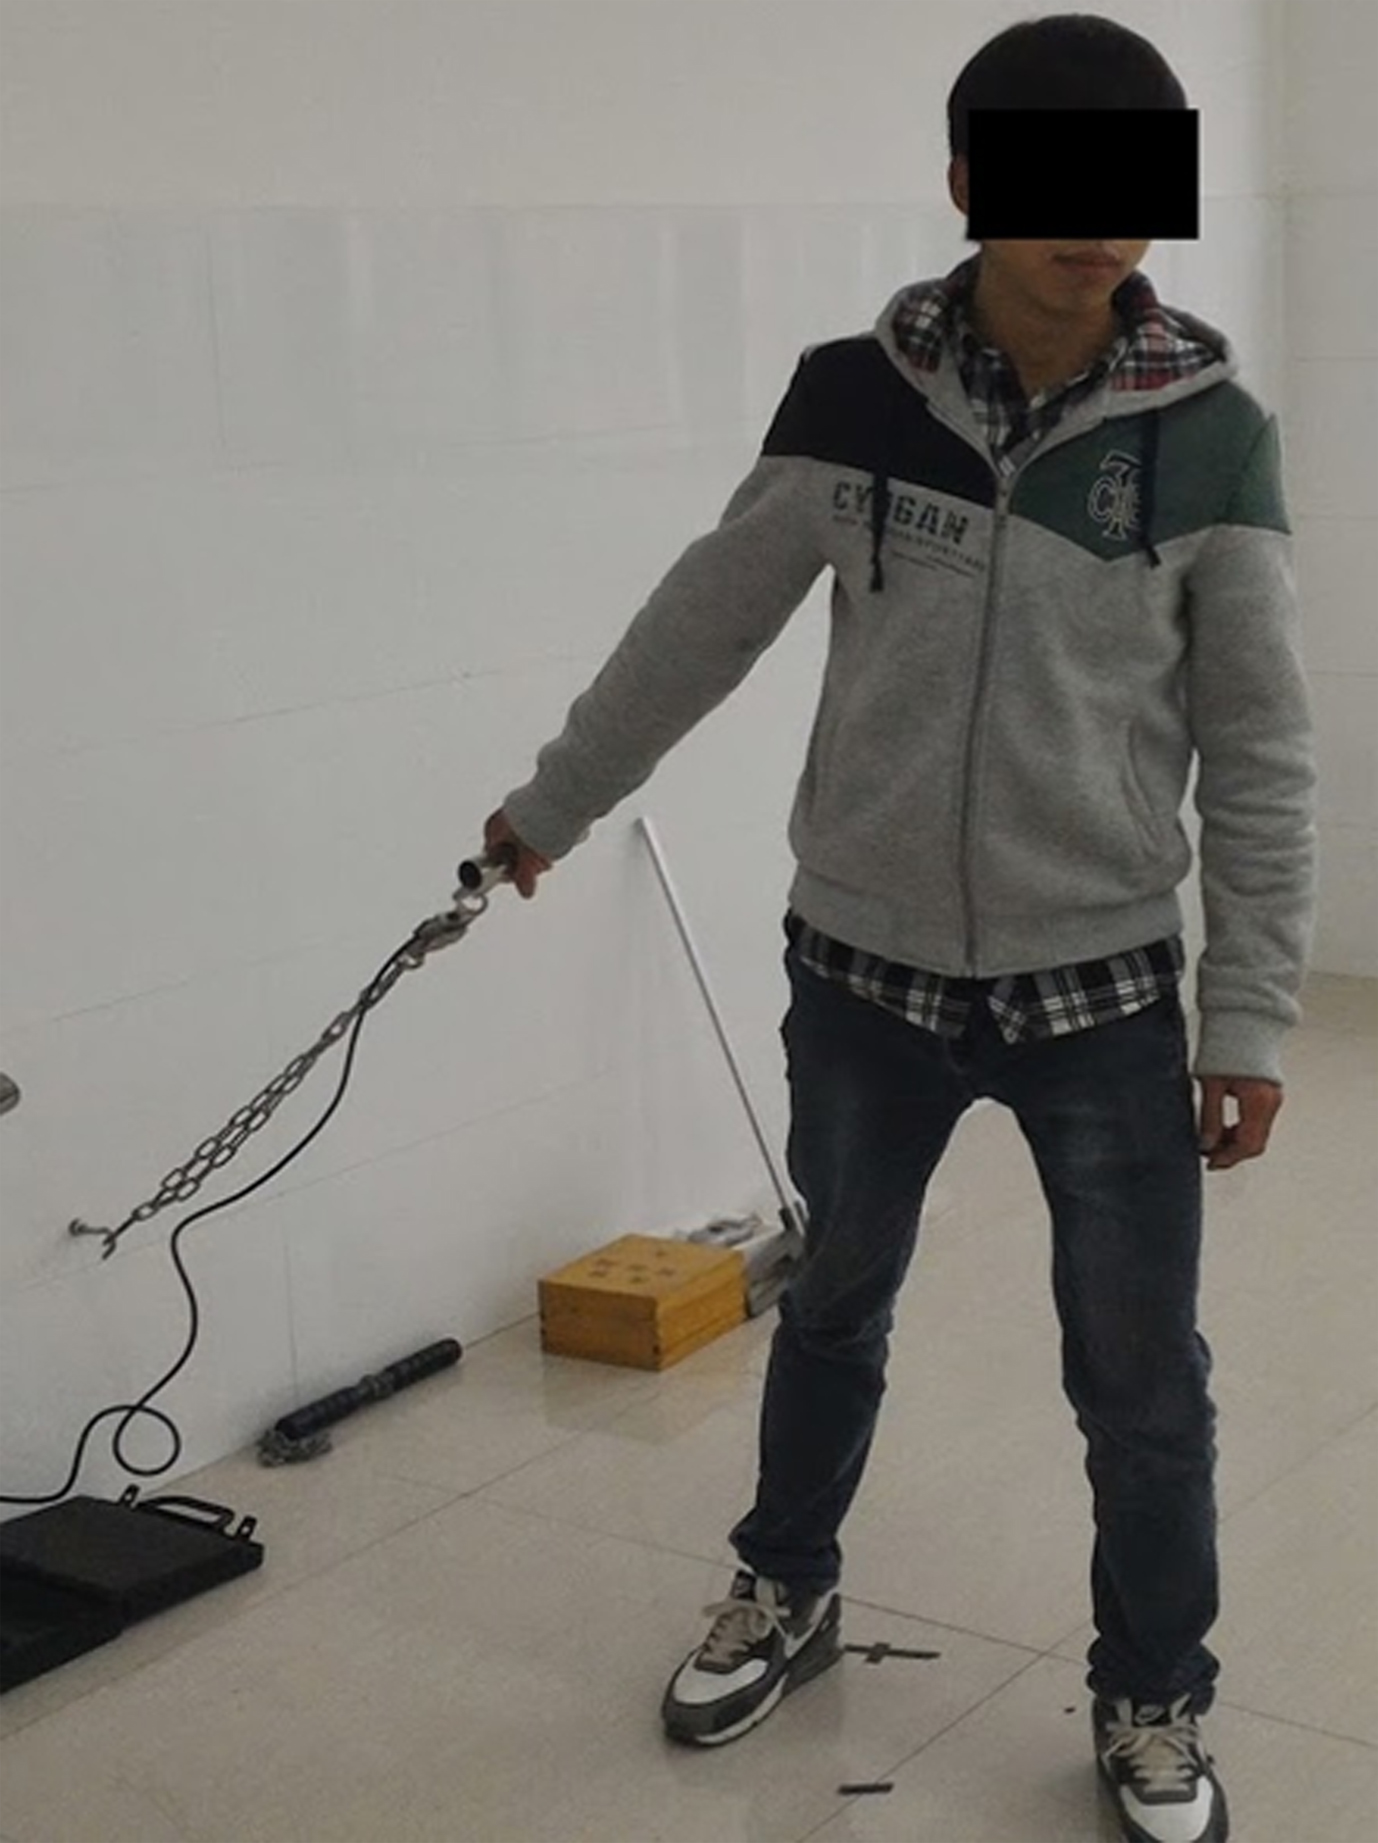
Pulling strength measurement.
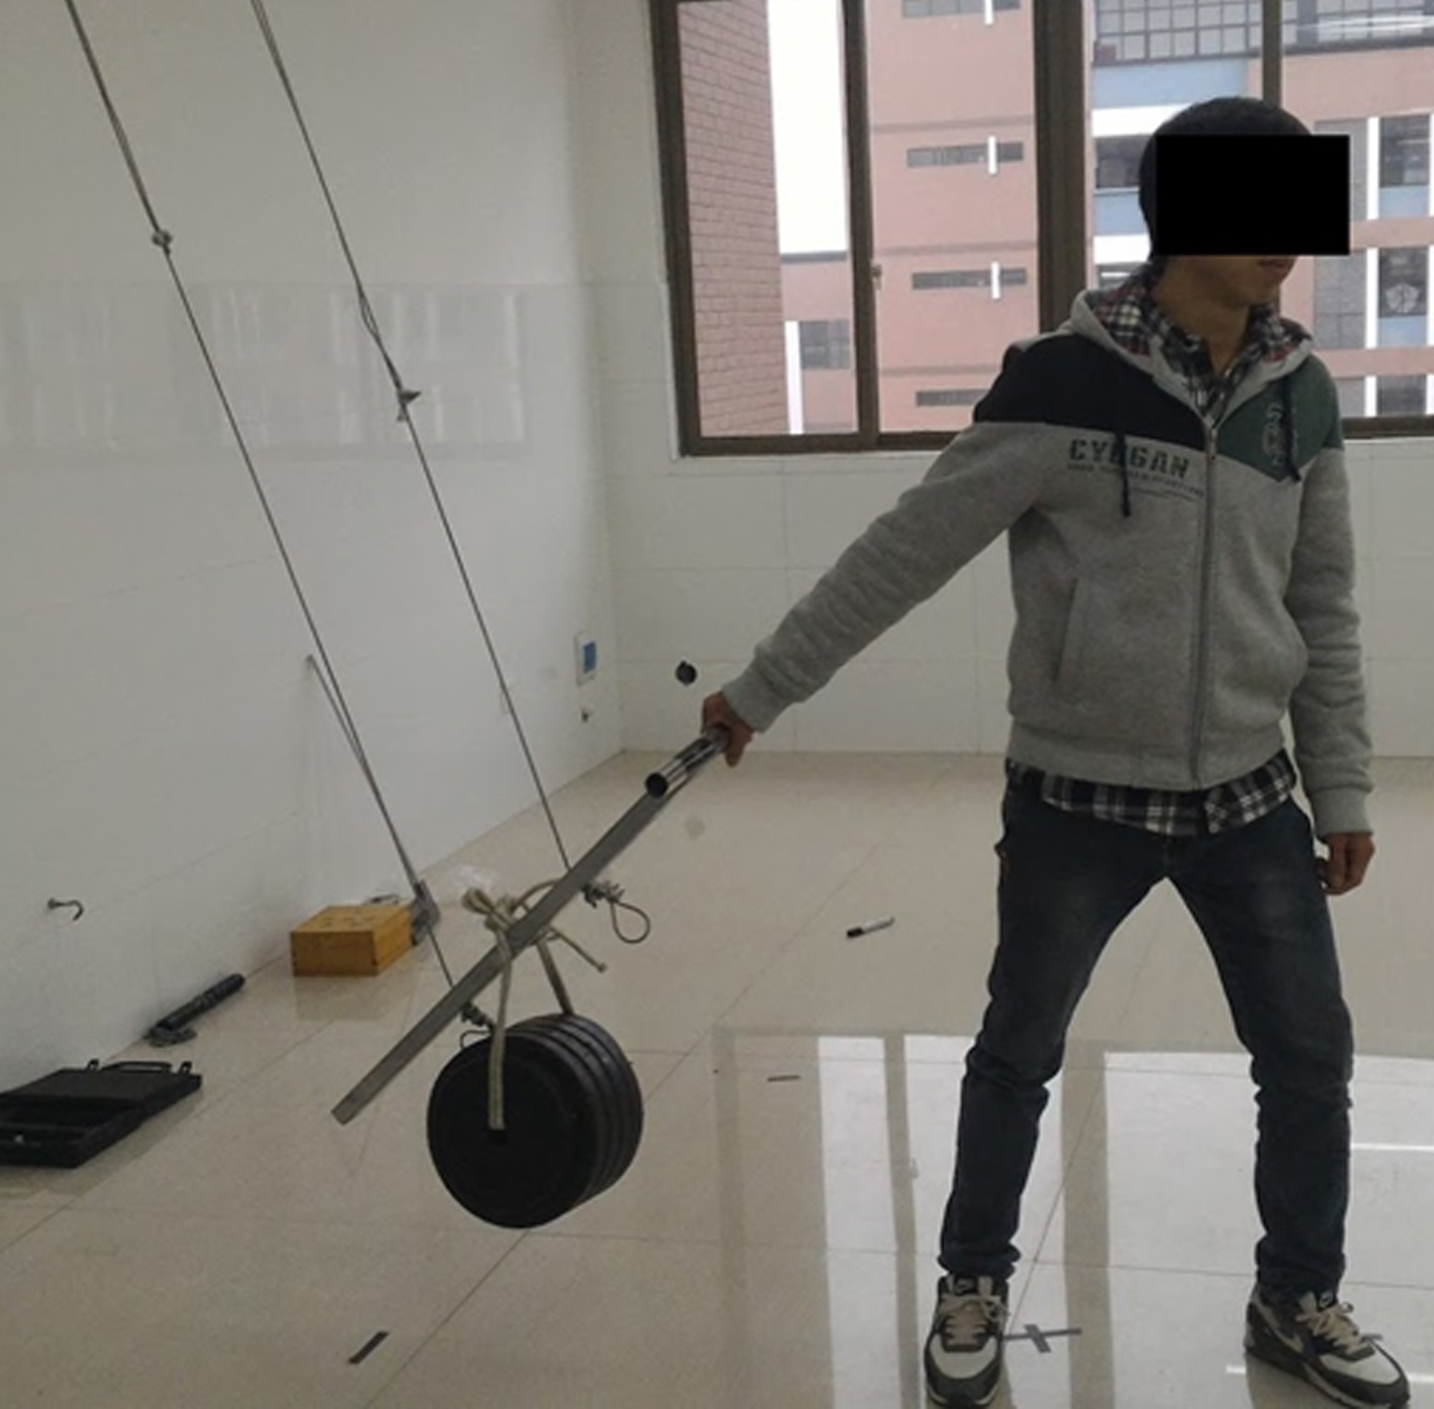
Pulling a simulated truck handle.
In the simulated truck pulling trial, the participant pulled the handle simulating that of truck pulling using his or her dominant hand (see Fig. 4). The left foot of the participant was in the front and the two feet were apart and the left knee was slightly flexed. The participant kept on pulling on the same posture until he or she could last no longer. The time of pulling was recorded as the MET. The CR-10 rating of bodily fatigue on the participant’s hand/wrist, elbow, shoulder, and leg/ankle on the right, and low back were recorded after each trial.
There were four sessions (2 loads×2 trials per load) of the experiment for each of the participants. The participants joined these sessions on four different days. A total of 40 tasks were performed (4 sessions×10 subjects). Analyses of variance (ANOVA) were performed to test the effects of gender and load on the MET and CR-10 rating of muscular fatigue. ANOVA was also performed to test the effects of body segment on the CR-10 rating. Duncan’s multiple range tests were performed if the results were significant at α= 0.05 level. Regression analyses were carried out to establish the MET models for one-handed truck pulling tasks. Statistical analyses were performed using the SAS ® 9.4.
Results
Pulling strength & MET statistics
The pulling strengths for male and female participants were 279.6 (±18.5) N and 208.2 (±16.3) N, respectively. The difference was statistically significant (p < 0.0001). The MET statistics under gender and load conditions are shown in Table 1. The ANOVA results indicated that both gender and load significantly (both at p < 0.0001) affected the MET. The mean (±SD) MET of male participants (9.95±3.46 min) was significantly higher than that of females (4.88±1.79 min). The 30-kg loading condition had a significant higher MET (9.41±3.83 min) than that (5.42±2.38 min) of the 40-kg condition. The two-way interaction effects of load and gender were also significant (p < 0.05).
MET statistics under experimental conditions
MET statistics under experimental conditions
*p < 0.0001.
Muscular fatigue of the participant after performing a pulling task was assessed using the CR-10 ratings. The participants reported CR-10 scores on their hand/wrist, elbow, shoulder, and leg/ankle on the right, and their low back. These body segments were selected because of the contributions of their muscle contractions on the pulling tasks. The ANOVA results of the CR-10 score indicated that both gender and load were insignificant to CR-10. The CR-10 scores among body segments were statistically significant (p < 0.0001). Duncan’s multiple range test results showed that the CR-10 of hand/wrist (6.90±1.86) was significantly (p < 0.05) higher than those of low back (5.68±2.21), leg/ankle (4.90±1.98), and shoulder (4.40±2.44) (See Table 2). The CR-10 of elbow (6.45±1.95) was significantly (p < 0.05) higher than those of leg/ankle, and shoulder. The CR-10 of low back was significantly (p < 0.05) higher than that of shoulder.
Duncan’s multiple range test results for CR-10 scores
Duncan’s multiple range test results for CR-10 scores
Numbers in the parentheses are standard deviation; *different letters in the Duncan’s grouping indicate that they are significantly different at α= 0.05.
Equation (4) was fitted using linear regression analysis. The following equation was obtained:
Equation (6) was significant at p < 0.0001 with a coefficient of determination (R2) of 0.82. Because Ln(a) is equal to 3.81, a is, then, e3.81 or alternatively 45.15. Then, the MET model for Equation (2) is:
Equation (5) was also fitted using linear regression analysis. A no-intercept model was found to have the highest R2. We, then, assumed the constant a in Equations (3) and (5) is equal to 1. The following equation was obtained:
This equation is significant at p < 0.0001 with an R2 of 0.98. The MET model based on Equation (3) is:
To determine the prediction error, the mean absolute deviations (MAD) in Equation (10) were calculated for Equations (7) and (9):
The MADs for Equations (7) and (9) were 1.35 min and 1.28 min, respectively.
Pallet truck pulling is common at work. This study tested the MET of truck pulling using a simulated truck handle unit. The participants pulled the handle until they could no longer do so. There were limitations of the study. The first one was that only ten human participants were tested. This sample size is relatively small as compared to many other similar studies. Secondly, pulling normally involves walking. There was no gait involved in the current study as those in real truck pulling. The dynamics and interactions between the puller and the truck in real truck pulling tasks were, therefore, not fully considered in this study. Nevertheless, Bennett et al. [28] has shown that static contractions of upper body are more fatiguing than the dynamics of walking in truck pulling. Walking, therefore, may not be predominant in determining the endurance time of truck pulling. Another limitation of this study was that our simulated stick/handle unit did not allow simulation of either a start or a stop of a truck pulling. The literature [28] has shown that the start/stop frequency of a truck pulling has significant impacts on the heart rate and metabolic energy expenditure of their participants. How would the force exertions to start and stop a truck pulling affect the endurance time is unknown. Finally, only two loading or force exertion levels were tested. These two conditions resulted in f MVC between 0.28 and 0.67. More loading conditions or force ratios are recommended to be tested in the future.
It was hypothesized that the participants could not pull any longer because their muscle fatigue reached a certain threshold on at least one of the body segments. The literature has identified pulling as one of the MMH tasks contributing to low back pains [29] and shoulder complains [30]. It was anticipated that the subjective ratings of bodily fatigue on low back and shoulder be higher than those of other body segments. The CR-10 scores were collected to identify subjective fatigue levels on body segments. Either the CR-10 of 5 (strong) or 7 (very strong) may be adopted as the threshold for the participants who decided to stop while pulling. The participants responded a CR-10 score of 7 on at least one body segment for all trials except two. For all the trials, the participants gave a CR-10 of 5 on one body segments or more. It was found that hand/wrist and elbow had higher percentages in responding a CR-10 score of 5 or more than the other three body segments. This implies that the participants were more likely to stop pulling because of muscular fatigue on hand/wrist or elbow than the other body segments. There were 62.5% of the CR-10 responses not smaller than 7 for both hand/wrist and elbow. There were 87.5% and 82.5% of the CR-10 responses not smaller than 5 for those of hand/wrist and elbow, respectively. This contradicts with our anticipations that low back and shoulder were the body segments of high CR-10 ratings. Such contradictions may be due to the phenomenon that small muscles, such as those on the arm, are more likely to suffer muscle fatigue than large ones, such as those on the back, especially when sustained static contractions were involved [28].
El ahrache et al. [9] has summarized 24 MET models for static work evaluations. These models were split into 7 general models, 6 back/hip models, and 11 models of upper limb. The upper limb models were further split into 4 shoulder models, 6 elbow models, and one hand model. Frey Law and Avin [21] have summarized 369 data point from 194 publications and developed MET models using both exponential and power functions. Their models were categorized as general, trunk, shoulder, elbow, grip, knee, and ankle models. As the subjective rating results of muscular fatigue indicated the significance of hand/wrist and elbow, hand and elbow models in the literature [13– 16, 19] were employed to predict the MET of our pulling tasks. It was found that the predictions from all of those models underestimated the MET in our experiment. The MADs of those models ranged from 4.3 min to 6.6 min.
Figure 5 shows the actual MET values of our simulated pulling tasks and predicted MET values using our exponential model, power model, and five models from the literature [14, 21]. Rohmert et al. [15] has established MET models on five postures. The posture 2 in their model had the posture that was similar to the posture of our pulling. However, most of the MET estimations using their posture 2 model were lower than our data with a MAD of 6.6 min. Their models of posture 4 (back/hip) and posture 5 (back), on the other hand, provided better fits than their posture 2 model. Our MET data were mostly between the estimates of their posture 4 and posture 5 models.
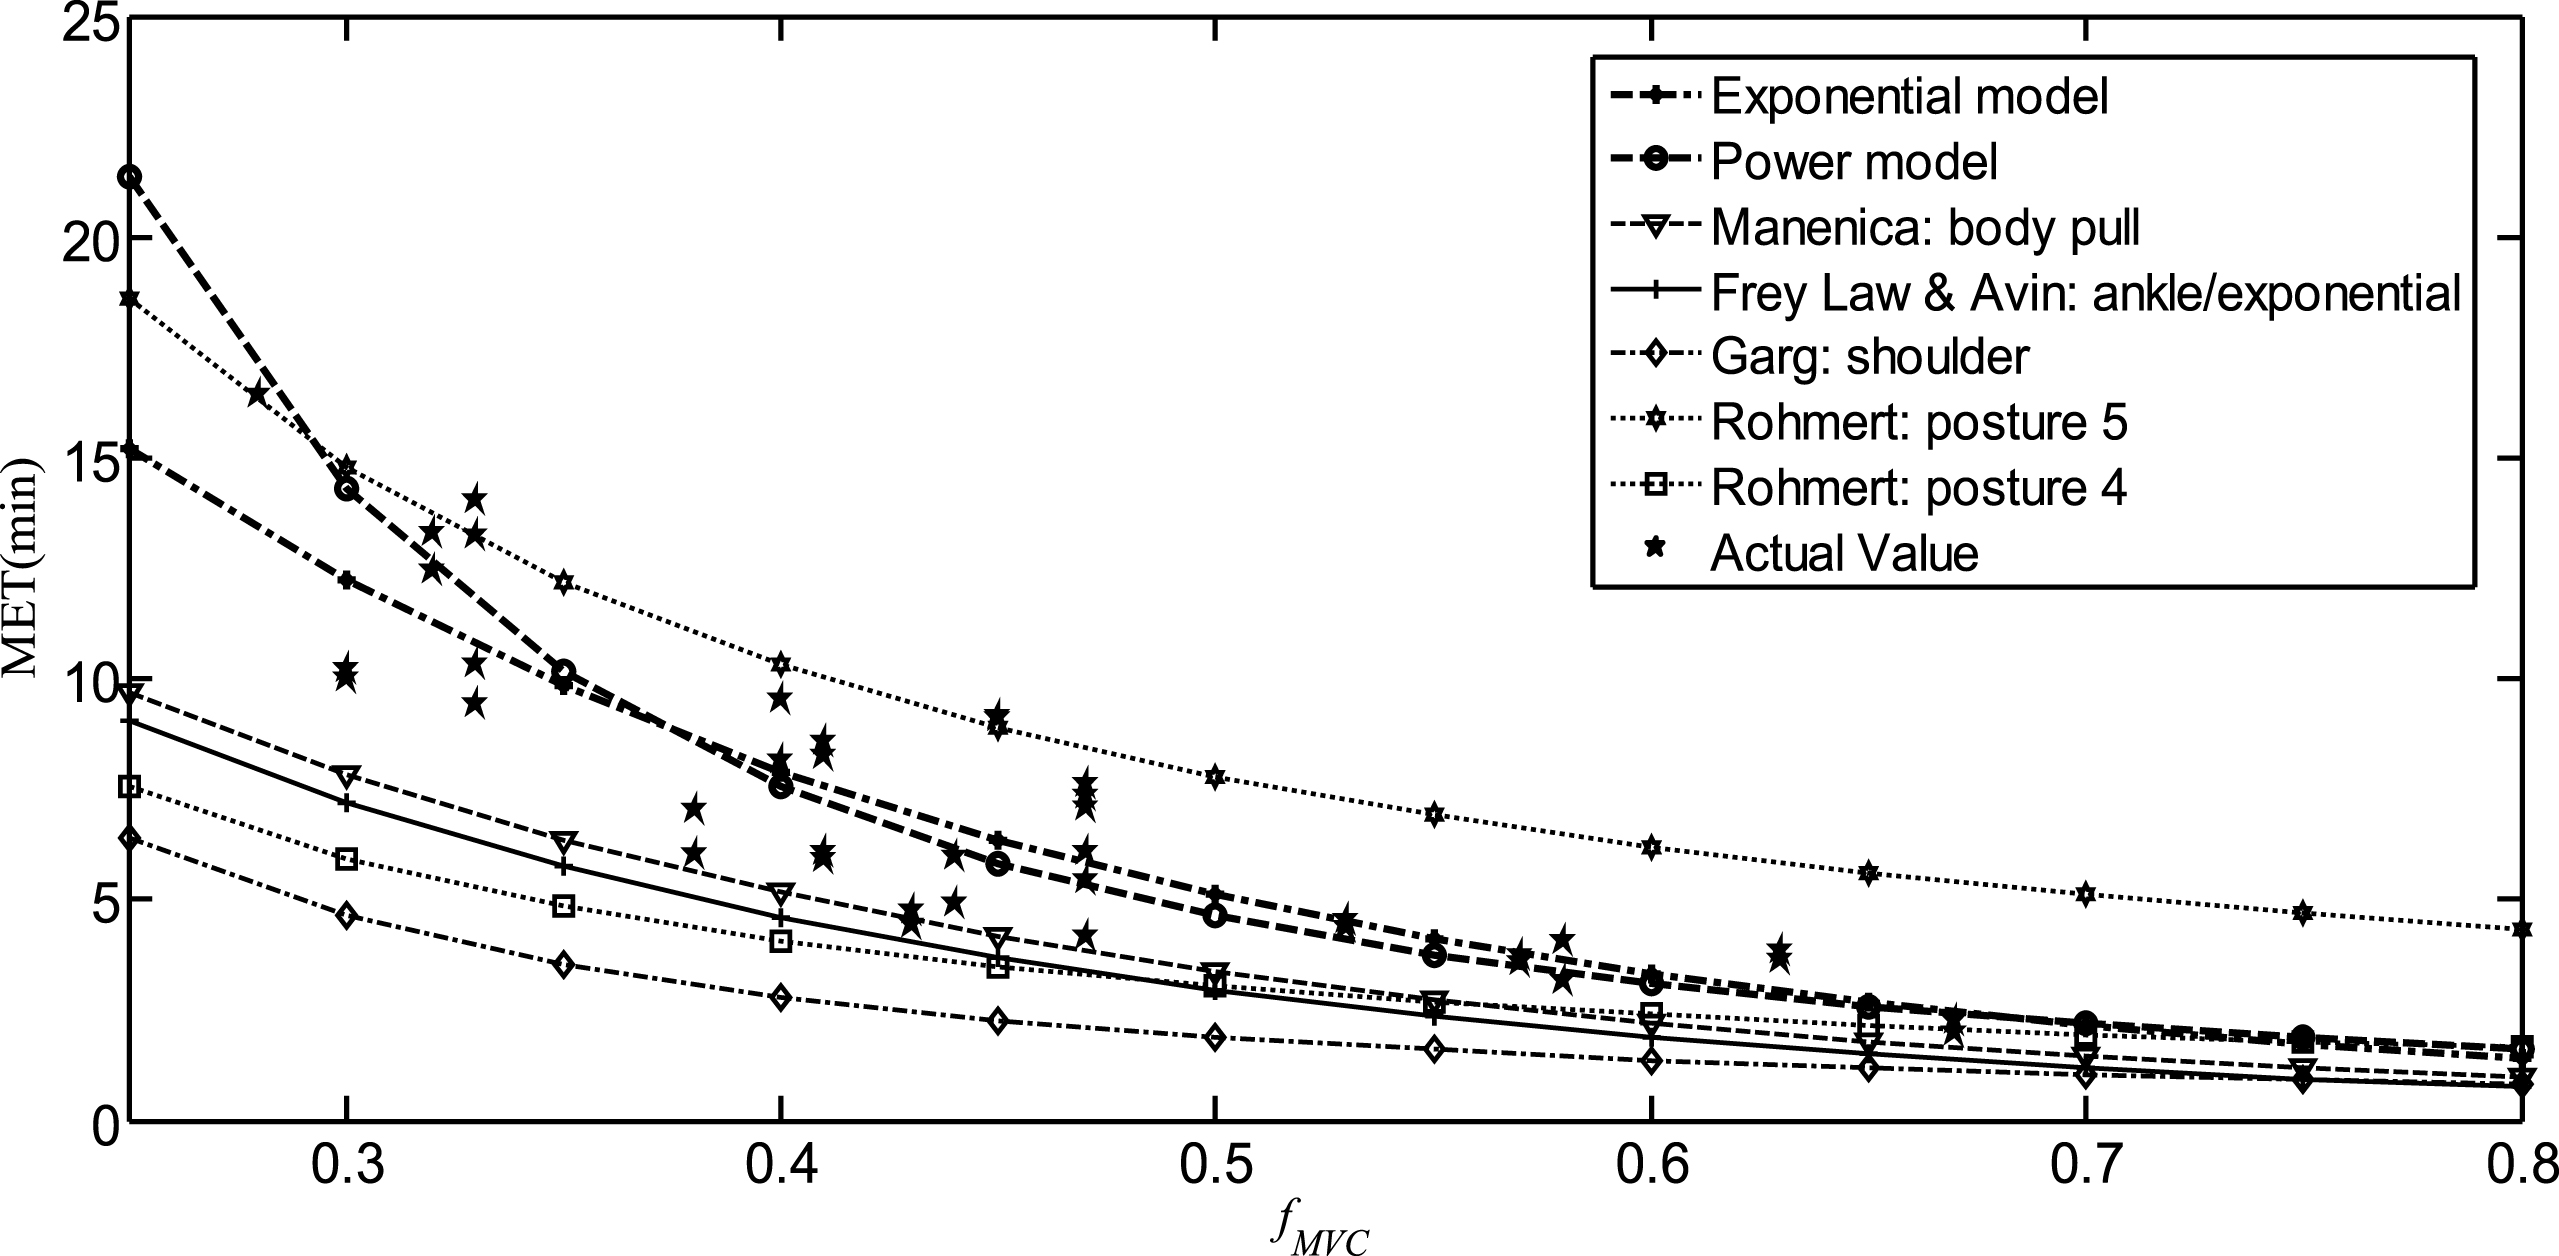
Actual and predicted maximum endurance time for simulated truck pulling.
Manenical [14] has established general MET models and models on the back, elbow, and hand. Among his models, the body pull model was the best one to fit our MET data. This model could predict the MET of our pulling tasks with a MAD of 2.7 min. Frey Law and Avin [21] reported MET models using both exponential and power functions. Their models encompassed general models and models on shoulder, elbow, hand, trunk, knee, and ankle. Their exponential function-based ankle model provided better estimates of our pulling tasks than all of their other models. The MAD of this ankle model in estimating our data was 3.25 min.
The MET model of Ma et al. [20, 22] was also employed to predict the MET of our pulling tasks for comparison purpose. The MET predictions using this theoretical model were calculated by assuming k is equal to 1. The predicted MET values were found to be lower than the actual values with a MAD of 5.3 min. To have better fit of our pulling data, a k value lower than 1 is desired. It was found that the MAD of the predictions using the model of Ma et al. [20, 22] could be as low as 1.31 min, which is approximately the same level as our models, if k is equal to 0.29.
The literature [21] has indicated that muscle fatigue depends not only on muscle contraction intensity but also on the joint and a single generalized fatigue model may not adequately represent most individual joints. The underestimations of several models in the literature mentioned-above may be attributed to the facts that pulling a pallet truck requires engagement of multiple muscles and joints, including upper extremities, shoulder, back, and lower extremities. Empirical models based on a certain joint may not be sufficient to assess the endurance time under such circumstance. The back/hip and back models [15] and the body pull [14] model in the literature could be more appropriate in estimating our pulling data than those of the hand and elbow models [13, 19]. An additional source of variation that most empirical models in the literature did not consider in assessing the endurance time of truck pulling is the strategy of muscle contractions among body segments. In a sustained pulling task, a puller could alternate activations of muscle contractions among different body segments [28]. For example, the puller may activate more muscle contractions on forearm to reduce the loading on the back when he or she feels back fatigue. The puller may, on the hand, activate more back muscle contractions so as to reduce the loading on the arm when he or she feels arm fatigue. Alternating muscle contractions among body segments may play an important role in reducing overexertion in specific muscles and thus extending the MET of the puller [28]. This may also explain partially the underestimations of the models in the literature [13– 15, 19] in estimating our MET data.
Many joint-specific MET models have been reported in the literature [11– 19, 21]. In this study, we’ve established two task-specific MET models. These models were based on an experiment that simulated one-handed pallet truck pulling tasks. The range of the f MVC for the two models was between 0.28 to 0.67. With the limitations mentioned previously, our MET models may be adopted to determine the acceptable duration and work/rest allowance for truck pulling tasks. Future studies may be needed to investigate the needs of revising these models considering the real walking conditions.
Conflict of interest
None to report.
Footnotes
Acknowledgments
This research was partially supported by Natural Science Foundation of Hunan Province, China (2017JJ3054), a funding from the Major Project Foundation of Double First-rate of Hunan Institute of Technology, China (2017HGPY07), a funding from the Hunan Institute of Technology (HQ16004), and Educational Commission of Hunan Province, China (16C0449).