
Abstract
BACKGROUND:
The amount of time between key points in the work disability and workers’ compensation process, referred to as lag times, has been shown to relate to work disability outcomes but little research has examined how this finding may differ based on the diagnosis associated with the cause of work disability.
OBJECTIVE:
To examine whether relationships between lag times in the work disability process and disability duration vary by diagnosis in a sample of workers’ compensation claims.
METHODS:
Using workers’ compensation claims, Analysis of Covariance was used to estimate differences in disability duration across three lag times (days from the date of injury to: reporting the injury, seeking medical care, and starting lost work time paid by the workers’ compensation insurer) and injury diagnosis groups (Work-related Musculoskeletal Disorders (WRMSD) and fractures).
RESULTS:
WRMSD tended to have longer lag times than fractures, whereas disability duration tended to be longer for fractures than WRMSD. Overall, shorter lag times were associated with shorter disability duration, but the relationships varied across diagnosis groups, and greater variation in disability duration was observed for WRMSD compared to fractures.
CONCLUSIONS:
The findings suggest the importance of responding to work-related injuries by reporting the injury, receiving medical care, and taking time off of work if necessary, in a timely fashion.
Keywords
Introduction
Occupational injury and illness presents a serious burden to U.S. workplaces. In 2014 alone, there were close to three million injuries and illnesses among private employers [1]. It is estimated that occupational injury and illness costs employers over $100 billion per year, and the majority of these costs result from injuries and illnesses that require some type of work restriction or time off work [2, 3]. As a result of these high costs, identifying opportunities to decrease the impact of work disability is a priority.
Among the many potential factors impacting work disability, one area of research to be explored is how the amount of time between various points in the work-disability reporting and claim disability process impacts work-disability duration. In this paper, we refer to the amount of time between points in the disability process as “lag times”. Throughout the disability process there are various lag times that can occur. The lag times may include the time between injury occurrence and seeking medical care, or the time between injury and reporting the injury to the insurer. Explanations for why lag times occur are multifactorial. They may occur due to fears of reporting injuries, administrative delays, organizational practices, insurance policies, health care access, health literacy, and/or a hope that symptoms will resolve spontaneously. It is possible that these lag times may be associated with an increase in length of disability after an occupational injury or illness. Although there are many potential sources of time lags in the system, better understanding of lag times in the work-disability process may provide opportunities to improve recognition and reporting of occupational injury, worker information, claims management, and workers’ compensation policies, which may ultimately result in decreased length of work disability and improved return to work (RTW) outcomes.
The majority of previous research focusing on lag times has examined the time between injury and seeking medical care. For example, Stover et al. examined the impact of the lag time between injury and first medical visit, categorized as less than 10 days, 10–20 days, and more than 20 days, and found that those waiting more than 20 days from injury to receive medical care were significantly more likely to have more than 6 months of cumulative compensated lost work- days compared to those waiting less than 10 days [4]. Additional studies have also found that waiting longer after injury to receive medical treatment was associated with delayed RTW and chronic disability [5–9]. However, one study found that the lag time in seeking medical care after injury was not related to RTW outcomes, when comparing lag times of 0 days to lag times of 1 to 3 days and 4 days or longer [10].
There has also been research to suggest that the time between injury and reporting that injury to an employer or workers’ compensation insurer is related to disability outcomes. One study found that an increased number of days between injury and reporting the injury to the employer was shown to be among the factors associated with both functional limitations and failing to RTW [11]. Another study found over a 20 day increase in the length of disability when comparing a lag time in reporting an injury to a workers’ compensation insurer within 1 to 3 days to a lag time of 60 days or more [7]. In that same study, the authors also found that the time between injury and first going out on work disability was related to the length of disability, with the length of disability increasing as the length of the lag time increased [7].
To summarize, with the exception of one study, which found no relationship between the lag time in seeking medical care and RTW outcomes, all other studies have indicated that across the different types of lag times (i.e., the lag time in seeking medical treatment, the lag time in reporting an injury, and the lag time in taking time off work), increased lengths of lag timesrelated to longer lengths of disability and worse RTW outcomes. In these previous studies, many focused on low back injuries specifically [5–11]. One study examined lag times in a sample of workers’ compensation claimants, however no analyses were conducted to assess whether the impact of lag times on work-disability outcomes varied across diagnosis groups.
While there has been little exploration of the association between lag times and length of disability across different types of injuries or conditions, it is possible that the role of lag times in the work disability process may function differently across diagnoses. For example, it is possible that a delay in seeking medical treatment following a low back injury may impact disability duration differently than following an arm fracture. If differences exist, this may have implications for creating guidelines about when to report and seek treatment for different work- related injuries.
In this study, we focus specifically on work-related musculoskeletal disorders (WRMSD) and fractures. WRMSD, sometimes referred to as repetitive stress injury or cumulative trauma disorder include injuries such as sciatica and bursitis. This group of disorders covers a wide range of conditions that effect tendons, joints, muscles, ligaments, and nerves. These disorders impact a variety of body areas such as the back, knee, arm, and shoulder. WRMSD account for a substantial portion of all workers’ compensation claims [12–14]. While some of these conditions result from well-known pathologies, such as osteoarthritis, many cannot be attributed to a specific pathology [13]. Often there is not a specific diagnostic tool to confirm a diagnosis, symptoms can be non-specific and appear gradually overtime, and there is no clear cause of the condition, which may raise questions about the work-relatedness of the condition [13, 15]. In contrast to WRMSD, work-related fractures are a specific diagnosis, for which diagnostic tools are available to confirm a diagnosis, and the work-relatedness of fractures tendsto be very clear. We have chosen to focus on WRMSD and fractures in the current study in order to illustrate how the relationship between lag times and disability duration may operate differently for specific work-related injuries (i.e fractures) compared to less specific conditions (i.e. WRMSDs).
The goal of the current study was to address three research questions: 1) Does lag time vary by diagnosis group?; 2) Does lag time relate to the length of disability regardless of diagnosis group?; and 3) Does the relationship between lag time and the length of disability vary across diagnosis groups? In this study, we focused on three specific lag times in the work-disability claims process: 1) the time between when an injury occurred and when the injury was reported to the workers’ compensation insurer; 2) the time between when an injury occurred and when an individual first received medical care; and 3) the time between when an injury occurred and when an individual first took time off work. These lag times were developed from key points in the work-disability process, with the idea that lags in these timeframes may influence work-disability outcomes.
Methods
This study was conducted using claims within the workers’ compensation system. Workers’ compensation is a type of insurance coverage that provides wage replacement and medical benefits to workers who were injured while on the job. Workers’ compensation coverage varies across jurisdictions within the United States and is usually paid for by the employer. Workers’ compensation insurance is designed to only cover injuries or illnesses that are caused or substantially aggravated by a work event.
All workers’ compensation claims for WRMSD or fractures from a large workers’ compensation insurance company in the United States for individuals who had an injury date between January 1, 2002 and December 31, 2008 were assessed for inclusion. The administrative records for this study represented injured workers from a wide variety of industries and organizations. We focused on injured workers with at least one day of paid lost work time, either temporary total disability or temporary partial disability within one year of the injury date who were ages 18 to 80 at the time of injury. This study was approved by the New England Institutional Review Board.
We restricted our sample to injured workers who had only one claim and only one episode of disability for a single claim within a calendar year. If workers returned to work and then went back out on paid lost work time after having returned for 14 days or longer within a calendar year, they were excluded. Gaps in payment of less than 14 days were ignored. Workers who received a lump sum payment within one year of the injury date were excluded as it is difficult to estimate the true length of disability in such claims. In total, 76,067 claims were used in our analyses. A flow chart of the inclusion specifications is presented in Fig. 1. For this type of study which utilized already collected administrative data, formal consent is not required.
Flow chart of data restrictions for the analytic sample.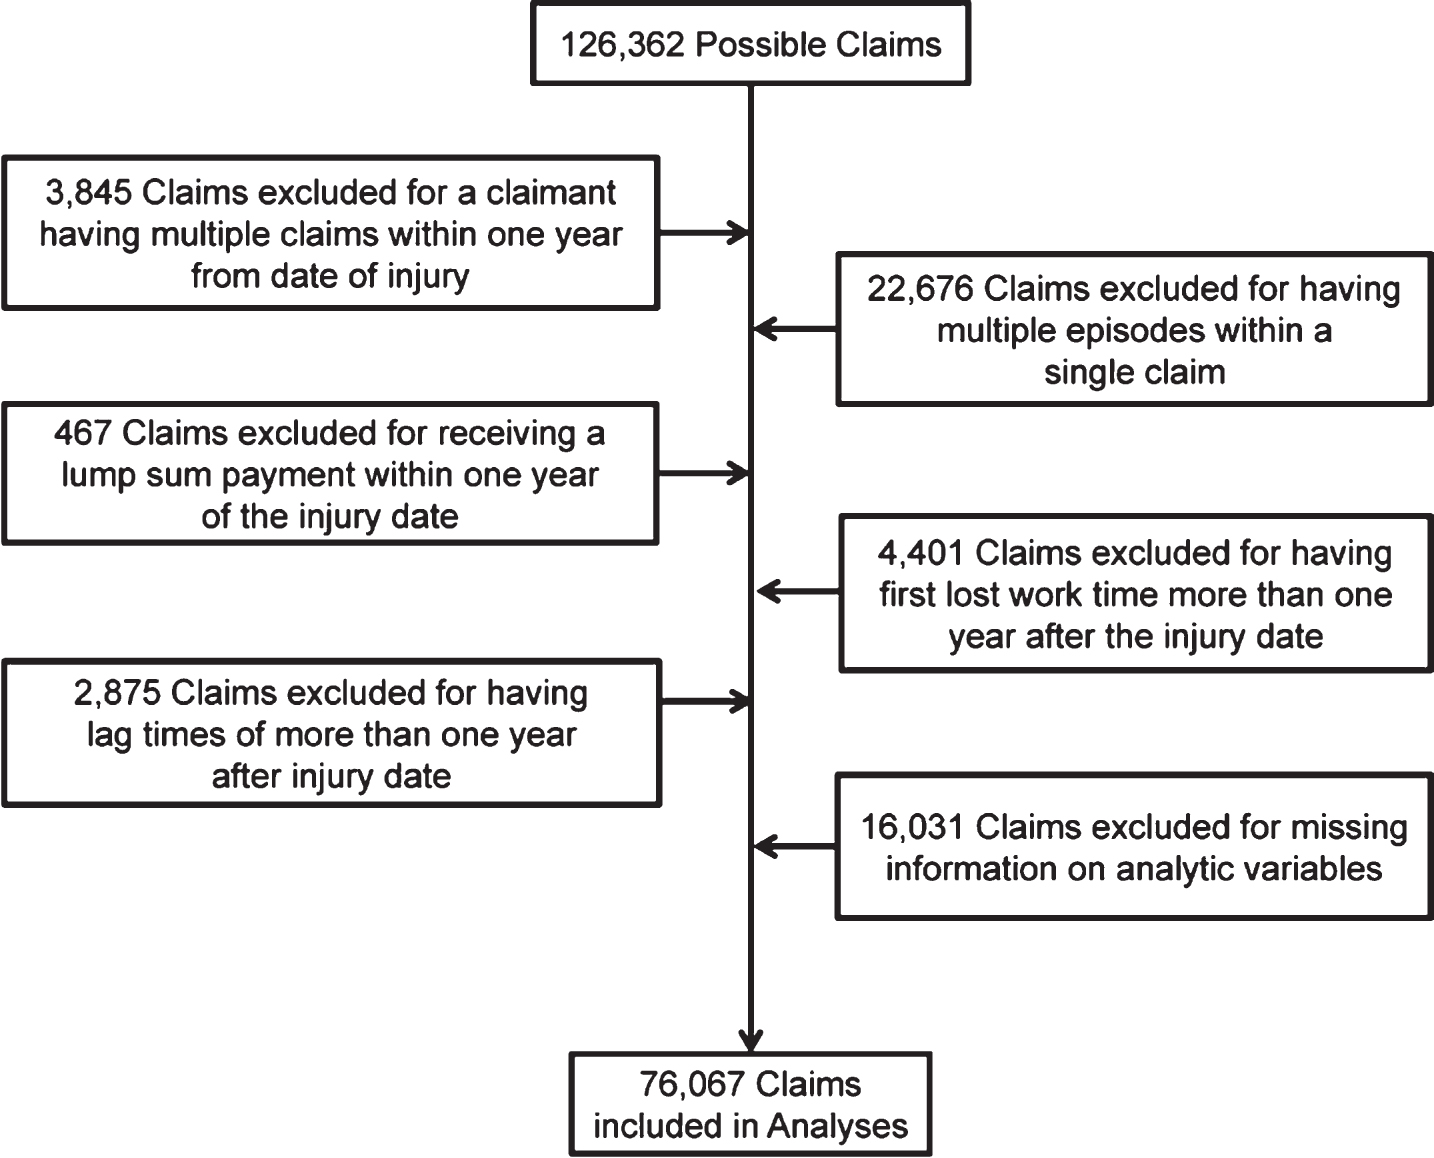
Lag times
In this study, we focus on three lag times in the workers’ compensation process: 1) reporting lag time, 2) medical services lag time, and 3) work disability lag time. The reporting lag time represents the number of days from the date of injury to the date at which the injury was first reported to the workers’ compensation insurer. The medical services lag time represents the number of days from the date of injury to the date at which the injured worker first sought medical care covered by the workers’ compensation insurer for that injury. Workers may have sought medical care outside of the workers’ compensation system prior to initiating care covered by the workers’ compensation insurer. We utilize the first instance of medical care actually covered by the workers’ compensation insurer and exclude any care that may have been provided outside of the workers’ compensation system. The work disability lag time represents the number of days from the date of injury to the date at which an injured worker first took paid lost work time. Due to highly skewed distributions, in the analyses, the lag times were categorized into five categories: 0 to 1 day lag, 2 to 6 days lag, 1 week up to 2 weeks lag, 2 weeks up to 30 days lag, and 30 days up to 1 year lag. These categories were selected based on the lag time distributions to retain appropriately sized sub-samples while maintaining meaningful cutoff points for the lag times.
Diagnosis group
In this study, we focus on two groups of injuries and disorders: 1) WRMSD and 2) Fractures. In order to identify claims in these groups, we reviewed the ICD-9 diagnosis codes that were reported in the claimant’s medical service bills for the first 15 days of medical treatment. Claims were categorized into one of the injury/disorder groups if more than 50% of the ICD-9 diagnosis codes in the first 15 days of medical service bills were for a given group (see Table 1 for a list of ICD-9 codes for each injury/disorder group). For claims where the dominant diagnosis did not fall into one of the diagnosis groups, the claims were excluded from the sample. Below, we describe the five most prevalent unique four or five digit ICD-9 diagnoses in the first 15 days by each of the diagnosis groups. For WRMSD, the most prevalent codes represented 36% of the unique ICD-9 diagnoses codes in the first 15 days. Two of the codes were for back pain (724.2-Lumbago and 724.5-Backache, unspecified), two were for joint pain (719.41-Pain in joint, shoulder region and 719.46-Pain in joint, lower leg), and the final code was for a general soft tissue disorder (729.5-Pain in limb). For fractures, the most prevalent codes represented 24% of the unique ICD-9 diagnoses codes in the first 15 days and they included: 824.8-Unspecified fracture of ankle, closed; 825.25-Closed fracture of metatarsal bone; 813.42-Other closed fractures of distal end of radius; 816.00-Closed fracture of phalanx or phalanges of hand, unspecified; and 826.0-Closed fracture of one or more phalanges of foot.
ICD-9 Codes for Diagnosis Groups
ICD-9 Codes for Diagnosis Groups
*WRMSD = Work-Related Musculoskeletal Disorders.
Length of disability was calculated as the number of days from the date that a claimant first took paid lost work time until the date at which paid lost work time ended. We focused on both partial and total paid lost work time in order to approximate the length of disability to a full return to work. Paid lost work time was considered to have ended when no disability days were taken for at least 14-days consecutively. In 12,554 claims, the length of disability was top coded at 365 days, as only a relatively small number of claims continue past a year. The natural log of the length of disability was used in the analyses due to issues with normality.
Covariates
The following covariates that may relate to length of disability were used: gender, annual income, industry, litigation status, year of injury, age, tenure, the number of unique diagnoses, and the average number of times each unique diagnosis appeared. Gender was coded 1 for female and 0 for male. Sixteen ordered categories were used to assess annual income: $0-$9,999, $10,000-$19,999, $20,000-$29,999, $30,000-$39,999, $40,000-$49,999, $50,000-$59,999, $60,000-$69,999, $70,000-$79,999, $80,000-$89,999, $90,000-$99,999, $100,000-$109,999, $110,000-$119,999, $120,000-$129,999, $130,000-$139,999, $140,000-$149,999, and $150,000 or more. Industry was categorized into 10 groups closely matching the U.S. Department of Labor’s Standard Industry Classification groups [16] which include: agriculture, forestry and fishing, construction, finance and insurance, manufacturing, mining, retail trade, services, transportation, public administration, and wholesale trade. Litigation status was coded 1 if the workers’ compensation insurer assigned an attorney to the claim and 0 if not. The analyses controlled for the year of the injury from 2002–2008. Age was measured continuously as the claimant’s age at the time of injury. Tenure at the organization was calculated based on the date of hire and the date the injury occurred. For analytic purposes, the natural log of tenure was used due to issues with normality. The number of unique ICD-9 diagnosis codes that were reported in the claimant’s medical service bills for the first 15 days of medical treatment ranged from 1 to 38. Less than 1% of the sample had more than 14 unique codes. For analyses, the number was top coded at 14 unique codes. The average number of times each unique diagnosis appeared ranged from 1 to 114. Less than 1% of the sample had an average frequency of more than 20 times per a unique code in the medical bills. The number was top coded at 20 times for analyses. The average number of times each unique diagnosis appeared may serve as a proxy for the quantity of medical services required for a given diagnosis for each claim. We included both the number of unique diagnoses and the average number of times each unique diagnosis appeared as covariates as these variables may indicate the complexity, severity, and amount of treatment for a claim that is likely to be associated with the length of disability.
Analyses
Preliminary analyses looked at the sample sizes within the lag times between diagnosis groups. The first set of analyses examined differences across lag times by diagnosis groups using t-tests. Next, a series of Analyses of Covariance (ANCOVA) were used to estimate differences in the length of disability across the three lag times and the diagnosis groups. Separate analyses were conducted for each of the three lag times due to concerns about collinearity among the lag times. Two-way interactions between lag times and diagnosis groups were tested in order to assess whether the relationship between lag times and the length of disability varied across diagnosis groups. Analyses were adjusted for gender, annual income, industry, litigation status, year of injury, age, tenure, the number of unique diagnoses, and the average number of timeseach unique diagnosis appeared. Post hoc comparisons using Bonferroni’s adjustment were used to assess differences among the lag times and diagnosis groups. STATA 13 was used to perform the analyses (Stata Corporation, College Station, Texas). Although tests with a p-value of less than 0.05 were used to gauge statistical significance in our analyses, we present findings in terms of the length of disability in days in order to discuss our findings in a more practical and meaningful way. In addition, where possible, 95% confidence intervals are also presented.
Results
Of the 76,067 claims included in the analyses, the majority of claims (66.3%) were for men, with an average age of 42.4 years (SD 11.9 years) and an average length of tenure of 6.5 years (SD 7.6 years). More than half of the claimants had an annual income of $20,000– $50,000, and approximately one percent of claimants had an annual income of over $100,000. A quarter (27.0%) of claims had a lawyer assigned to them by the workers’ compensation insurer. Claimants worked in a variety of industries, but the most frequent industries represented were manufacturing (24.3%), transportation (22.0%), and services (22.6%). Claimants had an average of 2 unique ICD-9 diagnosis codes in the first 15 days of medical bills (SD 1.94), and on average, each unique ICD-9 code appeared 4 times in the medical bills (SD 3.25). Within our sample, 74.6% of claims were classified as WRMSD, and 25.4% were classified as fractures. The length of disability ranged from 1 to 365 days with an average length of disability of 96 days (SD 108.8 days). A descriptives table is presented in the Appendix.
The breakdown of claims in each of the lag time categories by diagnosis group is presented in Table 2. For each of the lag times, overall, the greatest percentage of claims had a 0 to 1 day lag time (33% reporting lag time; 53% medical services lag time; 45% work disability lag time). However, for the reporting lag time, the largest percentage of WRMSD claimants actually had a 2 to 6 days lag time (31% of WRMSD claimants), and over 10% of WRMSD claimants had not reported the injury within 30 days of it occurring. When examining the medical services lag time specifically, over 85% of the fracture claimants received medical care within a day of injury, whereas less than half of the WRMSD claimants did (41%). For the work disability lag time, approximately a third of WRMSD claimants had not started paid work disability within 30 days of injury, but in the fractures claimants, less than 5% waited 30 days orlonger to begin paid work disability. T-tests were used to examine differences in the mean days of lag across the diagnosis groups for each of the types of lag time. For all lag times, the mean days of lag were shorter for fractures than for WRMSD (reporting lag time: t(76065) = –48.51, p < 0.001; medical services lag time: t(76065) = –51.81, p < 0.001; work disability lag time: t(76065) = –69.92, p < 0.001).
Breakdown of Claims in Each Lag Time Categories by Diagnosis Group
Breakdown of Claims in Each Lag Time Categories by Diagnosis Group
*WRMSD = Work-Related Musculoskeletal Disorders.
Separate ANCOVAs were estimated for each of the three types of lag times: reporting lag time, medical services lag time, and work disability lag time. Across all three types, significant differences were observed in the adjusted length of disability (aLOD) across the lag time categories: reporting lag time (F(4, 76035) = 32.54, p < 0.001), medical services lag time (F(4, 76035) = 36.39, p < 0.001), and work disability lag time (F(4, 76035) = 39.68, p < 0.001). Post hoc comparisons for the ANCOVAs are presented in Table 3. For the all three types of lag times, the aLOD tended to be 1 week to 2 weeks shorter when the lag time was less than 1 week, compared to 2 weeks or longer. In general, the aLOD increased as the lag time increased. However, for the reporting lag time, the aLOD was significantly longer for a lag time of 0 to 1 day in comparison to a lag time of 2 to 6 days and for the work disability lag time, a lag time of 2 weeks up to 30 days had a significantly longer aLOD compared to a lag time of 30 days up to a year. Overall, across all lag time categories, the aLOD varied by 17 days for the work disability lag time, by 20 days for the medical services lag time, and by 17 days for the reporting lag time.
Adjusted Length of Disability in Days by Diagnosis Groups
Adjusted Length of Disability in Days by Diagnosis Groups
WRMSD = Work-Related Musculoskeletal Disorders.
Post hoc comparisons using Bonferroni’s adjustment. All reported comparisons significant at p < 0.05.
The results of the ANCOVA for the reporting lag time revealed a significant interaction between the reporting lag time and diagnosis groups (F(4, 76035) = 11.38, p < 0.001). Similarly, the ANCOVA for the medical services lag time showed an interaction between the medical services lag time and diagnosis groups (F(4, 76035) = 9.90, p < 0.001). Additionally, the ANCOVA for the work disability lag time also showed an interaction between the work disability lag time and diagnosis groups (F(4, 76035) = 88.50, p < 0.001).
The results of the post hoc comparisons for the lag times by the diagnosis groups are also presented in Table 3. As can be seen, for both the reporting lag time and the medical services lag time, the aLOD was generally 1 to 2 days shorter for WRMSD than fractures. However, for the work disability lag time specifically, there was no statistical difference in the aLODs for WRMSD and fractures.
To further explore these results, we plotted the aLOD across each of the lag times and diagnosis groups (see Fig. 2 for the reporting lag time, Fig. 3 for the medical services lag time, and Fig. 4 for the work disability lag time). The main difference between the patterns for WRMSD and fractures was where the turning point occurred for the aLOD decreasing across lag time categories to increasing. For WRMSD, that turning point occurred earlier than for fractures. Specifically, as can be seen in Fig. 2, for WRMSD, the aLOD initially decreased slightly for a lag time of 0 to 1 day compared to 2 to 6 days, however, the aLOD then increased by approximately a week and a half going from a reporting lag time of 2 to 6 days compared to a lag time of 30 days up to a year. For fractures, the aLOD decreased slightly from a reporting lag time of 0 to 1 day to a lag time of 1 week up to 2 weeks, and then the aLOD increased by 2 weeks for a reporting lag time of 30 days up to a year.
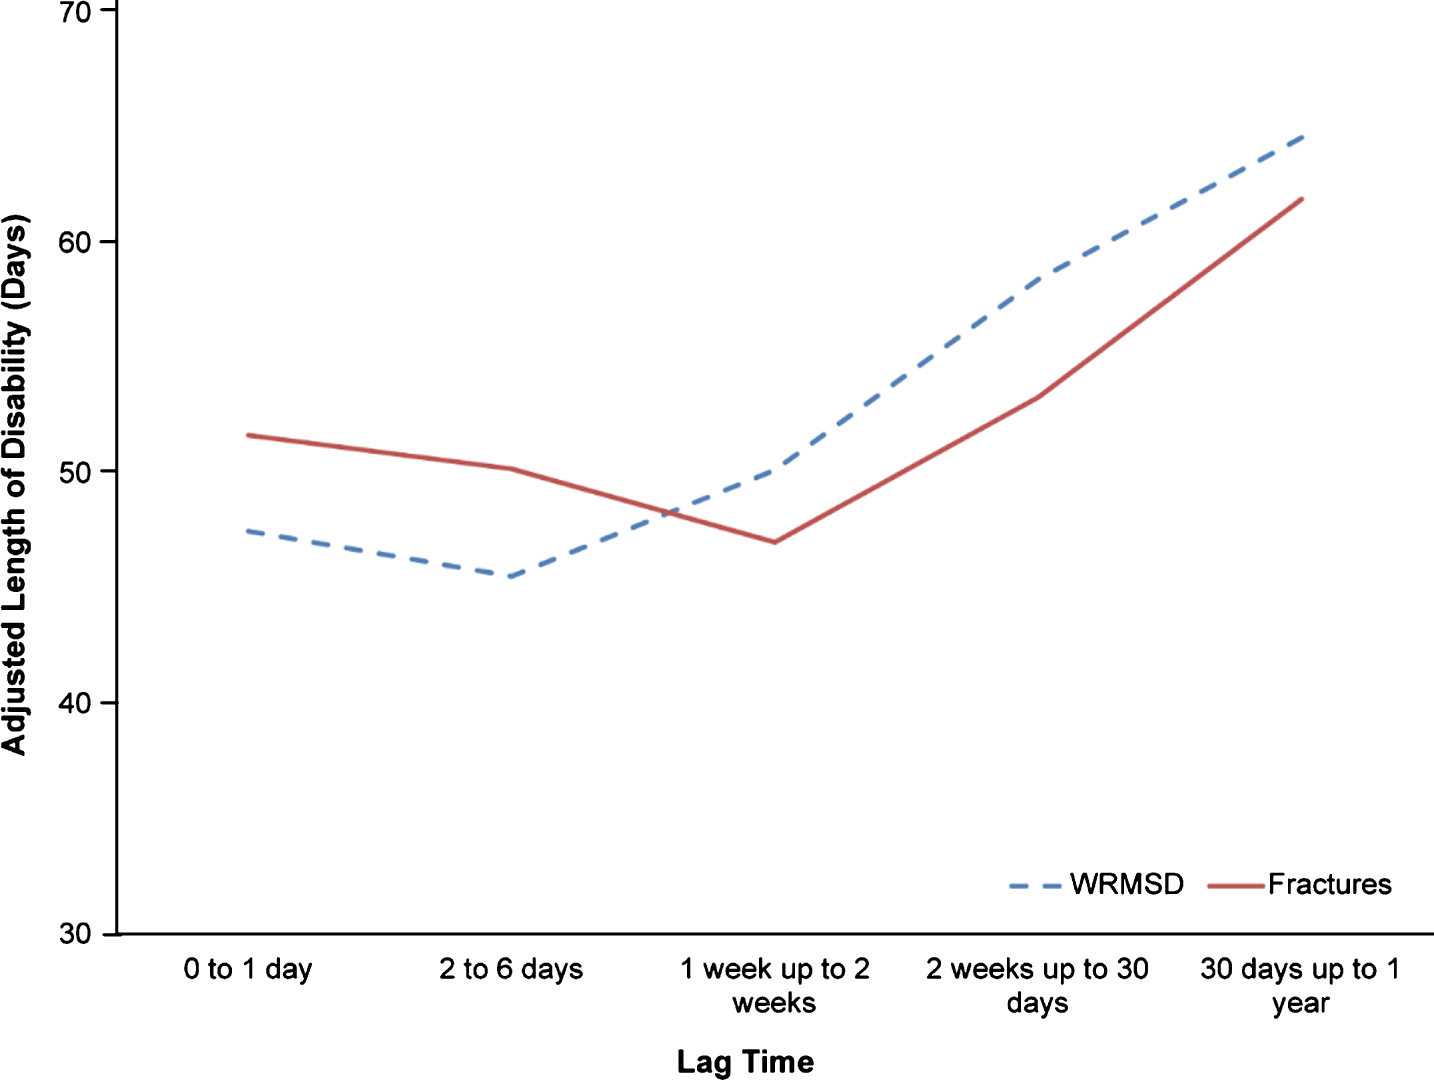
Plot of predicted length of disability in days for the reporting lag time by diagnosis groups.
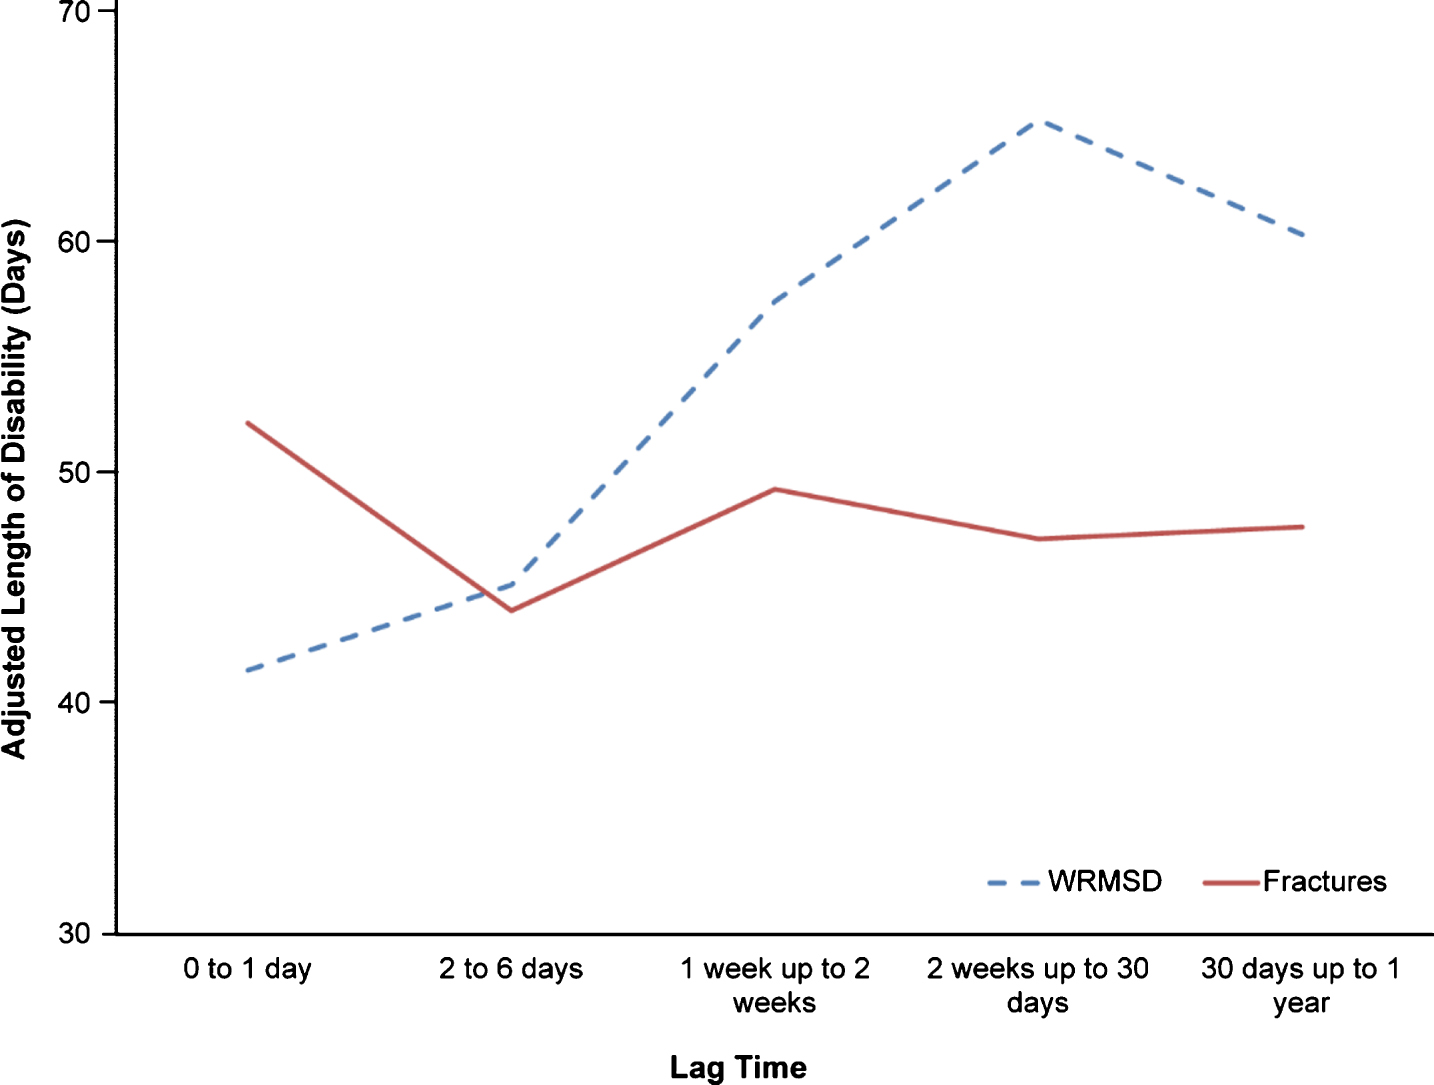
Plot of predicted length of disability in days for the medical services lag time by diagnosis groups.
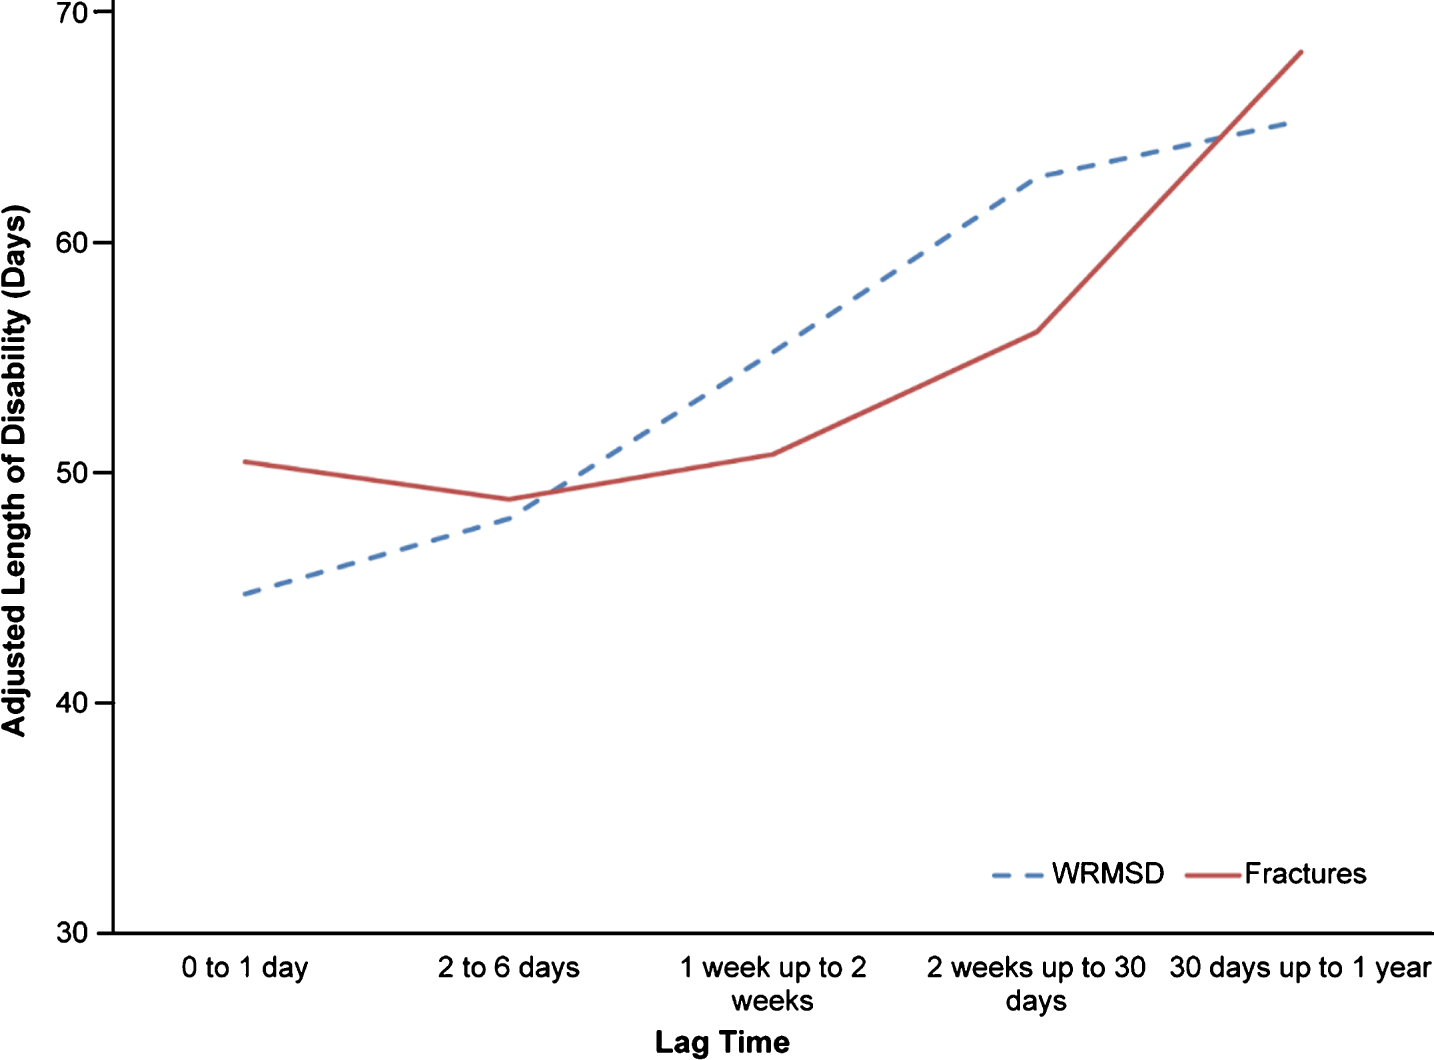
Plot of predicted length of disability in days for the work disability lag time by diagnosis group.
When examining the patterns for the medical services lag time, for both WRMSD and fractures, the aLOD generally increased across the lag time categories. However, for WRMSD, the increase was somewhat incremental across each category, whereas for fractures, there was generally little or no increase across lag times of 0 days to 2 weeks, after which point there was a steep increase in the aLOD up to a lag time of 30 days up to a year. More specifically, as seen in Fig. 3, for WRMSD, the aLOD increased by approximately 3 to 7 days as the lag time categories increased with roughly a 3 week increase in the aLOD from a lag time of less than a week to a lag time of 30 days up to a year. In contrast, for fractures, the aLOD varied very little going from a lag time of 0 to 1 day to a lag time of up to 30 days, however, the lag time then increased by over a week going to a lag time of 30 days up to a year.
For the work disability lag time, shown in Fig. 4, largely different patterns were observed in the two diagnosis groups. For WRMSD, the aLOD generally increased across the lag times up to a lag time of 2 weeks up to 30 days, with over a 20-day difference in the aLOD from a 0 to 1 day lag time to a lag time of 2 weeks up to 30 days, however, the aLOD then decreased by 5 days for the 30 days up to 1 year lag time. In the fractures group, the aLOD was actually the highest for a lag time of 0 to 1 day (52 days) and the lowest for a lag time of 2 to 6 days (44 days), and the aLOD showed little variation across lag time categories thereafter.
For all three types of lag times (i.e., reporting lag time, medical services lag time, and work disability lag time), there was generally greater variation in the aLOD across the different lag time categories for WRMSD than fractures. For WRMSD, the aLOD varied by 19 days for the reporting lag time, by 21 days for the medical services lag time, and by 24 days for the workdisability lag time. In contrast, for fractures, the aLOD varied by 15 days for the reporting lag time, by 19 days for the medical services lag time, and by 8 days for the work disability lag time.
We conducted several additional analyses to further investigate differences in the length of disability by lag time and diagnosis group. First, we conducted sensitivity analyses to assess how the findings may differ when using a more conservative diagnosis group classification of at least 75% of ICD-9 diagnosis codes in the first 15 days being for the respective diagnosis codes. When using the more conservative classification, the sample size was reduced to 52,960 claims. In this reduced sample, the findings remained consistent with those presented in the main analyses.
We also examined how the findings would change if in the fractures group we removed injuries to the hands and fingers (n = 5,461) as these may represent less serious fracture injuries. We found that the interaction findings remained largely consistent. However, the overall differences between the aLOD for WRMSD and fractures increased, with the aLOD being longer for fractures than WRMSD. In the main analyses, the overall aLOD for WRMSD was around 1 to 2 days less than for fractures, whereas that difference was 5 to 6 days in the analyses with injuries to the hands and fingers excluded.
Finally, we explored whether the findings varied based on the litigation status covariate. Specifically, we excluded claims where the workers’ compensation insurer had assigned a lawyer (n = 20,511). Having a lawyer assigned to a claim by the workers’ compensation insurer may be one factor that has the potential to greatly impact how workers move through the work-disability process. For example, a lawyer may be assigned because there are concerns about an injury being work-related or in cases where a claimant has acquired legal representation, both ofwhich may affect the length of disability. As such, this factor could influence the findings in this study. When these cases were removed from the sample, the overall aLOD decreased, however the patterns of differences among the lag times and diagnosis groups remained consistent with those in the main analyses.
Discussion
The current study focused on variation between WRMSD and fractures in the relationship between lag times and length of work disability following a work-related injury. The three lag times included: 1) the time from injury to reporting the injury to the workers’ compensation employer; 2) the time from injury to first receiving medical treatment; and 3) the time from injury to first taking time off of work. It is thought that understanding how diagnosis relates to lag times and length of work disability may assist in identifying claims where additional resources may be necessary to help with the progression through key points in the work-disability process.
Our first research question addressed whether lag times vary by diagnosis grouping. Several differences between WRMSD and fractures emerged. Overall, the shortest lengths of lag were for medical services. Fracture claimants had shorter lags than WRMSD claimants. Only approximately 15% of fracture claimants waited more than a day to seek medical care. In contrast, WRMSD had an average medical services lag time of nearly 2 weeks, with less than half of claimants having a lag time of 0 to 1 days. While previous research is limited, this is somewhat consistent with prior findings. It has been reported that 8% of workers with reported low back injuries did not seek medical treatment within 4 to 16 weeks of the time of injury [17]. Similarly, another study found that approximately 60% of workers with low back injuries sought treatment within 24 hours, whereas 15% sought treatment after 7 days [18].
The findings for the medical services lag times are understandable as fractures are typically acute injuries where workers would most likely know that the injury required immediate treatment [19, 20]. Conversely, WRMSD may represent situations where a claimant may wait a few days or even months to seek medical treatment and report the injury in case theinjury resolves on its own [21]. It is also possible that while fractures represent injuries where immediate medical treatment is necessary in order for the injured person to work, WRMSD, while painful, may not completely prohibit working and thus, workers may delay treatment until they are no longer able to tolerate pain or dysfunction at work. Additionally, work-relatedness of an acute, serious injury (e.g., fracture serious enough to cause time away from work) is likely to be much clearer than for a condition that could develop over time (e.g., WRMSD), where initial treatment might occur in the group health system.
For the reporting lag time, the average lag time for fractures was approximately four days. In contrast, the average reporting lag time was over a week longer for WRMSD. Across both diagnosis groups, the reporting lag time was on average two to three days longer than the lag time for medical services. This suggests that workers may wait to report the injury until after seeking medical care and that the differences across diagnosis groups are reflective of the differences in seeking medical care after injury.
Overall, the commencement of work disability was associated with the longest lag times. Fractures claimants had on average less than a week lag time, whereas WRMSD claimants waited an average of 43 days. It is possible that these findings reflect workers waiting until surgery to take time off work, in that workers with WRMSD may be more likely to have a delayed surgery than workers with fractures. As a result, workers with WRMSD may not need to take time off of work until after surgery, thus increasing the amount of time between injury and paid disability. It has been found previously that some individuals will continue to work until surgery [22–24].
Our second research question addressed whether the lag times relate to the length of disability. Similar to previous research [4–7, 9], we found that for all three types of lag times, the length of disability generally increased as the lag time increased. Across the lag time categories, length of disability increased by 2 to 2.5 weeks. It is possible that these findings reflect injury severity, worse relationships with employers, as well as a lack of resources to facilitate both staying at work and returning to work. It has been found that some workers try to avoid initiating a workers’ compensation claim unless it is absolutely necessary [25, 26]. Similarly, research has shown that some of the reasons given for not filing a workers’ compensation claim include that the injury was not serious enough and that the worker did not expect to take time off of work. This suggests that in cases where workers find that after some time, the injury was more severe than they originally thought and resulted in time off work that they ultimately need to file a claim, thus resulting in delayed reporting [27, 28].
It is also possible that delaying treatment seeking could result in exacerbation of injury, and ultimately, worse outcomes. Although not based on scientific investigation, industry sources describe such a case where delayed reporting and treating of injury resulted in complications with a claim [29]. In our sample, we only included claims where a worker took at least one paid day of disability, meaning we do not have claims where the injury resolved without the worker filing for compensation. In addition, we only have claims where the injury was severe enough to require action after some lag in the work disability process. It is also the case that some workers delay seeking care until they have come to understand that they do not have sufficient resources to manage their condition. Thus, it may be that people with delayed reporting, in general, have more problematic situations than those who report more quickly.
Our third research question examined the variation in the relationship between lag time and the length of disability across WRMSD and fractures. For all three types of lag times (i.e., reporting, medical services, and work disability), the aLOD generally increased as the lag timeincreased for WRMSD claimants. The relationships were different for fractures, where little variation in the aLOD was observed across the shorter reporting and medical services lag times, however, the aLOD was the highest for a lag time of 30 days up to a year for both the reporting and medical services lag times, respectively. When examining differences in the relationship between the work-disability lag and the length of disability, for fractures, the aLOD decreased initially from having a 0 to 1 day lag to a lag of 2 to 6 days and then remained relatively stable thereafter, while for WRMSD, the aLOD increased initially (up to a lag time of 30 days) and then decreased for the longest lag times.
It is possible that the different patterns seen across the diagnoses could be the result of differences in injury severity. For WRMSD, the increase in the aLOD as the three types of lag times increased may be reflective of injury severity with more severe injuries necessitating that workers report these injuries, seek treatment for these injuries, and take time off of work after finding that the injury was too severe to resolve on its own, ultimately resulting in longer disability durations. For fractures, the initial decrease in aLOD for both the reporting and work disability lag times could reflect that more severe fractures were likely to have been immediately responded to by reporting the injury and taking time off of work, whereas for less severe fractures, it may have taken a few days for an individual to realize the nature of the injury and report it. For the medical services lag time, the increase in the aLOD for the longer lag categories in the fracture claimants may reflect complications in a relatively small number of workers, such as a bone not healing correctly, associated with not seeking immediate treatment and instead trying to stay at work.
Implications
Lags in reporting injury, seeking treatment for injury, and taking time off work as a result of injury do not seem to be highly prevalent in fracture claims. In contrast, longer lags were observed for WRMSD, with this being especially true for commencement of work disability. So as to comply with workers’ compensation directives, avoid injury exacerbation and further complications down the line, it is recommended that workers be encouraged by supervisors and managers to respond to these injuries in a timely fashion [30–33]. It is possible that encouraging earlier response to workplace injury may result in more work disability claims, as it would be less likely that injured workers would successfully “tough it out”; however, when individuals ultimately take time off as a result of injury, complications in the work disability process may occur as a result of the delay. In a previous study, it was found that an intervention to encourage early treatment of work-related WRMSD was associated with a greater number of claims, but the claims were less costly, likely a result of treating the injury before it became more problematic [34].
With regards to variation in the relationship between lag times and length of disability based on diagnosis, the results suggest that, for people with fractures, there was relatively little impact on the length of disability. However, for injuries involving WRMSD, lags in reporting are more common and are related to longer lengths of disability. When interpreting this finding, it is important to note that this study is correlational, meaning that it is possible that the same mechanisms causing the longer disability durations may also have been causing the delay in reporting the injury. As such we cannot suggest that earlier reporting of injury would result in shortening the length of disability; however, early reporting of injury is consistent with disability case management guidelines and may help to prevent disruptions in the claims process [35]. Across all diagnoses, waiting more than two weeks to seek medical treatment in the workers’compensation system was problematic, suggesting the importance of receiving prompt medical care. Overall, the patterns observed in the relationships between lag times and length of disability were somewhat different for fractures and WRMSD, suggesting that the mechanisms explaining the role of lag time in disability duration likely differ for these two diagnosis groups. Future research is needed to more fully understand the reason for the relationship between lag times and length of disability.
Strengths and limitations
There were several strengths to the current study including analysis of a large workers’ compensation database with claims representing a range of different diagnoses with workers from various different jurisdictions, industries, organizations, and enterprise sizes. Despite these strengths, there are a number of limitations to consider. First, our sample focused specifically on claimants that had at least one day of paid lost work time. This was done because the outcome measure in our analyses was the length of disability, which requires that people do go out of work at some point, and we also examined the lag time to taking time off work, which again requires that there be lost work time. However, a large number of workers’ compensation claims are for medical treatment only. One of the implications of our findings is that the length of disability may increase as lag times increase, but it is important to note that this is only the case for claims that involve lost work time. It is possible that for medical only claims, waiting longer to receive medical treatment or report the injury may be related to better outcomes, such as lower cost claims. Our sample may be biased to claims that were more severe, as they required time off of work.
A second limitation of this research is that we have no way to identify cases where workers may have sought medical care from their primary care provider, at an onsite clinic, orthrough care covered by private medical insurance before seeking medical treatment covered by workers’ compensation. It is possible that in some cases where there were long medical services lags, it could have resulted from an individual receiving medical care covered by personal health insurance first, which was never ultimately covered under the workers’ compensation system. Our analyses utilized the first date of paid medical care in the workers’ compensation claim file with the assumption that this was the first medical care received, but there is no way for us to verify this. In addition, it is possible that for certain diagnoses, an individual may be more likely to go to their primary care provider first, such as when there has been a previous injury or if there is confusion about whether an injury is work-related, which could bias our results. If this is true, our results suggest that cases that begin treatment outside of the workers’ compensation system and have a delayed shift into workers’ compensation medical care have worse outcomes, suggesting the value of appropriate case allocation and management early on.
Another limitation was in the use of administrative data. While administrative data provides a rich source of data for analyzing the relationship between lag times and the length of disability, there was limited information to explain why there is an actual relationship between the two. We speculate as to the reasons for the relationship, but further research is needed to better understand why lag times are related to disability duration. Also, with our use of administrative data, there is no true measure of return to work. In our calculations of the length of disability, we used the end of indemnity payments for lost work time as a measure of the end of work disability, but the end of paid indemnity does not always coincide with return to work, and there is no way for us to verify whether individuals actually returned to work. Finally in using administrative data, we relied on diagnosis codes that appeared in the first 15 days of the medical records in order to classify individuals into diagnosis groups. In some cases, only onecode may have been present, while in others there could have been more than 25 codes. We classified individuals based on the most prevalent code in the records, but this may have led to bias when comorbidities were present.
Conclusions
Overall, the current study found that workers with fractures had the shorter lag times in the work disability process compared to workers with WRMSD. For both diagnosis groups, lag times of less than a week were generally related to shorter lengths of paid work disability. However, differences in the relationships between lag times and disability duration were found across diagnoses. Our findings suggest the importance of responding to work-related injuries in a timely fashion and taking into account how the work disability process is dependent on the nature of injury.
Conflict of interest
None to report.
Footnotes
Appendix Table 1
Descriptives by Diagnosis Group
| WRMSD | Fractures | Total | |||||
|---|---|---|---|---|---|---|---|
| Mean | SD | Mean | SD | Mean | SD | ||
| Age | 42.5 | 11.4 | 42.0 | 13.3 | 42.4 | 11.9 | |
| Tenure | 7.3 | 8.6 | 7.8 | 5.6 | 6.8 | 8.5 | |
| Income | $36,790 | $35,730 | $34,749 | $37,806 | $36,272 | $36,279 | |
| Number of Unique Diagnoses | 2.1 | 1.4 | 3.0 | 2.5 | 2.3 | 1.8 | |
| Average Number of Times Each Diagnosis Appeared | 3.1 | 2.6 | 4.8 | 3.3 | 3.5 | 2.9 | |
| % | % | % | |||||
| Female | 35.9% | 27.2% | 33.7% | ||||
| Involved in Litigation Industry | 27.9% | 24.3% | 27.0% | ||||
| Manufacturing | 24.7% | 23.3% | 24.3% | ||||
| Mining | 2.4% | 6.9% | 3.6% | ||||
| Construction | 3.2% | 5.4% | 3.7% | ||||
| Agriculture,Forestry and Fishing | 1.1% | 1.5% | 1.2% | ||||
| Transportation | 23.2% | 18.7% | 22.0% | ||||
| Wholesale Trade | 6.5% | 7.6% | 6.8% | ||||
| Retrail Trade | 11.4% | 10.5% | 11.2% | ||||
| Finance and Insurance | 3.9% | 3.2% | 3.7% | ||||
| Services | 22.7% | 22.2% | 22.6% | ||||
| Public Administration | 1.0% | 0.7% | 0.9% | ||||
*WRMSD = Work-Related Musculoskeletal Disorders.
Acknowledgments
We would like to acknowledge the thorough work of Joanna Willetts in retrieving, cleaning, and coding all data for this project. We would also like to thank William Shaw and Larry Hettinger for their helpful feedback in earlier drafts of this manuscript.