
Abstract
BACKGROUND:
In the United States, about 38,000 cases of nonfatal workplace injuries were reported in 2015, in the category of ‘mechanical work’ (plumbing, heating, and air conditioning); this is nearly identical to the number of cases reported under ‘building construction’.
OBJECTIVE:
This paper analyzes the types and rates of injuries and illnesses of mechanical contractors of southern Nevada, including the nature of the injuries and illnesses, body parts affected by injuries, causes of injuries, and factors affecting the injury rates.
METHODS:
To obtain data, a survey consisting of questions regarding the number of injuries and types of injuries was conducted with 31 mechanical contractors of southern Nevada involved in plumbing, piping, heating, refrigeration, and air conditioning.
RESULTS:
The injury rate for larger mechanical contractors (n = 16), in terms of number of employees and annual revenue, was significantly lower than for smaller mechanical contractors (n = 15). Mechanical contractors who worked on residential buildings (n = 13) had significantly higher rates of injuries than those involved with industrial (n = 7) or commercial buildings (n = 10). Results showed that sprains and strains (31%) were dominant injuries, and the major causes were from parts and materials (39%), hand tools (16%), contact with objects (14%), and falls (7%).
CONCLUSIONS:
The study concluded that the injury rate for these mechanical contractors was found to be higher than that reported by the Occupational Safety and Health Administration for specialty trade contractors.
Introduction
In the United States, injuries and illnesses in construction industry remain at alarmingly high rates. In 2015, about 204,700 cases of injuries and illnesses were reported in the construction industry alone; out of this number, about 20% cases were recorded for the construction of buildings only (i.e., residential, commercial, or industrial) [1]. Major work for any type of building construction is handled by mechanical contractors, who are responsible for installing heating, ventilation, and air-conditioning systems. Therefore, mechanical contractors, also called specialty contractors, usually perform work that involve mechanical parts, and employ such specialists as pipe fitters, welders, and plumbers. Based on the Occupational Safety and Health Administration (OSHA), nine industry groups fall under the definition of specialty trade contractors, and one of them is plumbing, heating, and air-conditioning [2]. According to recent data from the U.S. Bureau of Labor Statistics (BLS), in 2015, about 38,000 cases of injuries and illnesses were reported in the category of ‘plumbing, heating, and air-conditioning’ [1]. This indicates that the number of cases of injuries and illnesses for mechanical contractors are closely similar to the numbers for building construction workers (40,500) nationwide.
According to OSHA, ‘injury rate’ is described as the number of injuries per year per 100 full-time employees.’ OSHA defines a recordable work-related injury and/or illness as one that keeps an employee away from working a full shift or prevents an employee from performing all of his or her routine job functions at least once a week. According to OSHA [3], “Restricted work activity limited to the day of injury does not make the case recordable.” This definition excludes minor injuries sustained by employees that are not as serious, and which do not result in lost time or days away from work. The total rate of recordable cases for construction (3.5) was lower than for trade, transportation, and utilities (3.6); goods-producing industries (3.7); and manufacturing (3.8). The BLS data [4–6] showed that overall in 2015, the national occupational injury rate (3.0) decreased when compared to the rates for 2014 (3.2) and 2013 (3.3). This trend indicates that the national injury rate has been decreasing since 2003, when the injury rate was 5.0 per 100 full-time employees, In Nevada, the injury rate in 2015 (3.9) was less than for 2014 (4.1), 2013 (4.1), and 2012 (4.2).
The construction industry includes a wide range of agencies, trades, and disciplines. The BLS breaks down the construction industry into three categories: a) the construction of buildings, b) heavy and civil engineering construction, and c) specialty trade contractors. Under specialty trade contractors, the BLS includes the category of building equipment contractors, under which are the categories i) electrical contractors; ii) plumbing, heating, ventilating, and air-conditioning (HVAC) contractors; and iii) other building equipment contractors. Therefore, the BLS includes the injury rates of mechanical contractors under specialty contractors; therefore, no separate data for injury rates are available for mechanical contractors who are involved in plumbing, heating, ventilation, and air conditioning.
The BLS data shows that the injury rate of specialty contractors decreased from 3.9 per 100 full-time employees in 2012 to 3.7 in 2015 [4–6]. As the total injury rate has been decreasing nationally, the injury rate for specialty contractors also has been decreasing. In Nevada, the injury rate of specialty contractors has decreased since 2013. The injury rate for these contractors was 6.4 in 2013, followed by 5.8 in 2014 and 5.1 in 2015. This data indicates that the injury rate has been decreasing nationally as well as in Nevada; the same is true for specialty contractors, especially for plumbing, heating, and air-conditioning contractors, who are the focus of this study.
According to the 2015 Bureau of Labor Statistics, among specialty trade contractors, the percentage of employees that get injured were: 58% were male and 42% were female; 21% who were less than 35 years of age, and rest (79%) were 35 years of age or older; 35% were white and 65% were non-whites [1].
When the data was divided based on nature of the injury or illness, the highest percentage of employees had sprains and strains (39%), followed by bruises and contusions (9.6%) and fractures (7%). However, the BLS did not provide detailed information about the injury rates of mechanical contractors based on age, race, and sex.
For this study, it was important to determine whether the high injury rate for specialty trade contractors was largely contributed by mechanical contractors, and it was necessary to determine the injury rates for mechanical contractors based on age, race, and sex. Therefore, this study analyzed recordable injuries and illnesses as well as minor injuries incurred by mechanical contractors in southern Nevada, and all the data were collected directly from the mechanical contractors. These data included OSHA recordable injuries as well as those injuries that were not reported to OSHA.
Literature review
The types of injuries, and the relationship between the injury rate and the firm’s size as well as the employees’ race, age, and sex always has been a topic of interest for safety engineers. BLS provides data of OSHA recordable injuries for every year and for various types of trades; however, these data only reflect the data that was provided to OSHA by employers.
A study by the Center for Construction Research and Training (CPWR), found that in 2010, specialty contractors had the maximum number of injuries as compared to building construction and heavy civil engineering [7]. Out of 74,950 injuries that occurred, 69% were for specialty contractors, followed by 18% and 13% in building construction and heavy civil engineering, respectively. This indicates that specialty trade contractors was a high-risk group for work-related injuries and illnesses.
Some researchers have used surveys to gather data from the employers in order to determine the types and reasons for these types of fatalities and injuries. In Ethiopia, Tadesse and Israel [8] recently studied the relationship among injury rates, the use of personal protective equipment (PPE), and work experience. They found that the fatalities were significantly higher when the workers did not wear PPE and also when they had less than two years of construction experience. The occurrence of fatalities in construction also depended upon the types of the buildings and the specialty trade. Hatipkarasulu [9] analyzed investigation reports of OSHA accidents in 2008, and found that construction of residential buildings had a highest percentage of fatalities (34%) compared to other construction types, such as commercial (25%), heavy civil (8%), and industrial (8%). The study also found that the roofing trade had the highest number of fatalities (16%), followed by carpentry (11%); excavation (9%); and plumbing, heating, and air conditioning (7%). Melia [10] suggested that the risk of accidents at construction sites could be reduced if the supervisor and the workers had a positive approach to a safety response in order to create safe environments.
In addition, injury rates have been correlated with the types and size of the firms. Hinze [11] reported that private firms had better safety records than did public companies. In addition, injury rates increased with an increase in the firm’s size to a certain limit; after that limit, the injury rate leveled off, and no longer increased with firm size. For 2015, BLS data showed that up to a certain point, the injury rate increased as the firm size increased, and then it started decreasing [1]. The injury rates of private firms with 1–10 employees, 11–49 employees, and 50–249 employees were 1.4, 2.8, and 3.7, respectively. However, the injury rates of private firms having 250–999 employees and more than 1,000 employees was 3.3 [1]. In contrast, Mendeloff et al. ([12] concluded that the smallest firms were most likely the riskiest in terms of fatalities. In addition to this, Rodrigues et al. [13] found that accident rates in construction were correlated with such factors as the financial capacity of the firms, safety policies, and early planning for the contractor in the project.
A study by Everett [14] on the types of injuries revealed that all construction activities had high rates of overexertion injuries. According to this author, the term ‘overexertion’ referred to “cumulative trauma disorders, repetitive motion injuries, repetitive stress injuries, musculoskeletal disorders, and ergonomic injuries.” In a study by Hinze et al. [15], data about of 135,998 construction worker injuries showed that the most frequent injuries were lacerations to fingers and hands (24%); lumbar spine injuries, including back pain (13%); upper extremity injuries, including fingers and hand concussions; wrist and finger sprains, joint pain, and crushing injuries (11%); and eye injuries involving abrasions, inflammation, or scratches due to foreign bodies (11%). When these data were compared with injury data of other industries, it was found that construction workers had a significantly higher rate of lacerations and eye injuries. However, other industries had significantly higher rates of lumbar spine injuries and upper extremity injuries compared to the construction industry. When these data were analyzed based on the gender of the workers, it was found that male workers suffered higher rates of lacerations and eye injuries than did female workers. However, according to Hinze et al., female workers “… were more likely to suffer upper extremity injuries…”. The authors mentioned that these findings might be attributed to the differences in craft functions. They also noted a correlation between injuries and age, in that “…younger workers were more likely to have lacerations and eye injuries than older workers…”, particularly men under the age of 35 years.
According to Fredericks et al. [16], mechanical contractors in Michigan had recorded sprains and strains as the most common types of injuries during construction projects. The body part most frequently affected was the trunk, more specifically, the back. The most common source of injuries and illnesses was parts and materials, and the most frequent cause of fatalities was falls. They also found that eye injuries frequently were caused by metal shavings due to grinding and welding metals. Most injuries and illnesses to the fingers and hands were attributed to sheet-metal cuts. The most common back injuries and illnesses were due to handling pipes and valves.
A survey by Jebens et al. [17] of Norwegian construction employees who did mechanical work found that the level of musculoskeletal pain was higher in middle-aged workers (30 to 50 years) and senior employees (over 50 years) compared to younger workers (less than 30 years). Hinze and Gambatese [18] conducted a study with 46 Nevada specialty contractors, 35 roofing contractors, and 39 large mechanical contractors. They found that the median injury rate for specialty contractors in Nevada was 11.5 per 100 full-time workers, while the industry average of the OSHA recordable injury rate in 2000 was 8.5 [18]. The median injury rate for roofing contractors was 12.2 compared to OSHA’s 10.9. For recordable injuries in plumbing, heating, and air-conditioning, the authors found that the median injury rate for mechanical contractors was 9.6 compared to the industry average of OSHA (9.2). For Nevada specialty contractors, the injury rates were lower than for larger firms.
Sheet metal workers also fall under the category of ‘specialty contractors’, based on the OSHA definition for this category. These workers are involved in roofing, air-conditioning, ventilation, and heating systems of buildings. Studies found that these workers had the highest risk for musculoskeletal disorders (MSDs) and for permanent work disabilities [19–21]. West et al. [19] found that MSD was the leading cause of disabilities for sheet metal workers. The study found that a significantly higher proportion (47.2%) of those on permanent disability among sheet metal workers was due to MSDs. They also found that for sheet metal workers, permanent disabilities were caused by injuries to the spine, shoulder, and knee [19]. Moreover, Dale et al. [20] found that one of the reasons that sheet workers had MSD was that they “spent large proportions of their time in awkward shoulder elevations and low back rotation process” [20]. Welch et al. [21] found that sheet metal workers who hung ductworks had a significantly higher chance of having neck and shoulders problems.
Objectives
Based on the literature review, gaps were identified regarding a comprehensive study of injuries and illnesses sustained by mechanical contractors involved in plumbing, piping, heating, refrigeration, and air conditioning. This research focused on analyzing the injury rates of those contractors of southern Nevada. The main objectives of this study were to: Identify and analyze the nature of injuries and illnesses, body parts affected, and causes of injuries to mechanical contractors of southern Nevada; Determine whether the percentage of the nature of injuries and illnesses, the body parts affected, and the injury rates were significantly different among various categories based, on employer and employee characteristics; and Determine the correlation between overall injury rates and the percentage of employees who have taken OSHA’s 10-hour safety training course.
Methods
In this current study, injury data were collected of mechanical contractors in southern Nevada who specialized in three categories: 1) plumbing, 2) heating and HVAC; and 3) utilities (plumbing plus HVAC). To collect the injury data, a questionnaire survey was designed that grouped respondents by employer characteristics as well as by employee characteristics. The employer characteristics defined each respondent by type of contractor, the type of work performed, the company’s annual revenue, and the number of employees. The questionnaire collected data related to employer characteristics, including ethnicity and age, as well as the number of injuries per employer, as defined by the BLS dataset. (During the data collection phase, one of the authors of this paper was working in a mechanical contractor firm in southern Nevada.) After the questionnaire was prepared, it was sent to three mechanical contractors for review. Based on the feedback from these contractors, the final questionnaire was prepared.
In addition, the questionnaire collected information on the severity of such injuries as minor injuries as well as injuries resulting in hospitalization or death. The nature of the injuries and illnesses, the body parts affected, and the causes of injuries were collected as well. Upon reviewing the existing scholarly literature regarding occupational injuries for specialty contractors, eye injuries and fall injuries were prominent, and required special attention. Therefore, questions were included regarding 1) eye injuries with and without the use of eye protection and 2) fall injuries. Finally, questions related to the causes of injuries, actions taken, and whether the injured employees had taken the OSHA 10-hour safety training course were included in the questionnaire. The authors did not collect the OSHA reporting data nor the injury claim data from the respondents, because the outcome would be similar to the BLS injury data. The intention of authors was to collect injury data of the respondents that included both the data that were reported and also not reported to OSHA. This would help to determine whether the actual injury rate was different from that which was reported to OSHA.
Respondents were limited to mechanical contractors working in southern Nevada, specifically those located in the cities of Las Vegas and Henderson. A total of 71 mechanical contractors were identified, and invited to participate in this study. The contractors were selected from a list found in the website of the Mechanical Contractors Association of America (MCAA), the Associated General Contractors (Las Vegas Chapter), and the website for the United Association (UA) Local 525. Supplemental contractors were found using a Google database search for Las Vegas and Henderson. Out of 71 contractors, 31 responded the survey, yielding a 44% response rate.
The data was analyzed based on descriptive statistics and by using parametric statistical tests. The characteristics of the firms, the nature of the injuries and illnesses, the body parts affected, and the causes of injuries and illnesses were analyzed using descriptive statistics. The Analysis of Variance (ANOVA) test was used to determine the difference in percentages of the nature of injuries and illnesses, body parts affected, and the means of the rates for the types of injuries in mechanical contractors, based on employer and employee characteristics. The employer and employee characteristics analyzed in this study were the number of employees, annual revenue, the age of the employees, the ethnicity of the employees, the type of work, and the type of contractor. To conduct the ANOVA test, the research hypotheses needed to be converted to null hypotheses. For this study, the null hypothesis was that the means for the nature of injuries and illnesses, body parts affected, and the overall injury rates were equal for these groups. The null hypothesis could be expressed mathematically as:
where μ= the population mean, i = the first group based on characteristics and j = the second group based on characteristics.
For the null hypothesis to be false, the p value should be less than or equal to 0.05. If the p value was within the range of 0.01 to 0.05, then the difference in mean values was considered to be significant. If the p value was equal or less than 0.01, then the difference in the mean values was considered to be highly significant.
The Pearson correlation test was conducted to determine the correlation between the overall injury rate and the percentage of employees who took the OSHA 10-hour safety training course. For this test, the null hypothesis was that the correlation coefficient between the overall injury rate and the percentage of employees who took OSHA safety training course was not significantly different from zero. For the null hypothesis to be false, the p value should be less than or equal to 0.05.
For this study, the survey questionnaires were sent to most of the mechanical contractors available in southern Nevada, and the responses were received randomly. The dependent variables, which were the various types of injury rates, were in a ratio scale. The data distribution was assumed to be normal, because according to the Central Limit theorem, if the sample size was above 30, the population distribution would be roughly bell-shaped [22].
To check whether the variance of the groups was equal based on various contractor’s characteristics, statistics from Levene’s test were calculated, using the Statistical Package for Social Science (SPSS). Results showed that the types of injury based on number of employees, annual revenue, and contractor types had an unequal variance because the p value was greater than 0.05. However, the injury types based on the average age of the employee, ethnicity, and type of work did have equal variance because the p value was greater than 0.05. Table 1 shows the results of this variance test conducted for total injury rate based on six major sub-categories. The test results showed that the variance of the injury rate – categorized based on the number of employees, annual revenue, and the type of contractor – rejected the null hypothesis, indicating that the variance of the groups was not equal. Therefore, it was necessary to conduct the Welch test
– which is conducted when the variance of dependent variables was not equal in two or more groups – in SPSS to compare the means based on these three categories.
Results of the variance test (n = 31)
*Significant at alpha level 0.05.
Demographics for surveyed mechanical contractors (n = 31)
The data were received from 31 mechanical contractors. The data received were first analyzed using descriptive statistics. Then, ANOVA and Pearson correlation tests were conducted to determine the statistical significance values. The findings of these analysis are described below.
Descriptive statistics
The mechanical contractors who responded the survey reported 2,522 employees and 224 injuries. Table 2 shows the demographic of these mechanical contractors. Out of 31 respondents, 59% of the companies had a minimum of 22 employees, and the annual revenue of the contractors ranged from $0.18 million to $425 million. However, only 12 contractors reported the annual revenue of their companies, with half of these respondents having an annual revenue below $5 million and half having $5 million and above. Results of the data analysis showed that there was twice the number of companies whose employees had a mean average age of 35 years than companies with employees whose mean average age was less than 35 years. Regarding the ethnicity of employees, about half of the responding contractors reported that more than 50% of their staff were white. Regarding the type of work, 43% specialized in plumbing/HVAC, 33% in HVAC only, and 24% in plumbing only. Most contractors worked in residential buildings (43%), followed by commercial buildings (33%) and industrial buildings (24%).
The descriptive statistics were used to report the nature of the injuries and illnesses, the body parts affected by injuries, the causes of injuries and illnesses, the causes of eye injuries, and the party at fault. These are described as follows.
Nature of injuries and illnesses
The data were analyzed based on the nature of seven types of injuries and illnesses, as shown in Fig. 1. The percentage distribution of the various types of injuries and illnesses for 224 injuries also are shown in Fig. 1. No fatal injuries were reported by any of the contractors. The results showed that the top two most prominent injuries occurring among mechanical contractors were sprains and strains (31%) and cut and lacerations (27%). More than half of the injuries reported belonged to these groups. About 20% of the respondents mentioned that the nature of their injury and illnesses was ‘Other’; for this category, the respondents stated that the nature of injuries included as soreness, eye injuries, loss of hearing, and toxic exposure. The remaining 22% of injuries were related to bruises and contusions, fractures, punctures, burns, amputations, and trauma.
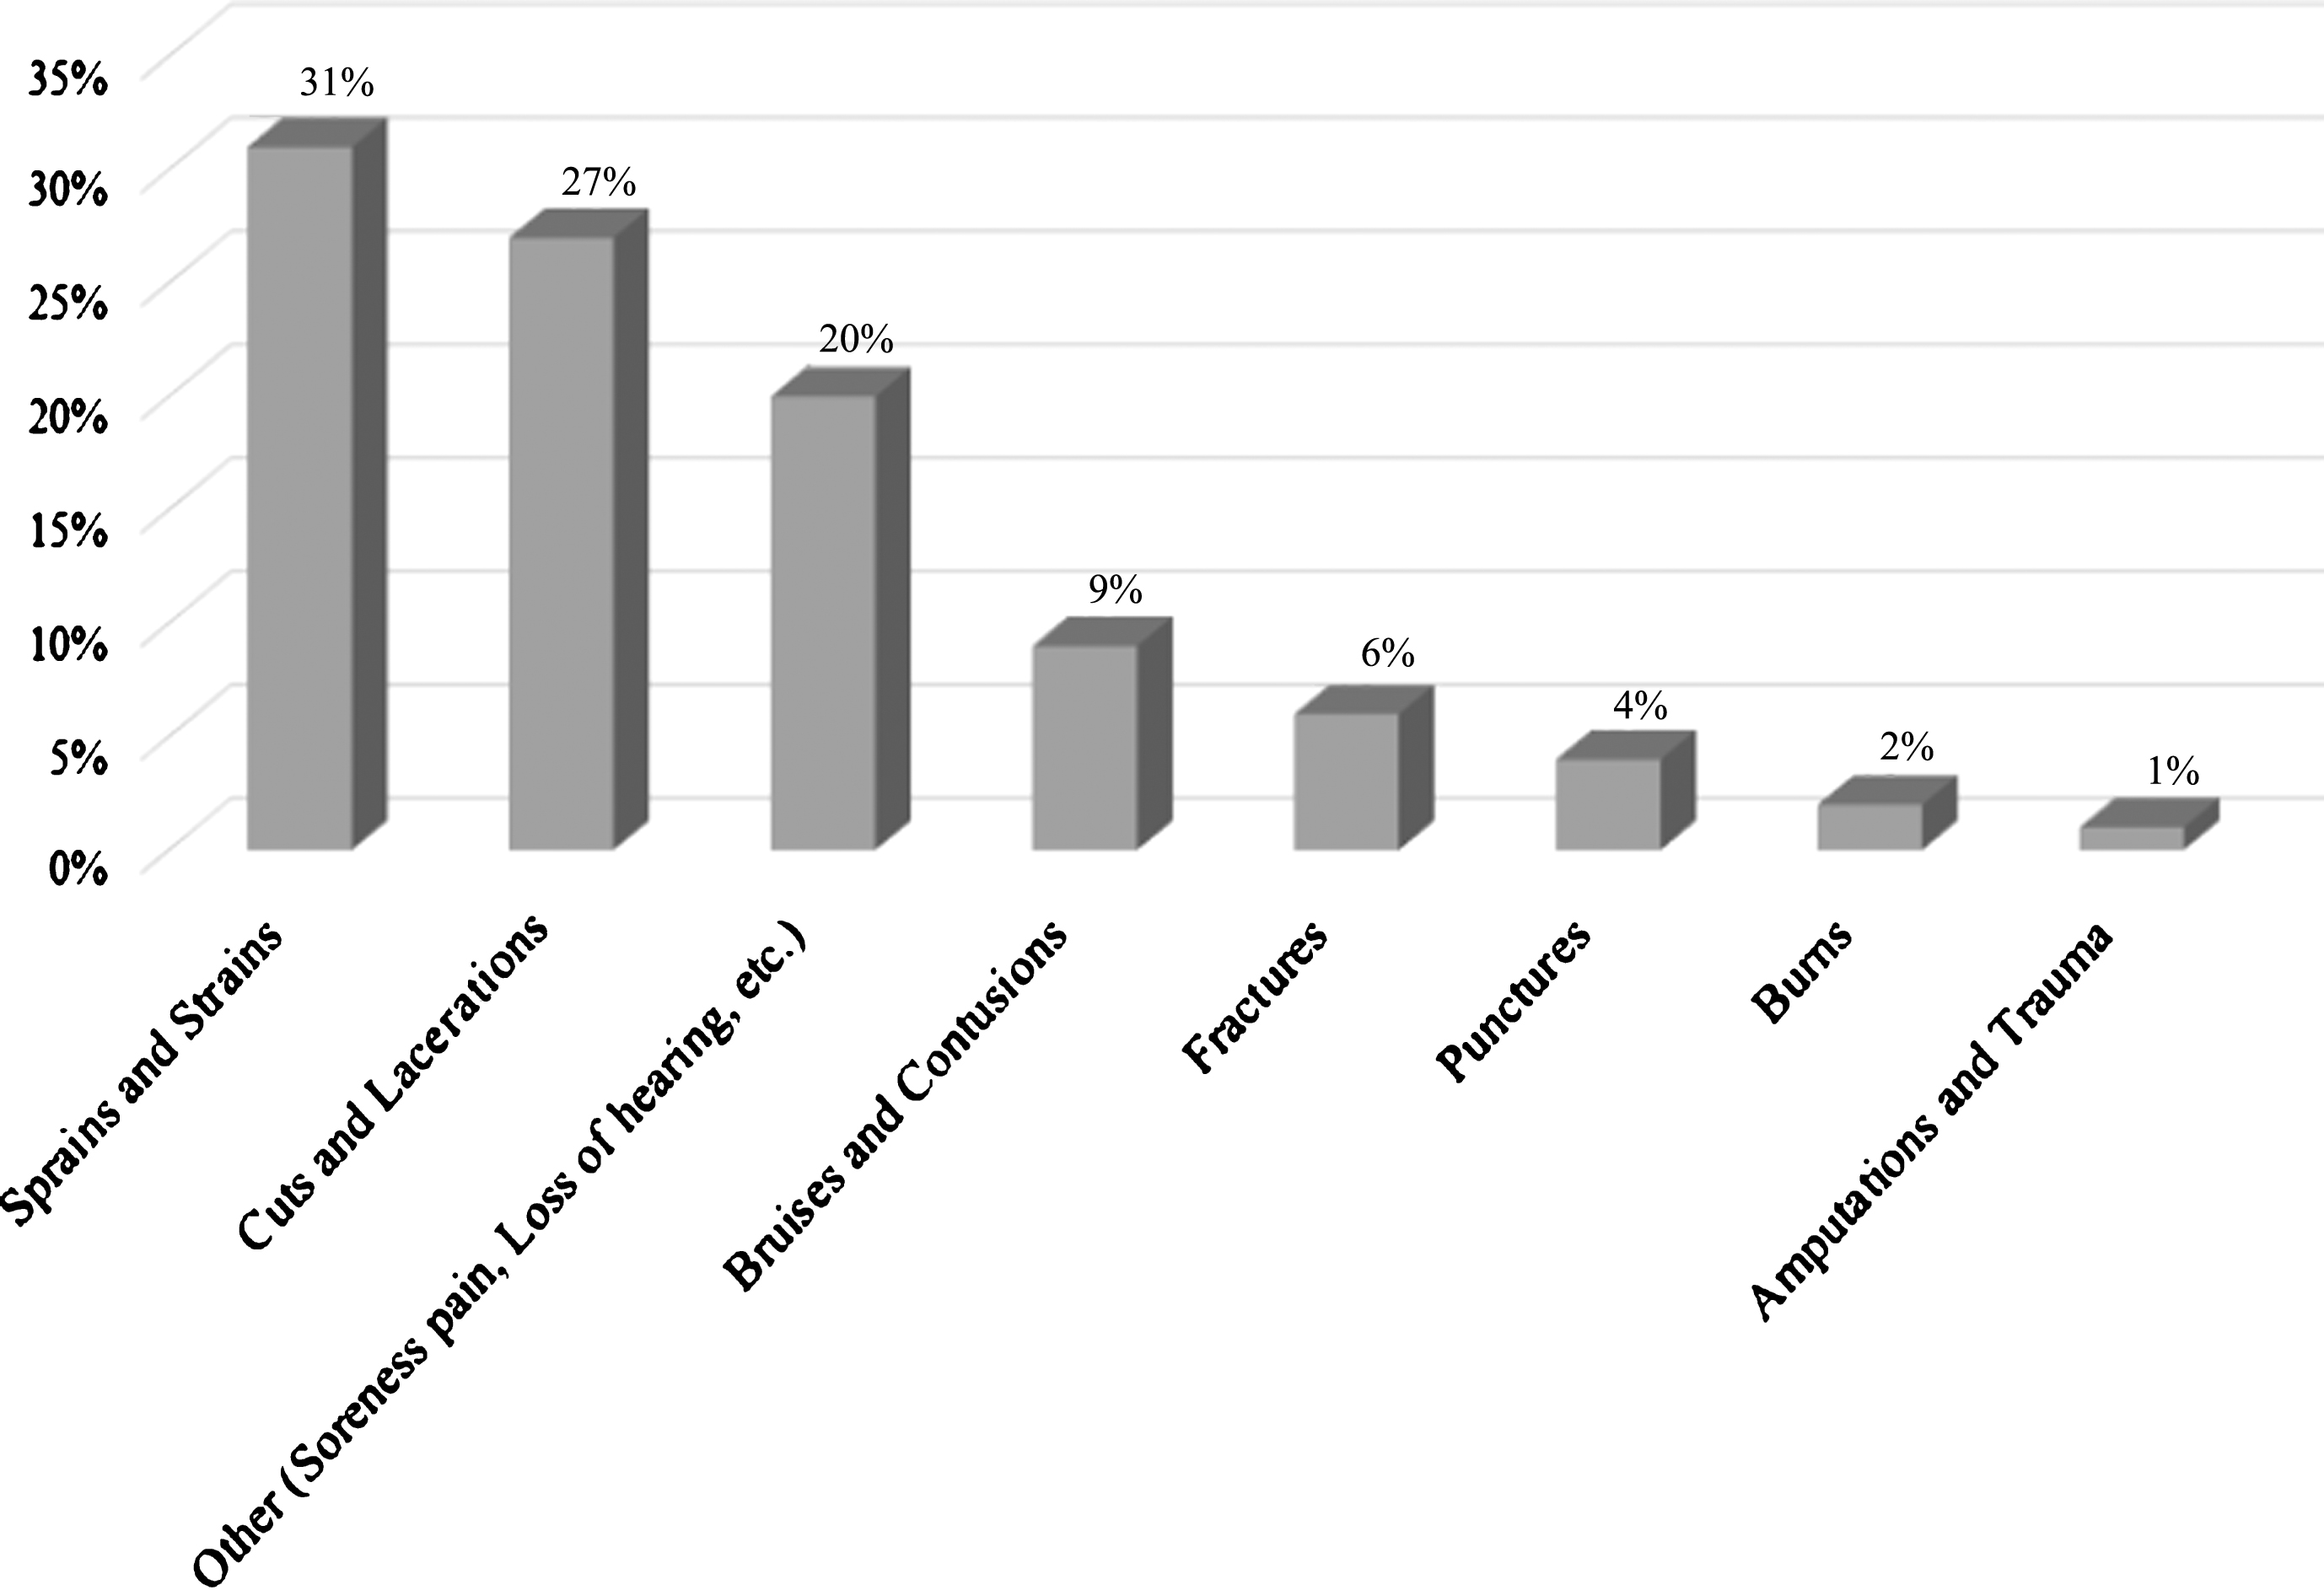
Percentage of the nature of injuries and illnesses for mechanical contractors (n = 31).
Percentage of body parts affected for mechanical contractors (n = 31).
Percentage of the causes of injuries and illnesses for mechanical contractors (n = 31).
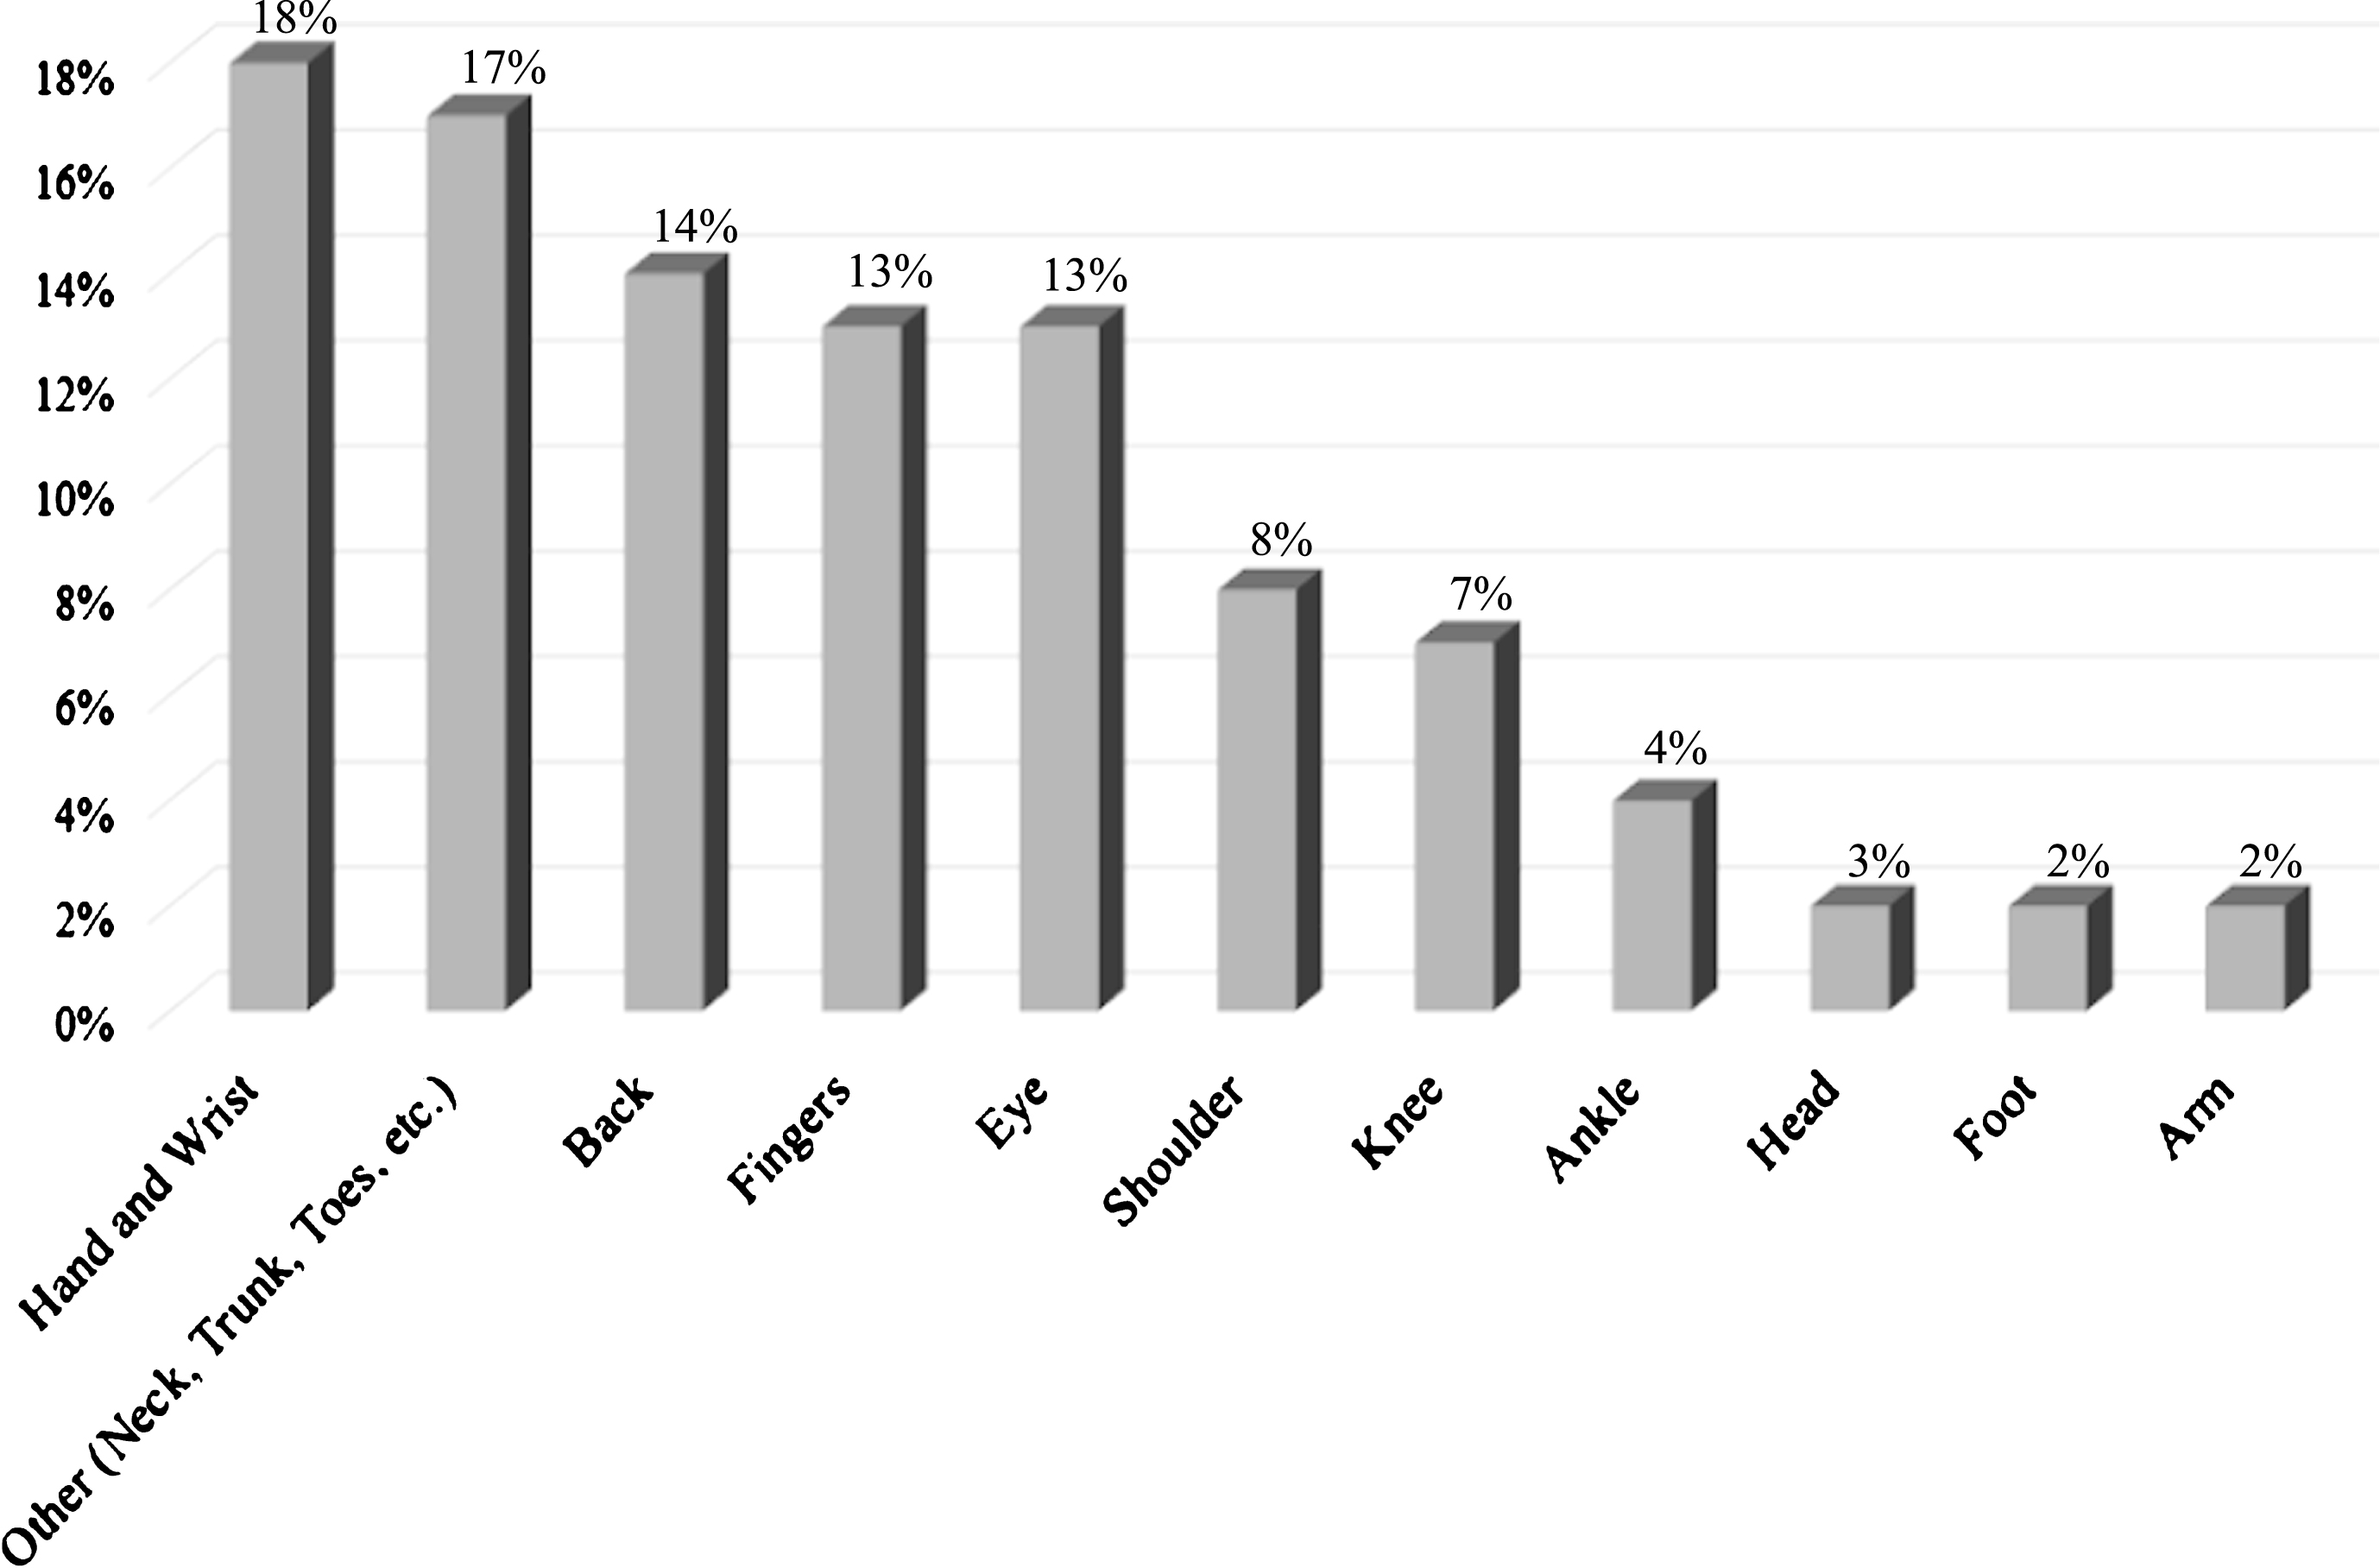
The injury data were analyzed based on the body parts affected by the injuries, and the results are shown in Fig. 2. This study found that mechanical construction workers at job sites were most likely to injure parts of their hands, including fingers, wrists, hands, as well as their backs. Of these injuries, about 31% of the injuries were related to parts of their hands. The second largest category for body parts was ‘Other’ (17%), and included the neck, trunk, upper and lower extremities, and toes. The percentage of injuries for the back and the eyes were 14% and 13%, respectively. Similarly, the remaining 25% of body parts affected was the shoulder, knee, ankle, head, foot, and arm.
Causes of injuries and illnesses
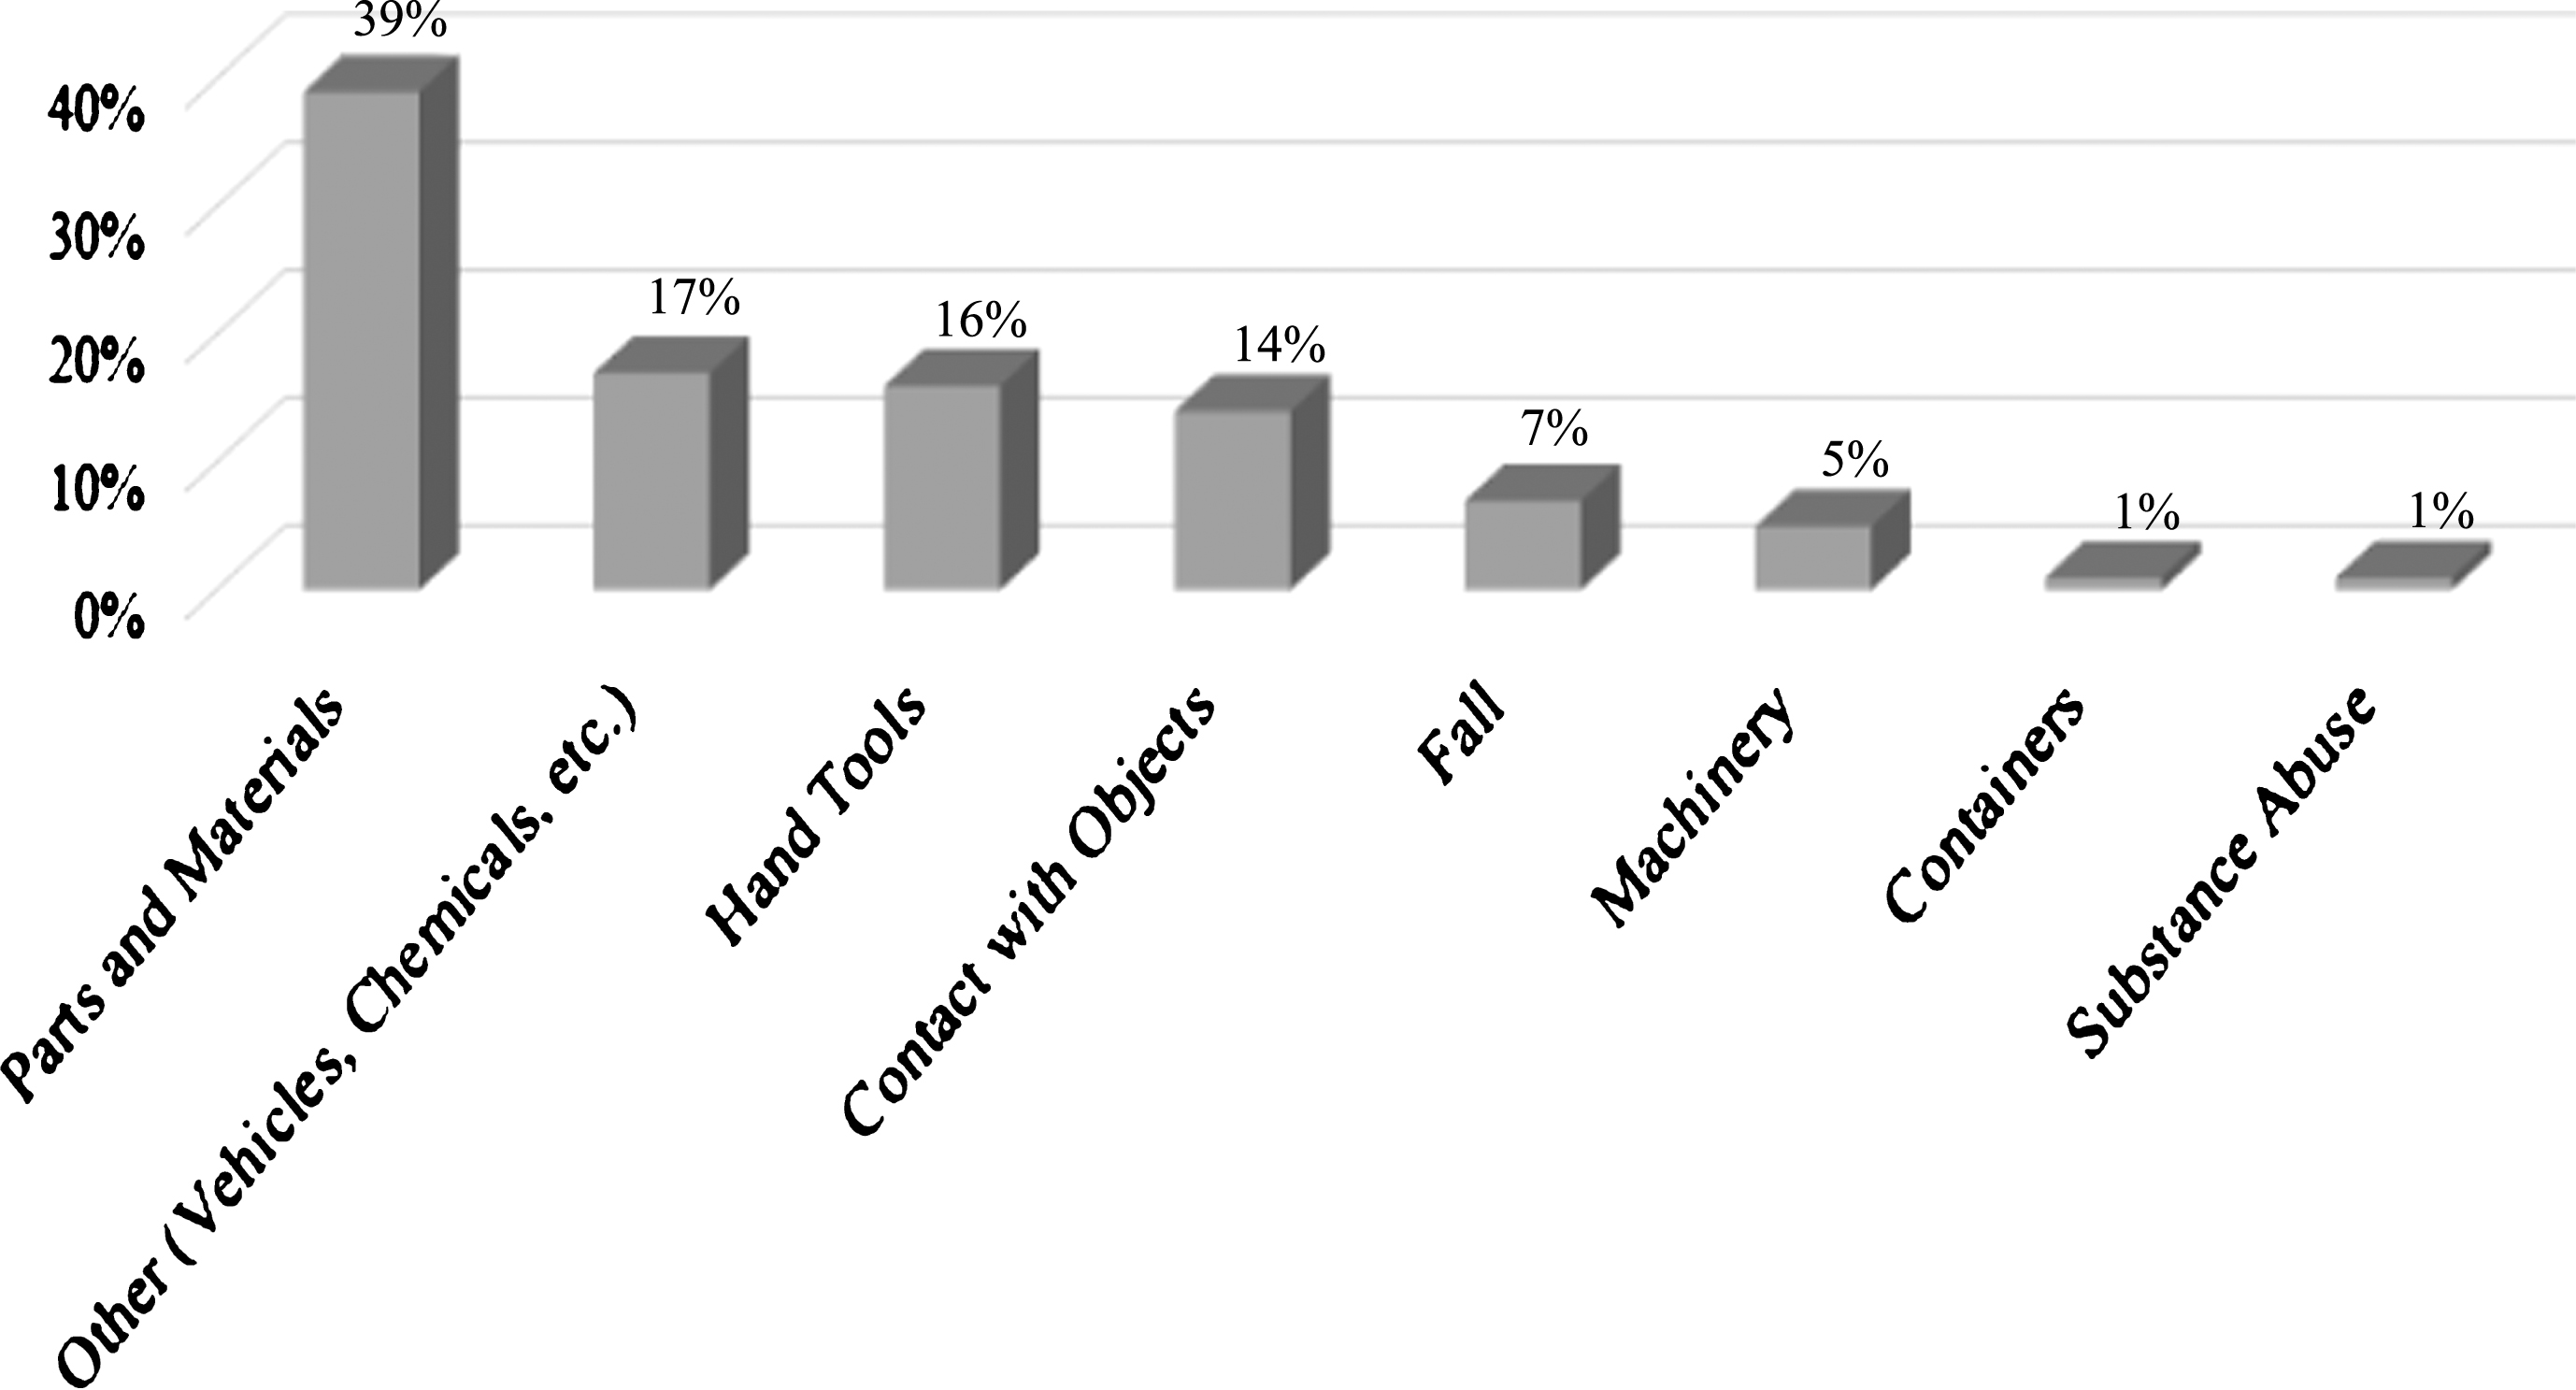
In this study, seven major causes of injuries and illnesses were identified, as shown in Fig. 3. The main three significant causes of injuries and illnesses were a) parts and materials (39%), b) hand tools (16%), c) contact with objects (14%), and d) falls (7%). The most common cause of injuries and illnesses for all categories was parts and materials. Fredericks et al. [16] showed that the most common causes of injuries and illness for mechanical workers were parts and materials as well as falls; other causes were eye injuries due to metal shavings, finger and hand injuries due to sheet metal cuts, and back injuries due to handling pipes and valves. BLS data showed that the major causes of injuries to plumbers, pipefitters, and steamfitters were burns from the equipment, cuts from the tools, and falls from ladders [23]. The category of others (17%) includes causes related to vehicles, ladders, furniture fixtures, chemical products, etc. The remaining 7% of causes of injuries were related to machinery, containers, and substance abuse.
Table 3 summarizes the distribution of the nature of injuries and illnesses, body parts affected, and causes of injuries and illnesses based on the size of the contractors. The table clearly indicates that most of the injuries were sustained by large contractors in each category. Regarding body parts affected, the large contractors contributed the majority in each category. Similarly, in the category of ‘Causes of Injuries and Illness’, large contractors had the largest percentage in each types of causes. Therefore, the higher number of injuries occurred with large contractors compared to small contractors.
Distribution of the nature and causes of injuries and illnesses as well as body parts affected based on contractors’ size (n = 31)
Distribution of the nature and causes of injuries and illnesses as well as body parts affected based on contractors’ size (n = 31)
Eye injuries accounted for 29 of 224 injuries (13%). Utility installers and commercial contractors reported a large number of eye injuries; specifically, they reported that foreign debris was the main cause of eye injuries. These participants were asked whether they were using any eye protection when the injuries were occurred; the data analysis suggested that the employees received eye injuries even though they used glasses or goggles. In addition, the data showed that out of 29 eye injuries, 59% of the injuries occurred while employees were wearing glasses; 34% injuries occurred when they did not wear any eye protection; and 7% of the injuries occurred while wearing goggles.
Party at fault
When the respondents were asked about the party at fault, of the 27 contractors who responded to this question, around 53% stated that the main party at fault was the employee, 28% stated that they did not know who was at fault, 11% responded that neither party was at fault, and 8% stated that it was the fault of the employers. This study also examined the actions taken by the employer with respect to the injured employees. Out of 27 mechanical contractors, 92% stated that the employees already were OSHA-trained; however, in most cases, the injured employees were sent to enroll to an OSHA safety-training course after the injury. In particular, plumbing workers reported that more than one-third of their employees were fired as a result of a fault for an injury.
Analysis of variance test results
The analysis of variance (ANOVA) test was conducted to determine a statistical difference between the nature of injuries and illnesses, the body parts affected, and injury rates among six characteristics of the contractors: 1) the number of employees, 2) the annual revenue, 3) the average age of the employees, 4) ethnicity, 5) the type of work, and 6) the type of contractor. The findings of these tests are described below.
The sample size of these tests, based on the above categories, varied from 6 to 16 in each group. Therefore, the power of the analysis was calculated for the test that had the least sample size (6); in other words, the injury rate was based on annual revenue. Using software for a sample-size calculator that was available online [24], it was found that the power associated with this sample size was 80%.
ANOVA results for the nature of injuries and illnesses
Table 4 shows the results of the ANOVA tests about the mean difference for the nature of the injury/illness based on the six categories. Results showed that there was no significant difference in the percentage of sprains/strains, cuts, and lacerations, punctures, fractures, burns, traumatic injuries, and amputations among these two groups based on all six categories. The p value was found to be greater than 0.05 for all these categories.
ANOVA results for the nature of the injuries and illnesses for mechanical contractors by various subcategories (n = 31)
ANOVA results for the nature of the injuries and illnesses for mechanical contractors by various subcategories (n = 31)
1ANOVA test with equal variance.
2 ANOVA test with unequal variance (Welch Test). Note: None of these categories group differences were found to be significant at alpha level 0.05.
The ANOVA tests were conducted to determine whether the type of work and the type of contractor resulted in significantly different percentages of the body parts injured. However, the analysis was not conducted for the rest of the categories (i.e., the number of employees, annual revenue, the average age of the employees, and ethnicity). This is because body parts affected by injuries generally are dependent on the type of work and the type of contractor. Test results showed there was no significant difference in the percentage of body parts affected by injuries among mechanical contractors based on the type of work and the type of contractor (Table 5). The p values for both of these categories were found to be greater than 0.05.
ANOVA results of the body parts affected for mechanical contractors by the type of work and type of contractor (n = 31)
ANOVA results of the body parts affected for mechanical contractors by the type of work and type of contractor (n = 31)
1 ANOVA test with equal variance.
2 ANOVA test with unequal variance (Welch Test). Note: None of these categories group differences were found to be significant at alpha level 0.05.
The ANOVA test was conducted to determine whether the overall injury rate for each of the groups in these six categories was significantly different from each other. The ANOVA test result showed that the larger contractors, those having more than 22 employees or an annual revenue more than $5 million, had significantly less injury rates compared to smaller companies with less than 22 employees or an annual revenue less than $5 million (Table 6). The test results showed that the injury rates of contractors who worked in residential buildings were significantly higher than for contractors that worked in industrial and commercial buildings. For the other three categories (average age of the employees, ethnicity, and the type of work), the difference in injury rates was not significant at alpha level 0.05.
ANOVA results of injury rates for mechanical contractors by various categories (n = 31)
ANOVA results of injury rates for mechanical contractors by various categories (n = 31)
*Note: Significant at alpha level 0.05.
** Significant at alpha level 0.01.
1 ANOVA test with equal variance.
1 ANOVA test with unequal variance (Welch Test).
In addition, the Pearson correlation test was conducted to determine the association between the injury rate and the OSHA safety training course taken by employees. Result showed that there was no significant correlation between the injury rate and the number of employees who had OSHA safety training.
This study found that the two most common types of injuries and illnesses for mechanical contractors were sprains and strains as well as cuts and lacerations. More than half of the injuries and illnesses reported by the mechanical contractors fell into these categories. The reason for sprains and strains may be attributed to the fact that mechanical contractors worked more with handling heavy equipment. Fredericks et al. [16] showed that in Michigan, sprains and strains were common injuries and illnesses for mechanical contractors. The U.S. Bureau of Labor Statistics showed that the most common form of injuries to plumbers, pipefitters, and steamfitters were burns from hot pipes and soldering equipment as well as cuts from sharp tools [23]. The findings of the types of injuries and illnesses for mechanical contractors could not be compared to BLS data, because BLS did not provide the distribution of the types of injuries and illnesses for specialty trade contractors.
The survey results showed that injuries to workers for mechanical contractors mostly were to the hand, wrist, finger, eye, shoulder, and knee. About 59% of the injuries reported by these mechanical contractors were related to these body parts. The injured workers also stated that eye injuries occurred while they were using glasses or goggles. In addition, for mechanical workers in Michigan, Fredericks et al. [16] showed that the body parts that were most commonly affected were the back, eye, fingers, and hands. These results for the distribution of injured body parts with mechanical workers were supported by the BLS dataset. According to BLS [25], the back was the most frequently injured body part (23% of the total body parts injured), and the second most frequent were hand and wrist injuries (8%). In addition to this, eyes and fingers were frequently injured body parts, while the arm, ankle, foot, and toes were not injured as frequently. When injuries to these body parts were analyzed based on the type of work and the type of contractors, there was no significant difference found between these groups of contractors. Data regarding the body parts affected could not be compared with BLS data at the national level because the data for specialty trade contractors were not provided by BLS.
This study identified seven major causes of injuries. Based on the frequency of the injuries recorded, the top five major causes were parts and materials, hand tools, contact with objects, falls, and machinery. Shrestha et al. [26] found that falls were a major cause of injury in construction work. Similarly, Fredericks et al. [16] showed that parts and materials, falls, and metal shavings were frequent causes of injuries. A study conducted by Menzel and Shrestha [27] recommended providing more regulatory oversight of employers by OSHA to ensure that employers were providing the required training for safe work practices and safety equipment; they also suggested providing effective OSHA training in the language of their workers. Shrestha and Menzel [28] indicated that OSHA training improved the workers’ knowledge on fall prevention, causing them to change their behavior with regard to the prevention of falls. Moreover these causes of injuries data could not be compared with BLS data, because it has not been reported specially for specialty trade contractors.
The respondents in this current study reported that more than half of the injuries were attributed to the fault of employees. They mentioned that after the injuries occurred, in most cases, the employers sent the employees to complete OSHA safety training before coming back to the job sites. These information are very critical and are not collected by OSHA, when the injury or illness occurred in the job sites. OSHA required all the employers to fill out OSHA’s form 300 and 301 [29]. However, in these forms, there is no mention of party on fault and OSHA training completed by the injured workers. This finding also suggests that more research should be conducted to determine the effectiveness of OSHA 10-hour training course taken by workers involved with mechanical contractors. Plumbing employers stated that they fired one-third of their workers after they were injured due to their fault.
In this study, the average injury rate of all the cases recorded was found to be 13.2, which is significantly higher than BLS for 2015 in the category of specialty trade contractors in Nevada, which was 5.1 [1]. The injury data published by Nevada Department of Business and Industry (NDBI) in 2015, shows the breakdown of injuries by type of specialty contractor. However, this data does not show the injury rate for plumbing, heating, and air-conditioning. This NDBI data shows that, under specialty contractor, the highest injury rate was found for framing contractors (12.8), which is similar to this finding. The injury rate for mechanical contractor found in this study also is little higher than what was found by Hinze and Gambatese [18] for Nevada specialty contractors. Also when compared to building construction injury rate (2.3) of Nevada, the injury rate of mechanical contractor of southern Nevada is very high. When this injury rate was compared to national injury rate for specialty trade contractors (3.6), it can be concluded that the mechanical contractors working in southern Nevada had higher injury rate than national average. One possible reason that Nevada mechanical contractors had a high injury rate compared to BLS data might be due to unreported incidence rates to OSHA by contractors. According to OSHA Standard 29 CFR, part 1904 [30], contractors with 10 or fewer employees are exempt from keeping OSHA injury and illness records. In this survey, nine contractors had less than 10 employees; therefore, the discrepancy in the injury rates occurred because most of these contractors had not reported their incidences to OSHA. Also the mechanical contractors have higher risk of injury compared to building contractors, because the previous studies had also shown that sheet metal workers involved in roofing, ventilation, cooling, and air-conditioning had higher chances of injuries [19–21].
When injury rates were compared based on various characteristics of the employees and employers, it was found that injury rates for larger contractors (i.e., with a high number of employees and high annual revenue) were significantly higher than for smaller contractors. A number of other studies had contrasting findings. Morrison [31] found that small business were more prone to occupational injuries and fatalities because of limited resources, difficulty in meeting regulatory requirements, and cost concerns. Mendeloff et al. [12] found that the fatality rate per 100,000 workers was nearly eight times higher for the smaller firms with less than 20 employees than that for larger firms with more than 1,000 employees. Their study indicated that that the high fatality and injury rates in small businesses was because they were less able to keep up with increasing regulatory requirements and unable to purchase mandated equipment to keep the workplace safe.
This study found that mechanical contractors involved in residential buildings had a significantly higher number of injury rates than did contractors involved with commercial and industrial buildings. One possible explanation for this could be due to the schedules of mechanical contractors working on residential buildings. The vast majority of plumbers, pipefitters, and steam-filter technicians worked full time, including nights and weekends [30]. These workers often handled emergency work in residential buildings, and overtime was common for them. Due to this overloaded work schedule, they were more prone to injury than workers in commercial and industrial buildings, who mostly worked during regular hours. Another possible explanation could be the mechanical contractors working in residential building rarely used material handling equipment due to tighter work space available for them. So there is higher chances of injury to the workers because of their direct contacts with objects and materials. Also these mechanical contractors, working in residential buildings, will have limited co-workers available to assist in their work compared to large commercial buildings mechanical contractors.
This study did not find significant correlation between the percentage of OSHA-trained employees and overall injury rates. One possible reason for not finding a significant and strong correlation between these two variables was due to the variability in the data. Out of 31 contractors surveyed, 17 contractors said that 100% of their staff had the OSHA 10-hour training course.
Conclusions and recommendations
In this study, data of 224 injuries and illnesses were collected from 31 mechanical contractors in southern Nevada. The average injury rate for these contractors was 13.2, which was higher than the average injury rate of Nevada and US for specialty trade contractors. Most injuries were related to sprains, strains, cuts, and lacerations. The top three body parts affected by the injury were the hand and wrist, back, and eye. This study found the occurrence of eye injuries second in frequency to hand and wrist injuries. It is recommended that protective eyewear be worn, especially the type that protects the entire eye and does not allow injuries caused by flying debris.
The average injury rate of mechanical contractors surveyed in this study, was higher than that compared to Nevada and national level specialty contractors. The type of contractors and their work had an effect on the injury rates. It was found that contractors with fewer than 22 s, annual revenue less than five million dollars, and worked mostly in residential buildings had significantly higher injury rates compared to other contractors. However, this study could not find evidence that contractors with a higher percentage of employees who received OSHA safety training course had fewer injuries compared to contractors with fewer percentage of employees with OSHA safety training course. The authors recommend expanding this study by collecting data from mechanical contractors throughout the United States, so that it could be determined whether the trends in southern Nevada are similar to other states.
Conflict of interest
None to report.
Footnotes
Acknowledgments
The authors gratefully acknowledge all the mechanical contractors who responded the survey. This study would not have been possible without their responses.