
Abstract
BACKGROUND:
Green jobs, being in line with the goals of sustainable development, promote “smart, sustainable and inclusive growth”, ensure a healthy functioning of Earth’s ecosystems and guarantee decent work for all workers and high levels of workers’ health.
OBJECTIVE:
Assessing whether green jobs protect and promote the health of workers and, at the same time, contribute to a reduction of occupational diseases and health damage resulting from accidents at work.
METHODS:
A core-set of Occupational Health indicators were selected to analyze the “sustainable work” in green employment, based on Annual Report. The indicators were applied to 281,124 establishments and 2,780,686 workers in Portugal.
RESULTS:
In the green job there is a lower level of organization as regards Occupational Health and Safety Services with a lower coverage of working population, and the incidence and severity of accidents at work is higher, as well as the percentage of workers with a lower level of professional qualification.
CONCLUSIONS:
Green job is not necessarily translated into safe, healthy and decent work. There is need and urgency to ensure a proper monitoring of green jobs in the context of Occupational Health, a requirement that should not be underestimated, if sustainable development is to be achieved.
Keywords
Introduction
The green economy is considered an important tool to achieve sustainable development [1] since it creates countless green jobs that help to protect ecosystems and biodiversity, reduce the consumption of energy, materials and water through high-efficiency strategies and a low carbon economy, as well as to avoid or minimize the “generation of all forms of waste and pollution” [2, p.3], while maintaining the healthy functioning of ecosystems on Earth [1].
Green jobs cover all the jobs that depend on the environment or are created, replaced or redefined in the process of transition to a greener economy [3, 4]. These must integrate the essential conditions for “equitable and sustainable socio-economic development” [5, p.27] and their aim cannot be solely to meet the purpose of their use [6].
Therefore, once assumed the concept of green job must integrate not only environmental and economic concerns, but also the social dimension, with a view to ensure that green jobs are decent [7] and quality jobs [8, 9] that offer appropriate salaries and adequate Occupational Health and Safety (OHS) conditions which meet the workers’ objectives, while providing for stability at work and ensuring career development and workers’ rights through dialogue and social protection [2, 9].
In this regard, the International Labour Organization (ILO) considers that the term “green job” refers to a subset of employment in the environmental sector [7] that meets the requirements of decent work, in particular by complying with the OHS principles (Fig. 1).
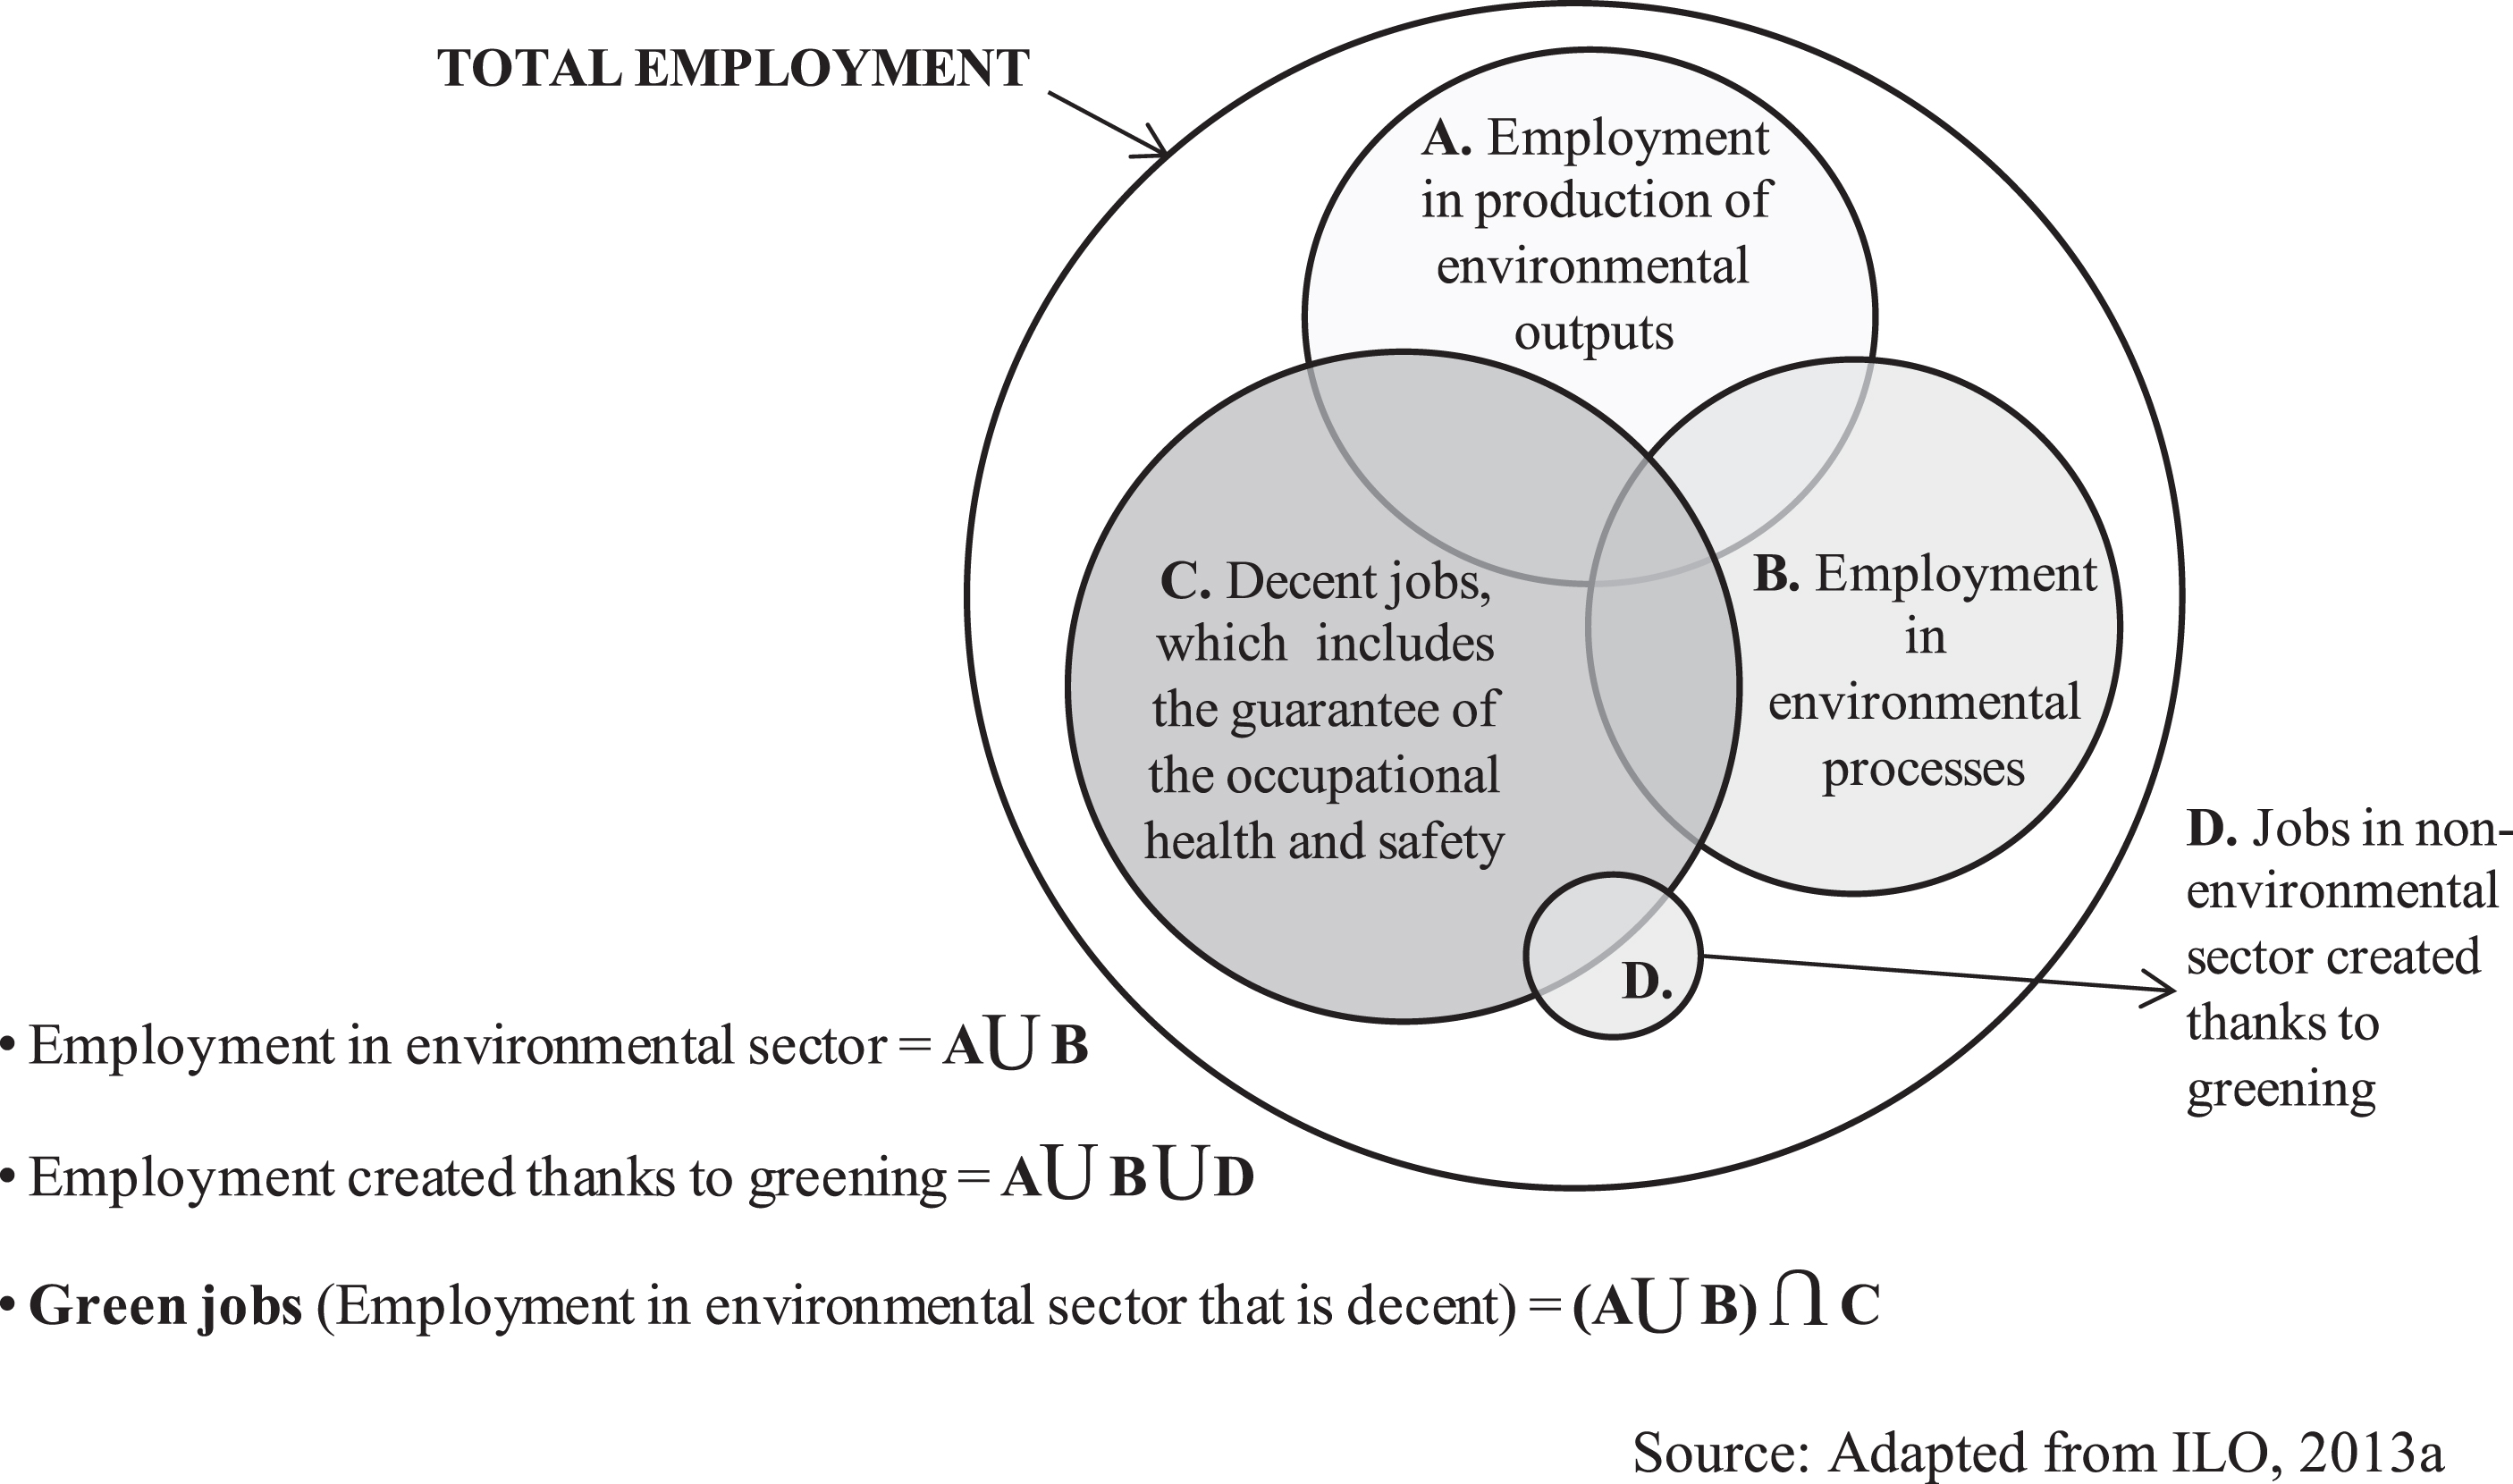
Relationship between total employment, employment in the environmental sector and decent work in the context of green jobs.
Thus, the concept of “green jobs” encompasses a broad range of jobs in different sectors, with different workplaces, diverse working conditions and processes and different groups of workers but, regardless of their features, these jobs should be “good for the worker, as well as for the environment” and must ensure safe, healthy and decent working conditions [6, p.21] in order to contribute to a truly smart, sustainable and inclusive growth [10].
Green jobs should be differentiated not only by integrating respectful work and concerns for the protection of the natural environment, but also by featuring high levels of occupational health and of compliance with workers’ rights [2]. As the livelihood and the sense of dignity of workers are considered to be strictly linked to their jobs, the guarantee of decent working conditions is a necessary and indispensable requirement for the defence of environmental issues, so much as environmental concerns are important for the defence of employment [2]. An exploitative, harmful, unsafe and underpaid employment condemns the workers to a life of poverty, so it can hardly be called “green”.
In this respect, WHO considers that OHS is one of the fundamental pillars of decent work [2, 11] and an essential value of a green economy [11], which should be given high priority and visibility as a key component of “just transition” [11, p.3] of this economy. It also stresses that green jobs, being a product of the green economy, must be in line with the principles of sustainable development and thereby ensure that their workers are covered by appropriate OHS Services that [12, 13]: a) potentiate the existence of “healthy workplaces”; (b) avoid or minimize the occupational exposure to risk factors that could compromise the workers’ health; (c) ensure a high quality of life at work; (d) enable all workers to achieve high levels of comfort and physical, mental and social well-being; (e) provide opportunities for improving individual health and for the reinforcement of healthy habits and lifestyles. It should be stressed that a working context favourable to the promotion and surveillance of the workers’ health and to the culture of prevention of occupational risks may have a beneficial impact on the health status [14] and on the quality of life of the worker [5] but also on the productivity and quality of goods and services [15].
Thus, in the current global transition to a green economy, green jobs are considered an important driver of development for countries, a key factor for building a green economy and boosting a safer, healthier and more sustainable future [2]. They have particular potential to tackle unemployment, since they may foster the creation of more jobs by being valued and encouraged by governments to the detriment of other jobs [2, 16–19]. In view of the prospective growth of green job in various sectors of the economy [2, 9] and of the expected market restructuring, it is essential that green jobs respect the principles of decent work [2, 16] and be beneficial to the health and safety of workers as well as to the environment [6]. In this sense, it seems essential that the OHS concerns are reflected in the green job, with a view to prevent occupational risks and protect and promote the health of workers.
A healthy workforce is a vital prerequisite for social and economic development [12, 21] and for the productivity [12, 21] of any community. Sustainable development, by seeking to meet the needs of the current population without causing adverse effects on the human health and on the environment, without depleting natural resources and without compromising the future generations, places human well-being in the centre of sustainable development [22, 23], in order to ensure a healthy and productive life in harmony with nature. In the context of Occupational Health (OH), these principles of sustainable development mean that the satisfaction of material needs through work and the production processes must occur without causing damage to the workers’ health, natural resources or public health [22], both in the short and long term.
“Health is a precondition for and an outcome and indicator of all three dimensions of sustainable development” [1, p.27], being acknowledged that this development is only achieved in the absence of a high prevalence of debilitating diseases (including some work-related diseases) and when populations reach physical, mental and social well-being. Therefore, it is fundamental to ensure the healthcare coverage of the population (which includes the occupational healthcare provided to the working population) in an “equitable” way, as an essential requirement to improve health and promote “social cohesion and sustainable human and economic development” [1, p.27]. Ensuring decent workplaces in the context of green job is a major challenge of today [24], in particular as regards compliance with the application of the OHS legal device to these jobs and enterprises.
Despite the huge transformation and development of the labour market that has been reported in recent decades [12, 15], the significant advances in OHS and a higher number of interventions in this area [25, 26], many workers are still exposed to “unacceptable levels of occupational risks” [15, p.1], being victims of occupational diseases and accidents at work. It is thus considered that the global burden of accidents at work and occupational diseases “remains unacceptably high” [25, p.37], wherein the green job is no exception: “it is not yet clear” if green jobs “are safe for workers” [27, p.333] and if they support the disadvantaged [28].
In this context World Health Organization (WHO) and ILO regard the OHS as an extremely important factor for the sustainability of enterprises and communities, as well as for national and regional economies [15, 25], considering that the primary prevention of occupational diseases and injuries is profitable and an important economic factor [15] because it prevents deaths, disability, human suffering and loss of income of the active population. The OHS is thus seen as an investment that reduces both direct and indirect costs, as it contributes to lower the costs of health and absenteeism, to improve morale, motivation and performance of workers and to promote the productivity of the enterprise [25].
It should be noted that within the scope of green jobs, the development of new “green” processes and technologies has reinforced the competitive advantages of enterprises [10] and of society in general, by promoting a sustainable economy. The creation of new technologies, processes and products may still be creating opportunities to benefit workers’ health and safety, by improving machines, tools and work environments [11]. Despite the optimistic win-win scenario, green jobs pose potential risks to the OHS that should not be ignored [6] hence the recognition of the importance of evaluating these new technologies in order to avoid the rapid development of undesirable negative impacts [1].
Several concerns have been raised regarding the insufficient attention paid to the occupational risks of green jobs and the urgent need to integrate/strengthen OHS requirements [25, 29] along with environmental and economic issues. The increased occupational risks and the new and emerging occupational risks [6, 25] have raised concerns with regard to green jobs, which require special attention and ask for “new and creative methods of surveillance and intervention” [15, p.2] and “innovative solutions” as far as prevention is concerned [12], representing a major challenge for the protection and the promotion of workers’ health. Occupational risk assessment is considered the key to the development of appropriate prevention measures [6], which should take into account the “life cycle” [6, 11] of the products/services and include the cooperation/participation of the various stakeholders/actors linked to the green technology or process.
In any situation, the health of the working population is determined not only by the occupational risk factors to which it is exposed, but also by social, economic and individual factors [15], in addition to the access to health services [12], so it is crucial that all countries have OH surveillance systems [9] allowing the monitoring of the employment in general and green jobs in particular.
It should be highlighted that within the “UE Strategic framework on health and safety at work 2014–2020” [26], it is considered that the most sustainable technologies, products and processes should be the principal subject of a careful evaluation of the new potential hazards [24] and allow to reduce the occupational risk exposure and the consequent adverse effects on workers’ health. Being the organization of OHS Service the basic pillar that fosters policy execution and compliance with legal and regulatory OHS requirements in a enterprise/establishment, as well as the main “driver” for extending the “universal health coverage of workers” [30], it is essential to establish indicators to measure the activities and the intervention capacity of these Services to prevent occupational risks and to promote and protect workers’ health [31].
Additionally, it should be stressed that usually the indicators for sustainable development, green economy and green jobs, essentially use the employment or unemployment rate [32, 33] to characterize the influence of the work on environmental policies. However, it was observed that the mere accounting of the number of workplaces can produce an illusion of progress [2, 6] if it is not associated, for example, with continuous improvement in the quality of processes, the enhancement of the working environment and the workers’ health, safety and well-being and the creation of decent work [2].
Although it is recognized that the assessment of green jobs is difficult to achieve given the existence of various possible assessment methodologies, the uncertain statistical definition and their scattered effects [34], these jobs and OHS may constitute an area of potential conflict of interest [25]. It is therefore important to investigate indicators that allow the monitoring of green jobs in the field of OHS.
In Portugal the “Commitment to Green Growth” [35] was published by the Ministry of Environment, Spatial Planning and Energy on 15th September 2014 with the purpose of establishing the requirements for the promotion of a development model that reconciles “economic growth with a lower consumption of natural resources and with social justice and quality of life of the populations”, aiming to achieve a green economy. This Commitment sets 13 quantified goals for 2020 and 2030, including “creating green workplaces” that will allow to “double the number of workplaces until 2030” (“75,500 persons employed in 2013 against 100,400 in 2020 and 151,000 in 2030”) in order to foster the increase of national productivity.
The developed exploratory-descriptive research [36] aimed to establish if “green job” in Portugal respects the principles of sustainable development with regard to OHS, namely if it protects and promotes the health of the workers while contributing to a reduction in occupational diseases and health damage resulting from accidents at work. The main objective was to compare the compliance of the green job with the OHS requirements with that of the other employment sectors in Portugal, as well as to analyse the selected variables and to describe the characteristics (the “state”) of OHS in the green job in Portugal.
At national level, the main OHS requirements are set out in the “Labour Code” and in the “Legal framework for the promotion of safety and health at work” which establish that the employer must ensure that workers are provided with safety and health conditions in all aspects of work, taking into account the general principles of prevention. They also stipulate that every employer or independent worker has the duty to organize OHS Services, while providing for the possibility of separating the “Health at Work” and the “Safety at Work” fields as long as the articulation between the two fields is ensured and regardless the modality of organization. Thus, the employer may adopt different modalities of organization of OHS Services for each establishment of its enterprise.
The Single Report (SR) was the data collection instrument, a legal obligation. This report is filled annually by all employers/economic agents that have at least one employee at their service and submitted to the Office of Strategy and Studies of the Ministry of Economy (OSS/ME).
The quantitative study took place between December 2014 and September 2015 and had as target population all Local Units/Establishments (LU) of Portugal which, in the year 2014, sent/submitted to OSS/ME the Annex D “Annual Report of the activity of Occupational Safety and Health Service” of the SR, with data/information for the year of 2013.
With the aim to achieve the objective of the research, a documental analysis (step 1) of the following OH indicators systems was initially undertaken: Epidemiological and Performance Indicators for Occupational Health Services – EPIOHS [39]; Indicators for work-related health monitoring in Europe – WORKHEALTH Project [31]; Work and Health Country Profiles – WHCP [40]; Health, Work and Well-being: baseline indicators – HWWB [41, 42]; Good Practice in Health, Environment, Safety and Social Management in Enterprises – GP HESSME indicators [43–45].
At this step, other complementary sources of information were also analyzed, namely the “Indicative list of indicators of PNSOC 2013/2017” [29], the “Indicators of Decent Work” [46], and the WHO conceptual framework “Health indicators of sustainable jobs” [21].
Given the impossibility of identifying a system of indicators that would be appropriate to the Portuguese reality, i.e. that would allow the use of the SR information and, at the same time, would offer the proper framework for the analysis of OHS in the area of green employment at national level, we decided to select the SR variables (step 2) and build key indicators (step 3) with them, with a view to establish a core-set of OH indicators for the analysis of green jobs in Portugal. The main criteria of selection were: (a) existence of the necessary information in the SR for the construction of the indicator; (b) comparability with legal criteria or other standards or guidelines; (c) easy and rapid determination and interpretation; (d) importance and scientific validation; (e) enabling a quick update and the construction of time series.
For the purposes of the present study, the OH indicator was considered as the indicator that measures trends over time for different types of green job and that allows to analyze, even if in general terms, the main occupational risks to which workers are exposed, the effectiveness of prevention, the improvement of the workers’ health, the ability to work and the well-being of the workforce [9] in green jobs.
The core-set of indicators built (step 4) was organized according to the four domains of the WHO conceptual framework relating to “Health Indicators of sustainable jobs” [21]: (a) Policies/processes for improving workers’ health protection; (b) Health risks at the workplace; (c) Health effects – occupational deaths, injuries and disabilities; (d) Social determinants of workers’ health. Although this framework had not defined indicators, its purpose “to evaluate the sustainable work” matched the intended focus of our assessment of green job in the context of OHS and, in addition, the established domains allowed organizing the main areas of analysis in a structured way.
All indicators were validated by two national experts (step 5), one from the Ministry of Health and the other from the Ministry of Economy.
The present article focuses on six OH key indicators (Appendix 1): Indicator 1. Distribution of LUs according to the organization level of OHS Services; Indicator 2. Proportion of LUs’ workers covered by OHS Services; Indicator 3. Distribution of LUs according to occupational hazards identification; Indicator 4. Incidence rate of accidents at work; Indicator 5. Severity rate of accidents at work; Indicator 6. Distribution of workers according to their degree of professional qualification. Hypothesis 1. The “Green” or “Not Green” nature of the LUs is not a determining factor for the level of organization of OHS Services. Hypothesis 2. The “Green” or “Not Green” nature of the LUs is not a determining factor in the number of workers covered by OHS Services organization; Hypothesis 3. The “Green” or “Not Green” nature of the LUs is not a determining factor in the identification of occupational hazards by LUs; Hypothesis 4. The incidence rate of accidents at work is equal for both categories of LUs; Hypothesis 5. The severity rate of accidents at work is equal for both categories of LUs; Hypothesis 6. The “Green” or “Not Green” nature of LUs is not a determining factor for the degree of professional qualification of workers.
The indicators mentioned above supported the following research hypotheses:
When testing the hypothesis, we found that the target population didn’t meet the conditions for the application parametric methods, hence the use of non-parametric methods in the research.
The Indicator 1 was disaggregated in order to highlight the LUs that reported not having organized OHS Services (“Without Organization”), the LUs that referred having organized OHS Services both in the field of “Health at work” and “Safety at work” (“With Complete Organization”) and the LUs that claim to have organized only one field of these Services (“With Incomplete Organization”).
The Indicator 2 was disaggregated in order to distinguish between the LUs’ workers without any access to organized OHS Services (“Without coverage”), the LUs’ workers with access to organized OHS Services both in the field of “Health at work” and “Safety at work” (“With Complete coverage”), and the LUs’ workers with access to organized OHS Services only in one field (“With Incomplete coverage”).
The Indicator 3 was broken down into LUs that had not identified any occupational risk (“Without identification”) and LUs that had identified at least one occupational risk (“With identification”) regardless of their nature (physical, chemical, biological, psychosocial, organizational or other).
The Indicators 4 and 5 weren’t disaggregated.
The Indicator 6 was broken down into three levels: (a) “Not qualified” corresponding to workers without any professional qualification (undifferentiated); (b) “Highly qualified” corresponding to the workers with the highest professional qualifications; and (c) “Other” that includes the remaining levels of professional qualification (e.g. senior staff, middle managers, supervisors, foremen, masters and team leaders, qualified professionals; specialized professionals).
The statistical data of the SR were extracted from the OSS/ME database through the program “IBM - SPSS Statics 22®”. The data obtained were always disaggregated by two categories: (a) category “Not Green/Green LU”; (b) category “Size of LU”. In the first category was considered to include any LUs which as regards the main Classification of Economic Activities (3rd revision: CAE - Rev.3) indicated a CAE code corresponding to “environmental employment” previously identified by the National Statistics Institute, I.P. LUs with other CAE codes were considered “Not Green LUs”. Under the category “Size of LU” and in accordance with the Commission Recommendation 2003/361/EC, of 6th May 2003, and Article 100° of the Labour Code, the following sub-categories were defined: microenterprise, up to 9 workers; small enterprise, 10 to 49 workers; medium enterprise, 50 to 249 workers; large enterprise, 250 or more workers.
The information validated by the OSS/ME on the year 2013 and submitted by employers in the year 2014 was used for the calculation of the indicators.
Results
The research comprised a total of 281,124 LUs (Table 1) and an annual average number of 2,780,686 workers (Table 2) linked to the respective LUs by a labour contract or equivalent.
Distribution of Local Units (LUs) across the categories “Size of LU” and “Not Green/Green LU”
Distribution of Local Units (LUs) across the categories “Size of LU” and “Not Green/Green LU”
Distribution of workers linked by labour contract or equivalent across the categories “Size of LU” and “Not Green/Green LU”
These two tables shows that 27.6% of LUs are “Green LUs”, and employ an average number of 796, 468 workers accounting for 28.6% of the total workers linked by labour contract to LUs employing at least one worker.
Table 1 also show that 97.5% of the business market is dominated by micro and small enterprises, and “Not Green LUs” (97, 6%) and “Green LUs” (97, 3%) present similar values. Overall 83.4% of enterprises have micro size.
Around 53.8% of workers work in micro or small enterprises and 74.9% work in SMEs (Table 2). These values grow in the case of “Green LUs” (micro and small enterprises 57.9% and SMEs 80.5%) when compared to “Not Green LUs” (52.1% and 72.6%, respectively). Workers are mostly linked to small enterprises, if we consider both the total of LUs (27.7% or 769, 565 workers) and “Green LUs” (32.5% or 258, 475 workers). The workers of “Not Green LUs” are employed mainly in large enterprises (27.4% or 543, 915 workers).
Indicator 1 (Table 3)
Globally 28.3% of LUs (79, 608) refer that they don‘t have any organized OHS Services and that “Green LUs” have the highest rate of “Without Organization” (29.8%).
Higher percentage value under “Without Organization” for microenterprises both in relation to the total national value (32.7%) and to “Not Green LU” (31.8%) and “Green LU” (35.3%), with the latter reaching the highest rate.
In relation to all the classes under the category “size of LU”, “Green LUs” account for the highest percentage value in the category “Without organization” (microenterprises represent 35.3%, small enterprises 8.2%, medium enterprises 2.9 % and large companies 12.3%).
65.9% of the LUs (185, 282) have organized services in both fields (“With Complete Organization”). However, the percentage value of “Not Green LUs” (67.1%) is higher than that of “Green LUs” (62.8%).
This trend of higher values in “With Complete Organization” of “Not Green LU” is denoted by the values in the category “size of LU” (62.7% microenterprises, 90.7% small enterprises, 96.7% medium enterprises and 90.1% large enterprises).
The maximum value for “With Complete Organization” occurs in medium-sized enterprises both in the category of “Not Green” LUs (96.7%) and “Green” LUs (93.8%).
5.8% of LUs organize only one field (“Health at Work” or “Safety at Work”), although the “Green LUs” (7.4%) present in this context a higher percentage in relation to the “Not Green LUs” (5.1%).
With the exception of large enterprises for which the highest percentage for “With Incomplete Organization” is found in “Not Green LUs” (2.0%), the remaining sizes of LUs show higher values in “Green LUs” (7.9% microenterprises, 5.9% small enterprises, 3.3% medium-sized enterprises).
Distribution of LUs according to the organization level of Occupational Health and Safety (OHS) Services in the categories “Size of LU” and “Not Green/Green LU”
Distribution of LUs according to the organization level of Occupational Health and Safety (OHS) Services in the categories “Size of LU” and “Not Green/Green LU”
13.2% of the total workforce (367, 397 workers) is not covered by any kind of OHS Services organization (“Without Coverage”). This rate is higher in “Green” LUs (15.5%) than in “Not Green” LUs (12.3%), a trend of indicator n. ° 2 that remains throughout all classes of the category “Size of LU”. The maximum percentage value of the indicator is achieved by microenterprises for “Not Green” LU (22.8%) and for total of LUs (23.6%), as well as for large enterprises in the category “Green” LU (31.4%). 81.9% of the workers have coverage by OHS Services organization (“With Complete Coverage”) with a higher overall rate in the “Not Green LU” (82.8%) than in the “Green LU” (79.7%). This trend of higher values for “With Complete Coverage” in “Not Green LU” is once again observed across all classes of the category “Size of LU”. The maximum values for “With Complete Coverage” are recorded by medium-sized enterprises in the categories “Not Green LU” (97.0%), “Green LU” (94.0%) and total of LUs (96.1%). 4.9% of the workers don’t have complete coverage (“With Incomplete Coverage”). As regards this type of coverage, a higher overall percentage is observed in “Not Green LU” (4.9%) as compared to “Green LU” (48%). This trend of higher values for “With Incomplete Coverage” in “Not Green LUs” applies only to large enterprises (9.2%); for the remaining sizes the “Green LUs” account for the highest values (8.2% micro-enterprises; 5.4% small enterprises; 3.5% medium enterprises).
Proportion of LUs’ workers covered by Occupational Health and Safety Services in the categories “Size of LU” and “Not Green/Green LU”
Proportion of LUs’ workers covered by Occupational Health and Safety Services in the categories “Size of LU” and “Not Green/Green LU”
More than a half of the LUs (70.8%) don’t identify any occupational hazards. “Green LUs” (70.9%) present a slightly higher rate for “Without Identification” of occupational hazards as compared to “Not Green LUs” (70.7%) and, consequently, the latter record a slightly higher rate for “With Identification” (29.3%). The rate of LUs “Without Identification” of occupational hazards is higher in microenterprises (74.4%) and its percentage value decreases as the size of the LU increases (micro-enterprise 74.4%; small enterprise 54.7%; medium enterprise 39.3%; large enterprise 37.3%). In “Green LUs” the rate is higher for all sizes of LU (micro- enterprise 75.0%; small enterprise 56.1%; medium enterprise 42.9%; large enterprise 37.7%). On global, large enterprises have the highest percentage for the LU’s “With Identification” (62.7%). The rates for “With Identification” are always higher in “Not Green LUs” (micro-enterprise 25.8%; small enterprise 46.0%; medium enterprise 62.3%; large enterprise 62.9%).
Distribution of LUs according to occupational hazards identification in the categories “Size of LU” and “Not Green/Green LU”
Distribution of LUs according to occupational hazards identification in the categories “Size of LU” and “Not Green/Green LU”
The overall rate is 353.3×10⁵, with “Not Green LUs” presenting a lower rate (343.3×10⁵) than “Green LUs” (376.8×10⁵). In the category “Size of LU” the rate is higher in medium and large enterprises of “Not Green LU” (552.5×10⁵ and 422.8×10⁵, respectively) and in micro and small enterprises the rate is higher in “Green LU” (201.2 ×10⁵ and 410.7×10⁵, respectively). The medium-sized enterprises of the “Not Green LU” category have the maximum value in terms of the incidence rate of accidents at work (552.5×10⁵).
Incidence rate of accidents at work by the categories “Size of LU” and “Not Green/Green LU”
Incidence rate of accidents at work by the categories “Size of LU” and “Not Green/Green LU”
The total rate is 1.9×10⁵, with an equal rate in “Not Green LU” and “Green LU”. With regard to the category “Size of LU”, it can be observed that the overall rate increases along this category, with the highest rate being recorded in large enterprises (3.7×10⁵). The rate of severity is higher in the micro-, medium and large enterprises of the “Green LU” category (1.4×10⁵, 4.8×10⁵ and 6.8×10⁵), while in the case of small enterprises this rate is higher in the “Not Green LU” category (2.2×10⁵). The highest rate (6.8×10⁵) is recorded by large enterprises of the “Green LU” category.
Severity rate of accidents at work by the categories “Size of LU” and “Not Green/Green LU”
Severity rate of accidents at work by the categories “Size of LU” and “Not Green/Green LU”
7.2% of workers are classified as “Highly qualified”, 10.6% as “Not qualified” and 82.2% have “Another qualification”. “Not Green LUs” have the highest overall rate for “highly qualified” workers (7.8%) and the highest percentages in all the classes of the “Size of LU” category (7.6% in microenterprises, while small, medium and large enterprises record 7.7%, 8.1% and 7.7% respectively), with the maximum value being achieved in the medium-sized enterprises. “Green LUs” have the highest rate for “not qualified” workers (12.1%), with microenterprises (7.6%) and large enterprises (33.5%) presenting the highest percentage values, the latter being the maximum value recorded. Regarding “Other qualification” the overall results are quite similar for “Not Green LUs” and “Green LUs” (82.3% and 82.0% respectively). “Green LU” record the highest percentages for workers qualification levels to the micro-, small- and medium-sized enterprises (86.6%, 85.5% and 84.3% respectively), while in the case of “Not Green LUs” the highest percentage is recorded by large enterprises (79.8%).
Distribution of workers according to their degree of professional qualification by the categories “Size of LU” and “Not Green/Green LU”
Distribution of workers according to their degree of professional qualification by the categories “Size of LU” and “Not Green/Green LU”
In the investigation were statistically tested six hypotheses that are based on the assumption that there are no significant differences between “Green LUs” and “Not Green LUs”.
Hypothesis 1 (Table 9)
It was investigated whether there is a correlation between the level of organization and the nature “Not Green” or “Green” of the LUs. The test calculation took into account two categories: LUs “Without organization” and LUs “With Complete Organization”. The chi-square test of Pearson was applied and it was found that there is statistical evidence to state that the distribution is not homogeneous. With the exception of large enterprises, the values for the total of LUs and all other classes of the category “Size of LU” indicate that there is a correlation between the type of LU (“Not Green/Green”) and the level of OHS organization. “Green LUs” show a greater tendency not to organize OHS Services.
Systematization of the results of the hypotheses testing regarding the “Distribution of LUs according to the organization level of OHS Services”
Systematization of the results of the hypotheses testing regarding the “Distribution of LUs according to the organization level of OHS Services”
Caption: “Sig” corresponds to a level of significance 0.05 to chi-square distribution with 1 degree of freedom (df = 1).
We sought to determine whether this coverage is related to the “Not Green” or “Green” nature of the LUs. In the calculation of the test this variable was grouped into two categories: workers “Without coverage” and “With complete coverage” by OHS Services. The Chi-square of Pearson Test was applied and we can see that there is statistical evidence to assert that the distribution is not homogeneous. With the exception of large enterprises, the values for the total of LUs and for the remaining classes of the category “Size of LU” show that there is a correlation between the type of LU (“Not Green/Green”) and the coverage of workers by OHS Services organization. In the situations in which the hypothesis is rejected, we observe a trend for a larger proportion of workers “Without coverage” in the “Green LUs”.
Systematization of the results of the hypothesis testing regarding the “Proportion of LUs‘ workers covered by OHS Services organization”
Systematization of the results of the hypothesis testing regarding the “Proportion of LUs‘ workers covered by OHS Services organization”
Caption: “Sig.” Corresponds to a level of significance of 0.05 for df = 1.
We sought to determine whether there is a correlation between the accomplishment of this identification and the “Not Green” or “Green” nature of the LUs. In the test calculation this variable was grouped into two categories: “Without identification” and “With identification” LUs. The Chi-square of Pearson Test was applied and it was ascertained that there is statistical evidence to affirm that the distribution is not homogeneous for micro-, small- and medium-sized enterprises and that in these classes the type of LU (“Not Green/Green”) is associated (it is not independent) with the realization of occupational hazards identification. For these classes of enterprises, the identification of occupational risks tends to be higher in the case of “Not Green LUs”. This evidence is not present in the total of LUs or in large enterprises.
Systematization of the results of hypothesis testing regarding the “Distribution of LUs according to occupational hazards identification”
Systematization of the results of hypothesis testing regarding the “Distribution of LUs according to occupational hazards identification”
Caption: “Sig.” Corresponds to a level of significance of 0.05 for df = 1.
It was investigated whether the distribution of the incidence rate of accidents at work is equal in the “Not Green” LU and “Green” LU categories. The calculation of the Mann-Whitney U Test of independent samples was performed, whereby it was observed that there is statistical evidence to state that in the LUs with micro and small sizes, as well as in the total of LUs there is a difference in the average values of the distribution of “incidence rate of accidents at work” between “Not Green” and “Green” LUs. “Green” LUs tend to have, on average, a higher incidence rate of accidents at work.
Systematization of the results of hypothesis testing regarding the “Incidence rate of accidents at work”
Systematization of the results of hypothesis testing regarding the “Incidence rate of accidents at work”
Caption: (a) The Levene and the Kolmogorov-Smirn tests were previously performed, by dimension and for the total of LUs. The former rejected the homogeneity of variances, while the latter rejected the normality; “Sig.” Corresponds to a level of significance of 0.05 for df = 1.
It was investigated whether the distribution of the severity rate of accidents at work is equal in the “Not Green” LU and “Green” LU categories. The Mann-Whitney U Test of independent samples was performed, showing that there is statistical evidence to say that for the total of LUs and for all the classes of LU of the “Size of LU” category, there is a difference in the average values of the distribution of the severity rate of accidents at work between “Not Green” and “Green” LUs. “Green” LUs tend to have, on average, a higher severity rate of accidents at work.
Systematization of the results of hypothesis testing regarding the “Severity rate of accidents at work”
Systematization of the results of hypothesis testing regarding the “Severity rate of accidents at work”
Caption: (a) The Levene and the Kolmogorov-Smirn tests were previously performed, by dimension and for the total of LUs. The former rejected the homogeneity of variances, while the latter rejected the normality; “Sig.” Corresponds to a level of significance of 0.05 for df = 1.
We sought to establish whether there is a correlation between the level of professional qualification and the “Not Green” or “Green” nature of the LUs. In the calculation of the test this variable was grouped into two categories: “Not qualified” and remaining workers, trainees and apprentices being excluded from the latter category. The Pearson’s Chi-square Test was applied and there is statistical evidence to assert that the distribution is not homogeneous for the total of LUs and for the classes of the “Size of LU” category, and the type of LU (“Not Green/Green”) influences (it is not independent) the degree of professional qualifications of workers. The microenterprises and large enterprises of the “Green” LU category tend to have a larger number of “Not qualified” workers. This also applies to the total of LUs. This trend is not observed in the small and medium-sized enterprises.
Systematization of the results of hypothesis testing regarding the “Distribution of workers according to their degree of professional qualification”
Systematization of the results of hypothesis testing regarding the “Distribution of workers according to their degree of professional qualification”
Caption: “Sig.” Corresponds to a level of significance of 0.05 for df = 1.
For the evaluation of the green job in the context of OHS, the SR, an administrative data source that stems from legal obligation, was used as the instrument of data collection. This report has proved to be a good instrument with great potential: (a) allows a regular data collection, in line with the ILO’s recommendation on regular compilation of OHS data, which should take place, wherever possible, on an annual basis [7]; (b) the information that is extracted has a wide scope and national representation since it includes all employers/economic agents that have at least one worker in their service, which allows to obtain very realistic results; (c) integrates a huge wealth of information that allows us to evaluate specific issues of OHS and decent work.
The indicators analysed, although they were built in the context of green jobs, could be applied to other types of employment and allow for sectoral approaches, by the selection of specific CAE previously to their calculation, since they are related with basic issues of OHS and decent work which are established in the national legal system and cut across all employment sectors. It is considered therefore a technical-scientific basis that could support policy decisions on occupational health and other policies, such as environmental policies, in their interfaces with work, employment and society.
All statistical calculations were broken down into the categories: “Not Green” and “Green” LU. However, in the absence of a harmonized methodology for the calculation of the green job and considering the statistical uncertainty [34] and the scattered effects of this employment, which are difficult to ascertain, it was decided choice to calculate the green jobs using the CAE codes provided by the National Statistics Institute, I.P., relating to “environmental employment” [47].
The disaggregation of statistical calculations by “Size of LU” (micro-, small-, medium- and large-sized enterprises), already used by other authors [48, 49], has proved to be an extremely important approach because it shows and identifies organizational and technical weaknesses within the scope of OHS by size of enterprise, which may foster a more targeted/focused preventive and/or a corrective action, according to the needs. Currently, many OHS policy strategies are defined for microenterprises or for SMEs [50] given the specificity required in many areas. We believe therefore that the data treatment by “Size of LU” which occurs in this study could support the government decisions at national level on OHS and that it should be taken into account in the design of the future OHS indicators systems.
The data analysis performed in the context of this research was focused on the data from the SR of the year 2013. Given the fact that the SR is in force since 2010, it is assumed that the filling in of the report by most employers is performed with a solid comprehension of the task, which ensures the quality and consistency of the results obtained from the analysis of the data of one single year.
The study population comprised 281, 124 LUs (Table 1) and 2, 780, 686 workers (Table 2) reflecting a high national representativeness. This population is mainly composed of micro, small or medium-sized LUs (99.7% of LUs - Table 1) with equal percentage in “Not Green” and “Green” LUs which is in line with the data of the European Commission [51], i.e. SMEs correspond to approximately 99.8%. However, it should be stressed that although the large LUs represent only 0.3% of overall LUs (Table 1), they employ 25.1% of the total workforce (Table 2).
Indicator 1 (Table 3) and Hypothesis 1 (Table 9)
There is a worrying percentage of LUs without an organized OHS Service (28.3% LUs), in particularly amongst “Green LUs” (29.8% LUs). The research also shows that globally 5.8% of LUs choose to organize only one field (“Health at Work” or “Safety at Work”), and this percentage being once again higher in the “Green LUs” (7.4% LUs). These results reveal the non-compliance with the legal requirements on OHS Services organization by enterprises, but more importantly they alert to the fact that the appropriate prevention of occupational risks and the protection and promotion of workers’ health, which are essential activities of OHS Services, are not guaranteed.
It was found that, with the exception of large enterprises, for the other sizes of LU and in global terms, the hypothesis of a correlation between the level of organization and the type of the LUs (“Not Green” or “Green”) was rejected, and that “Green” LUs tended to present lower levels of organisation of OHS Services. The results and their trend do not correspond to what would be expectable in green job, all the more because the organization of OHS Services, apart from being a mandatory legal requirement which must be fulfilled by all enterprises, is an essential requirement for green job [21, 52], since it promotes decent, healthy and quality work which is in line with the principles of sustainable development.
It can be observed that there are huge differences of OHS Services organization by size of enterprise: at national level, microenterprises have the most severe rate of LUs “Without Organization”, followed by large enterprises (32.7% and 8.9% respectively) and the rates are even more worrying in the case of “Green LUs”: 35.3% in microenterprises and 12.3% in large enterprises. The indicated differences should not be observed given the need and the importance of organizing OHS Services regardless of the economic sector and the size of the enterprises [53], which must ensure healthy and safe working conditions for all workers.
The study highlights that while recognizing the progressive development of OHS Services in Portugal it is crucial to continue to boost the implementation of these Services [53]. The results may also indicate a certain undervaluation of OHS by the enterprises, given that, as stated by the European Commission [26], the compliance with OHS is still seen as a mere legal requirement and an additional cost for the company, and not interpreted as an investment with gains for the workers, for the enterprise and for the society as a whole.
Indicator 2 (Table 4) and Hypothesis 2 (Table 10)
The high level of non-compliance by LUs with the requirements of organization of OHS Services which was observed in the previous indicator, leads to a considerable lack of workers coverage by OHS Services, namely 13.2% of the total study population (367,051 workers) was not covered by any type of OHS Services. It should be noted that the lack of workers coverage is greater in “Green LUs” than in “Not Green LUs” (15.5% and 12.3% respectively). The results show a high number of workers without access to an organized OHS Service in their enterprise to safeguard health, safety and well-being issues in work context.
With the exception of large enterprises, the hypothesis of workers coverage by OHS Services organization being related to the type of the LUs (“Not Green” or “Green”) was rejected for the remaining sizes of the LU and for the total LUs, and that “Green LUs” tend to have more workers without any coverage by OHS Service organization. The results and their trend are far from the expectable results for the coverage of all workers by organization of OHS Services in green jobs.
The lack of coverage by these OHS Services at the level of “Green LUs” shows a non-adherence to the principles of sustainability, particularly taking into account that WHO [30] and the United Nations [1] consider that the guarantee of health care coverage to working population is an essential requirement to promote health and social cohesion and human and economic sustainable development. It is thus observed that green jobs do not guarantee better workers coverage by OHS Services.
It should be further noted that, overall, there is a greater lack of coverage by OHS Services in microenterprises and in large enterprises (23.6% and 20.2% respectively). With regard to “Green LUs” the results show that about a quarter of workers in large enterprises and microenterprises are not covered by any OHS Service (31.4% and 25.6% respectively), these rates being incomprehensibly higher than those registered in “Not Green LUs” (17.1% large enterprises; 22.8% microenterprises), especially as regards large enterprises.
The high lack of OHS Services organization and workers coverage by these Services in microenterprises can be justified by the lower capacity for investment in OHS that these enterprises usually present [50], since they are at the end of the value chains and in competitive markets, where the compliance with OHS requirements can be seen as an obstacle to their performance and survival [50]. It may also be related to the insufficient knowledge by employers and workers of OHS, which prevents the promotion of the organization and implementation of these Services in microenterprises. This fact has led several international and national entities to publish in recent years various documents aimed at helping smaller companies to meet the minimum OHS requirements. It should also be noted that WHO [30, 54] has appealed to Member States to promote primary health care in the context of OHS, in order to ensure the access for all the workers to the minimum OHS Services, and thus promoting equity in this matter.
As regards to the high levels of non-organization of OHS Services (Table 3) and of workers coverage by these Services (Table 4) in large enterprises, it is found that if on the one hand these enterprises have usually greater possibilities of investment in OHS, on the other hand, due to the fact that their OHS Services are usually “internal services”, they are required to hire specialized professionals with adequate knowledge and competence in this matter, which are not always easy to recruit. Many enterprises and business groups have been requesting clarifications to the national authorities responsible [29] for OHS, in order to understand how they should organize their “internal” OHS Services and what this organization involves, which is revealing of the difficulties in this matter.
It should be stressed that the organization of OHS Services in large enterprises is extremely important, not only due to the number of workers that they employ, for whom the protection and promotion of health in work context must be ensured, but mainly because these large enterprises usually subcontract to other enterprises (micro, small and medium-sized enterprises), and may demand that these enterprises comply with OHS requirements, including the organization of OHS Services, as a mandatory requirement for the subcontracting. Thus, large enterprises may constitute a driver of chain improvement [11], for the benefit of OHS.
Indicator 3 (Table 5) and Hypothesis 3 (Table 11)
Taking into account the use of new “green” technologies, processes and products and the changes, transformations and reconversions of workplaces within the green economy [2], it was expected that the “Green LU” would have a lower rate in no identification of occupational risk factors, aspect which was not observed in the results of the present investigation.
“Green LUs” present, in overall terms, slightly higher (70.9%) levels of non-identification of occupational risk factors (“Without identification”) than “Not Green LUs” (70.7%). While the obtained results are not conclusive, the extremely high levels of failure of identification in occupational risk management context, which is of vital importance in the ambit of OHS should be noted, since only with the implementation of an effective management is it possible to ensure safe and healthy workplaces [49, 55], avoid adverse effects on the health and well-being of workers [50] and establish appropriate preventive measures when confronted with the health condition/illness of the worker and the specificities, sometimes “new”, of the workplaces, professional activities of workers and of processes/procedures that are executed, as well as the life-cycle of products/materials (design, manufacture, transportation, operation, maintenance, dismantling, treatment of waste and its re-use, when applicable) [6, 11].
The hypothesis of occupational hazards identification not being related to the “Not Green” or “Green” nature of the LUs was rejected for micro, small and medium-sized enterprises, being observed that the non-identification of occupational hazards tends to be greater in “Green LUs” with these sizes. Although it is not possible to establish the reason for the non-identification of occupational hazards by enterprises based on the SR data, the results achieved and their trend in the three sizes identified may suggest a lower culture of occupational hazards prevention [41, 56] in green job, which could have a negative impact on the health status of workers of this employment sector.
The high rate of LUs (“Green” and “Not Green”) that do not identify occupational risks, especially at the level of microenterprises (74.4%) should be pointed out, which may indicate that around three-quarters of the workers of microenterprises don’t benefit from an occupational risk assessment and therefore they don’t enjoy of adequate prevention. Also worth mentioning is a progressive decrease of the values of this indicator by size of the enterprise. The results obtained in the study may also be related to the lack of knowledge and/or with the difficulty to implement the occupational risk management process in small-sized LUs [6].
The reason for this non-identification/evaluation can also be explained by the fact that enterprises are less aware of the risks in the workplace or the fact that “occupational risks factors are already known” [49, 55] and/or less attention is paid to the registration of the occupational risks factors already known [49, 55] as referred by some companies in the context of a survey carried out by the European Commission.
Indicators 4 and 5 (Tables 6 and 7) and Hypotheses 4 and 5 (Tables 12 and 13)
In the context of workers’ health, the accidents at work, due to the fact that they reveal a negative overall result that must be urgently prevented [37, 45] in order to avoid the suffering of the workers (and often their families), the incapacity for work (temporary or permanent) and the absenteeism at work, justified the selection of two accidents at work indicators for the present investigation.
Through the analysis of the data on accidents at work included in the SR it was possible to establish that the global incidence rate of accidents at work in workers is 353.3×10⁵ (Table 6) and this rate is higher in “Green LUs” (376.8×10⁵) when compared to “Not Green LUs” (343.3×10⁵). While it would be expectable for “Green LUs” to have lower rates than “Not Green” LUs in terms of accidents at work (or at least equal rates to those recorded by the latter), given the alignment of green jobs with the pillars of sustainable development, the results show that employment in “Green LUs” may not be ensuring safe and healthy working conditions [56] to workers (especially in micro and small enterprises), and that therefore decent and healthy employment is not guaranteed in this sector. Other studies [9] have also showed a high number of accidents at work in green jobs.
It is also observed that the medium and large enterprises record the highest values for the incidence rate (549.2×10⁵ and 406.6×10⁵, respectively - Table 6) and for the severity rate (2.1×10⁵ and 3.7×10⁵, respectively - Table 7) of accidents at work. It should be stressed that the accidents at work, being avoidable, their occurrence and severity are clear indicators of the absence, ineffectiveness or insufficiency of preventive measures [56], which may be associated with inadequate occupational risk management.
The hypothesis that the incidence of accidents at work rate is equal in the categories “Not Green/Green” LU was rejected for the total LUs and for the micro and small-sized LUs (Table 12), with “Green” LUs presenting, on average, a higher incidence rate of accidents at work in these classes.
Regarding the hypothesis that the severity rate is equal in the categories “Not Green” and “Green” LUs was rejected for the total LUs and for all sizes of LUs (Table 13) and it was found that “Green LUs” have, on average, a higher severity rate of accidents at work.
The results and trends of the mentioned situations don’t meet the expected results for green jobs because these rates reveals: (a) an overall negative effect on the workers’ health, showing that occupational risks in green job exist and should not be ignored [6, 18] and that the “green” workplaces require adequate preventive measures; (b) the high occupational risk associated with “Green LUs” and the severity of the adverse effect [37] on workers’ health. This result may significantly undermine the sustainability of this employment within the ambit of green economy [11], since sustainable development is only achieved when populations reach high levels of physical, mental and social well-being [1].
Indicator 6 (Table 8) and Hypothesis 6 (Table 14)
The selection of this indicator was based on Decent Work indicators [46]. Given the innovative features of technological nature of products and processes in green jobs [6, 57], usually require a “more intensively high-level cognitive and interpersonal skills compared to non-green jobs” [58], a higher rate of “Highly qualified” workers in “Green LUs” would be expectable. This was not verified in the investigation since the percentage values are lower in the “Green LUs” when compared to “Not Green LUs” (5.9% and 7.8% respectively). This trend is observed in all the classes of the category “Size of LU”. As advocated by the ILO, we consider that Indicator 6 is crucial to support the transition to a green economy, as well as for the planning [57], formulation and evaluation the environmental policies and the labour market, and to assess how the economy is responding to several policies and public initiatives [7]. However, although work is a strong predictor of quality of life [59, 60] tends to be overshadowed by the environmental and economic dimensions of sustainable development.
Some authors [48, 61] report the existence of precariousness in the green workplaces [62], associated with the employability of a large number of unskilled workers. The study finds that, overall, the rate of “Not qualified” workers is higher in “Green LUs” in relation to “Not Green LUs” (12.1% and 9.9% respectively), increasing progressively with the “Size of LU”. The highest rate of “Not qualified” workers occurs in the large “Green” LUs (33.5%).
The hypothesis that the professional qualification of workers is not related to the type of the LU (i.e. “Not Green” or “Green”) was rejected for the total of LUs and all sizes of LUs, and it was observed that micro- and large-sized “Green” LUs tend to higher more “not qualified” workers. In the highlighted situations, the results and their trend don’t meet the expectations for green job because the non-qualification of workers may be linked to the disqualification of work [48, 61] with a consequent negative impact on the well-being and health of the workers.
Conclusions
The transition to the green economy has created a large number of green jobs in several sectors of activity. Based on the information recorded in the SR, the research shows that in Portugal, in 2013, there were 796,468 workers in “green” jobs, about 28.6% of the total workforce. It can be also observed that 57.9% of the “green” employment workers work for micro- and small-sized enterprises.
All statistical results used for the calculation of the indicators have been disaggregated by “size of LU” (micro-, small-, medium- and large-sized enterprise) and “category of LU” (Green/Not Green), which allowed to identify organizational and technical constraints within the scope of OHS by size of enterprise and to analyse the differences and similarities between green jobs and the remaining employment, enhancing the possibilities for the adoption of more targeted/focused preventive and/or corrective approaches and benefiting the decision support on OHS.
The research considered six hypotheses based on the assumption that there were no significant differences between the results of “Green LUs”, which represented the green job, and “Not Green LUs”. Overall, it was found that five hypotheses were rejected concerning the “level of OHS Services organization”, the “coverage of the working population” by these Services, the “incidence and severity of accidents at work” and the “professional qualification degree of the workers”. Only one hypothesis, relative to the “identification of occupational risks” was not rejected. Thus, it cannot be affirmed based on the research results that green jobs in Portugal are consistent with the principles of sustainable development in the context of OHS.
“Green LUs” presented a smaller investment in the OHS Services organization when compared to “Not Green LUs” and, consequently, a lower coverage of workers by these services. These results, besides possibly reflecting the little value placed on the health of workers and the lack of attention paid to this issue by “Green LUs”, show that “green” jobs are far from the desirable sustainability.
The research highlights a “delay” in green jobs in terms of occupational risk identification as compared to the remaining employment areas, and, naturally, in the improvement of the respective working conditions. Consistently, the results showed that the consequences on workers’ health are more serious in the case of green job, which presents the highest incidence rate of accidents at work. The severity of the accidents in green job was especially evident in the medium- and large-sized enterprises of the “Green LUs”, for which the severity rate of accidents at work is twice the rate recorded for “Not Green LUs”.
Thus, the study showed an overall negative result as regards the effects on the health of “green job” workers. It demonstrates that there are occupational risks in this employment that should not be ignored and that safe and healthy working conditions are not guaranteed in green job, and that, therefore, occupational risk management should not be underestimated and/or undervalued because it is the most effective means of prevention. It should be noted that the high cost of the work-related damage could compromise the sustainability of green economy by creating a dependent burden leading to a reduction of economic productivity per-capita and to the deviation of investment resources.
With regard to professional qualifications it was observed that, contrary to expectations, green job presented the highest values for the rate of “Not qualified” workers, mainly due to the high value recorded in the large “Green LUs”. We consider therefore that the results may indicate a greater disqualification of work in “green” jobs, which represents a deviation from what was expected from these jobs: highly skilled work given the innovative features at the level of technology, processes and products.
In the future, the results achieved should be confirmed through the application of the indicators to other time series and the future statistical definition of “green jobs” which ILO is currently developing should be used. The continuation of this study could allow to reinforce the evaluation carried out and the obtained results should influence the current and future strategies on sustainable development in Portugal, including those related to green job and to the health and safety of its workers.
The results produced should be regarded as a warning regarding the need and the urgency to ensure at national level an adequate monitoring of the quality and sustainability of work in green job through the establishment and application of OH indicators, otherwise the growth of green job could represent an illusion of progress that doesn’t enable the achievement of sustainable development.
In conclusion, national authorities should give high priority to OHS issues within the ambit of the green economy/jobs, so that the employment created, besides being in harmony with nature, contributes to the improvement of the workers’ health, well-being and quality of life, and promotes a healthy workforce, which are essential aspects for economic and social development growth. It should be stressed that the transition phase to the green economy is a unique opportunity to integrate strategies by setting stricter standards for environmental protection and efficiency that ensure the functioning of the Earth’s ecosystems and, at same time, include the OHS as an essential part of that strategy, ensuring high levels of health and a decent and productive life of the working population.
Portugal is currently faced with a double challenge: on the one hand, as regards the already existing and the future green job, to ensure OHS Services coverage for all the workers, so that this employment promotes healthy work environments, which offer opportunities for the improvement of the workers’ health according to their needs; on the other hand, that OHS should be recognized as an important and indispensable reference and indicator of sustainability, as a vital driver to sustainable development, a key factor of the green economy and an indispensable requirement to classify jobs as “Green”.
To this end, there must be a more determined, robust and coherent response at political level in the area of “Employment, Labour, Health and Environment”, where it is crucial to enhance synergies and complementarities between sectors, as well as to ensure the social dialogue between the government, employers, workers’ representatives and the academy, for the design and implementation of fair and efficient policies, in order to ensure that the green job truly fosters smart, sustainable and inclusive growth, which enables the community to create more value.
The green job in Portugal must be distinguished not only by the environmental issues that it accommodates, but also by the compliance with the principles of OHS and by the guarantee of decent, healthy, protective and quality work that promotes and benefits the health and the quality of life of all workers.
Conflict of interest
The authors declare that there are no conflicts of interest.
Footnotes
Appendix
Occupational Health indicators and respective calculation formula
| Indicator | Description | Formula | Variables contemplated for the descriptor of each formula |
| 1. Distribution of LUs according to the organization level of OHS Services: | Indicates the existence of organized OHS Services in the LUs, in the “Health at work” and “Safety at work” fields, in the reference year. It is expressed in percentage. |
|
“ |
| “ |
|||
| “ |
|||
| 2. Proportion of LUs’ workers covered by OHS Services: |
Indicates the number of workers in LUs that had access to organized OHS Services (in the fields “Health at work” |
|
“ |
| “ |
|||
| “ |
|||
| 3. Distribution of LUs according to occupational hazards identification: | Indicates the number of LUs which identified occupational hazards of physical, chemical, biological, psychosocial, organizational or other nature, related to the activity, in the reference year. It is expressed in percentage. |
|
“ |
| “ |
|||
| 4. Incidence rate of accidents at work: | Indicates the number of accidents at work that occurred in the reference year in relation to the total workforce in the same year. It is expressed in 1×10⁵. |
|
— |
| 5. Severity rate of accidents at work: | Indicates the number of days lost due to accidents at work in the reference year in relation to the total number of hours actually worked by workers in the same year. It is expressed in 1×10⁵. |
|
— |
| 6. Distribution of workers according to their degree of professional qualification: |
Indicates the number of workers by degree of professional qualification that, in the reference year, belonged to a LU with some level of OHS Services organization (in the field of “Health at work” |
|
(a) Number of workers broken down into the following degrees of professional qualification: |
| •Senior management; | |||
| •Middle management; | |||
| •Supervisors, foremen, masters and team leaders; | |||
| •Highly skilled professionals; | |||
| •Skilled professionals; | |||
| •Semiskilled professionals (specialized); | |||
| •Unskilled professionals. |