
Abstract
BACKGROUND:
Several comfort perception models have proposed an objective method to evaluate “effects in the internal body” and “perceived comfort”. Postural comfort is one aspect of comfort/discomfort perception, and this current work adds to existing knowledge toward a more objectified posture evaluation for comfort.
OBJECTIVE:
The authors have used the concept of Range of Rest Posture (RRP), as proposed by Apostolico et al. The study focused on the identification of RRP within the Comfort Range of Motion (CROM) for lower limbs.
METHODS:
The proposed method is based on extensive experimental work involving 114 healthy individuals (59 males and 55 females) ranging from 20 to 40 years old. The age range was narrowed to avoid an age-clustering of results due to inhomogeneity of the statistical sample. Data were processed using statistical methods for identifying the RRP in the experimental CROM. Several Maximum Level of Comfort (MLC) positions were found within the RRP.
RESULTS:
RRPs for lower limbs of men and women have been identified and can be used for virtual comfort assessment.
CONCLUSIONS:
This paper shows a method to evaluate in a more objective way the subjective postural comfort perception and results allow researchers to improve models for the virtual preventive comfort assessment.
Introduction and state of the art
Products are designed to incorporate specific functions that benefit users. However, a successful function is dependent on people being able to use the products correctly. In the past, the principles of user-centred design were methods for creating products, environments [1] and systems fit for human use [2]. Ergonomics, meanwhile, studies the interfaces between people, activities they perform, the products they use, and the environments in which they work, travel, or play. As stated in [3], ergonomic principles allow us to develop guidelines for improving and redesigning both old and new products.
As required in several ergonomics assessment methods – including RULA [4], REBA [5], LUBA [6], Strain Index [7]; OCRA [8–11], OREGE [12], NIOSH, and [13–15] others – the physical ergonomics and the physical comfort assessment is required to overcome by-law specifications [16].
“Comfort” can be defined as the level of well-being perceived by humans when interacting with a working environment; thus, “postural comfort” can be defined as the well-being due to body posture, which is difficult to detect and measure because it is affected by individual judgment that is analyzed using quantitative/qualitative methods.
Thanks for this new need in the product development plan, a wide range of research has been done on physical comfort and discomfort in the workplace. Most studies have discussed the relationships among environmental factors that can affect perceived levels of comfort/discomfort, such as temperature [17], humidity [18], applied forces [19], and others [20]. Several papers adhere to the assumption that a relationship exists between self-reported discomfort and musculoskeletal injuries, with these injuries affecting (decreasing) perceived comfort [21, 22]. However, theories relating comfort to products and product design characteristics have been rather underdeveloped.
The last 15 years have seen only five “comprehensive models” that considered every aspect of human perception: the Helander model [23], the Moes model [24], the Vink-Hallbeck model [25], the Naddeo-Cappetti model [26], and the Vink model [27].
In the Naddeo-Cappetti model (see Fig. 1), the internal body and perceived effects play a fundamental role in comfort/discomfort perception and evaluation.
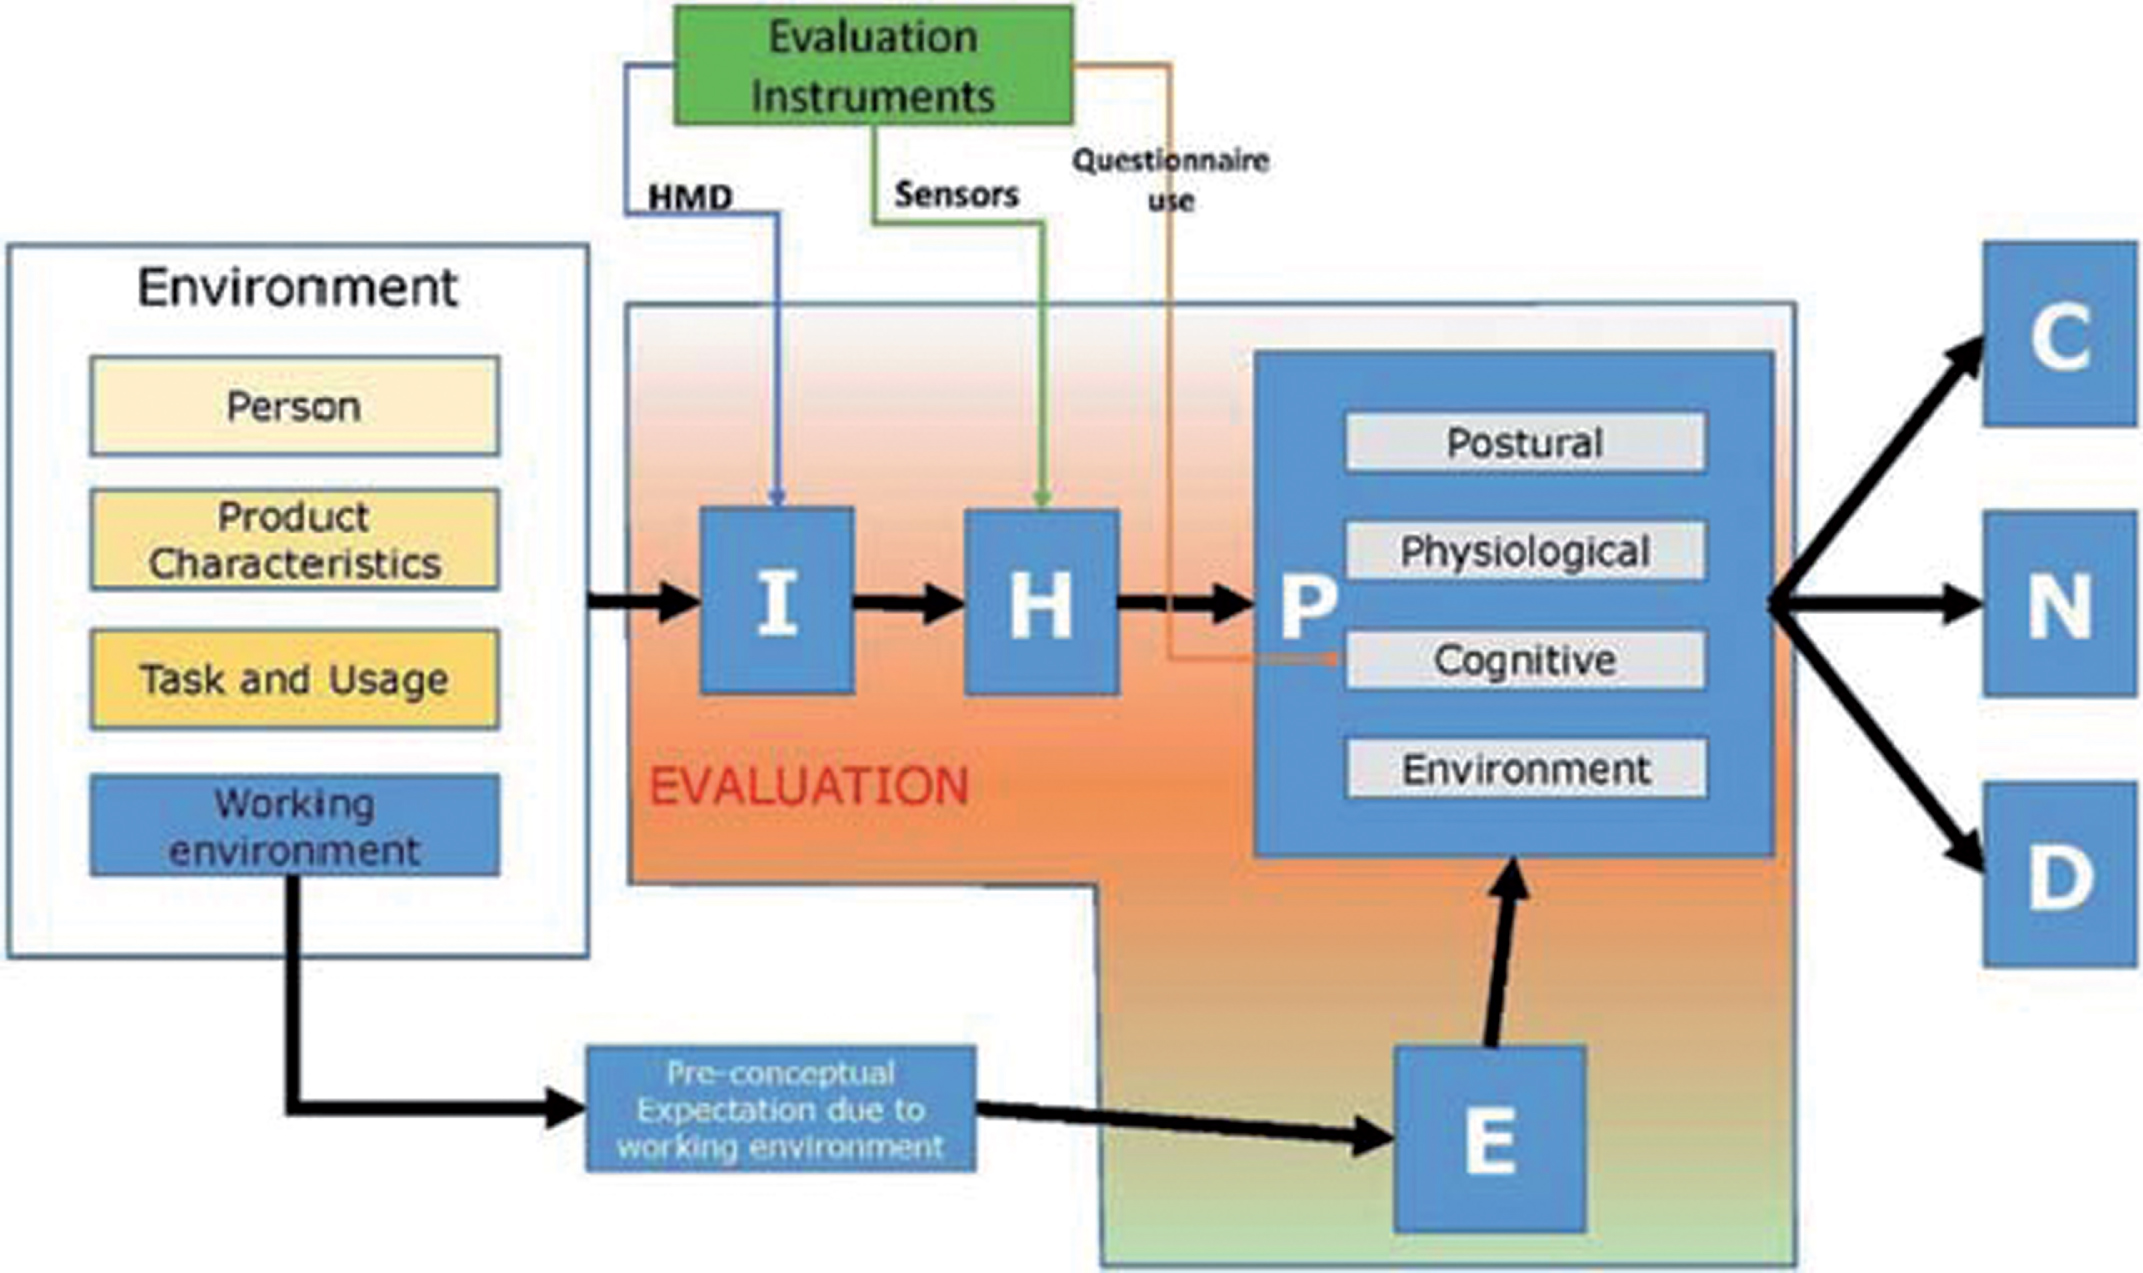
The Naddeo-Cappetti model of comfort/discomfort perception.
In this model, the internal Human-body behavior(H) and Perceived effects (P) play a fundamental role in Comfort (C)/Discomfort (D) perception and evaluation during the Interaction (I), without forgetting the effects of Expectation (E) [28] and of evaluation instruments.
Each model underlines the importance of body posture in comfort analysis since it considers body effects and perceived effects that are useful in evaluating the Maximum Level of Comfort (MLC) positions in human postures. In MLC identification, it is useful to perform a comfort evaluation based on measurement of the angular Range of Motion (ROM) of each joint [1–31] as the limits of variability andmobility.
In 2016, Vink et al. [32] developed the “Comfortable Built Interior Environment Model” in which the physical effects of posture on perceived comfort have been further highlighted and the needs of a tool for better objectify this effect has been required.
Certain medical studies have shown that each joint has its own natural Rest Posture (RP) [31, 33] when the muscles are completely relaxed or at minimum strain level: When this occurs, the geometrical configuration corresponds to the natural position of the resting arms, legs, neck, and so forth.
Galinsky et al. [20] demonstrated that the rest position minimizes musculoskeletal disease and optimizes comfort perception; in Apostolico et al. [1], the problem of identifying and using the RP concept in ergonomic/comfort evaluations is addressed; Christensen and Nilsson [33] presented an application in which the “neutral zero position” is defined as a parameter for calibrating mechanical instruments in measuring the neck’s ROM. The RP concept has been used in [1] for experimentally identifying the Range of Rest Posture (RRP) for upper limbs.
Apostolico et al. [1] recognized that, for each joint, there is a subset of positions – defined as the Comfort Range of Motion (CROM) – in which humans feel comfortable. In the same paper, the authors presented an experimental method to check the natural human ROM and determined CROM for human joints on upper limbs using their method to analyse postural comfort evaluation.
Naddeo et al. [34] demonstrated that the positions of human body joints are useful to evaluate users’ postural comfort, building curves that represent comfort values along the entire range of postures for the considered joints. In that study, only upper limb joints were considered, starting from their rest posture evaluated in [1]. These curves show the maximum comfort in RRP; therefore, extending the curves to the whole human body, one must evaluate the Rest Postures for all joints.
In Kilincsoy et al. [35] and Smulder et al. [36] some studies about the effect of pressure distribution in car seat [36] and in aircraft seat [35] have been conducted and in both studies limitation related to the lack of knowledge about quantifying the postural comfort of human limbs are shown.
Finally, Trapanese et al. [37] and D’ambrosio et al. [19] demonstrated that less muscular activation has the outcome of higher perceived postural comfort and in Cappetti [38], the curves of comfort have been directly related to overall muscular activation for upper limbs and some lower-body joints.
This current paper’s main research questions are: How the behaviour of lower limb joints can be identified and described? How the Range of Rest Posture (RRP) inside the ROM can be quantified and located to investigate further the CROM?
The goal of this paper was to extend the work done in 2013 [1] on upper limbs and complete the study about RP for lower limbs in different positions, thereby answering the research questions.
This study defines “RRP” for the following human joints and their “Degrees of Freedom” (DOF) regarding: hip: flexion, abduction/adduction, internal/external rotation; knee: flexion/extension, internal/external rotation; ankle: dorsal-plantar flexion. It is important to note that DOFs are aligned with the ROM. Each ROM is defined using references coming from orthopedic treatises [7].
Statistical sample
The chosen statistical sample consisted of 59 men and 55 women among university population: height range of the sample was between 4′ 11″ and 6′ 2″, age between 18 and 40 years old, and absence of muscular-skeletal diseases.
Students were informed about the test procedure. The final goal of the test was not explained to them to avoid compromising the outcome of the tests, giving students unnecessary information that could affect the success of the test itself. An informed consent form was given to all subjects and accepted. All tests were designed and performed in order to comply with the Code of Ethics of the University of Salerno (Italy).
Method
A set of experiments was performed on the subjects to measure RPs. Data were processed by a statistical approach to identify the width and position of RRP into the ROM for each considered joint.
RRP has been identified in three different postural configurations: seated, standing, and lying. In each configuration, it was possible to identify different articular movements: 1) hip flexion, add/abduction and knee flexion/extension and rotation; 2) hip internal/external rotation, and 3) dorsal-plantar ankle flexion.
The evaluation of hip internal/external rotation was made in the standing position, due to difficulties in evaluating it in the seating one, and following the guidelines given by physiatrists [39–41]. Accurate measurements of joints movements were analysed one by one for identifying their best configuration. The dorsal-plantar flexion was tested in a lying position, as suggested in [39, 40].
ROM identifications were made starting from the geometric zero position. For the hip, geometric zero corresponds to the extension of the thigh perfectly aligned with the back, with the knee position corresponding to the extension of the thigh. For the ankle, geometric zero corresponds to the perpendicular extension of the leg.
During the experiments, both anthropometric measures, which are needed to select the percentile of the human sample, and the Rest Posture angles for each joint have been collected.
A photographic survey method and an image processing software (KINOVEA by Joan Charmant) were used: the first allowed collecting information about joints without the use of invasive/contact system that can limit or affect the natural positioning of the joints [11, 33]; the second was the fastest and safest method to extract and manage acquired information [42, 43].
The photographic environment was prepared in the Virtual Design laboratory at the University whose layout is represented in Fig. 2. Three cameras were positioned on tripods in order to create a photographic set able to ensure the posture acquisitions in all the configured positions. The reference system was calibrated to avoid and/or forecast errors due to the barrel/pillow effect during photographic acquisition.

Layout setup.
In order to perform postural simulations for angle acquisition, the human body was modelled using a schematized multi-body system in which the joints were connected to each other by line segments. The resulting angles were defined using these lines.
Acquired pictures were modified to correct the distortion effects due to camera positioning, using a calibration factor/corrective factor with a uniform grid structure on the wall and floor.
Image processing allows to evaluate the following movements: Hip flexion (Camera A, Fig. 2), defined as the angle between two segments: the first one along the femur-axis and the second, in a vertical direction, starting from the greater trochanter. Knee flexion/extension (Camera A, Fig. 2), defined as the angle between two segments: the first one along the fibula-axis and the second, in a vertical direction, starting from the lateral epicondyle of the femur. Hip abduction/adduction (Camera B, Fig. 2), defined as the angle between two segments: the first along the femur-axis and the second, in a vertical direction, starting from the anterior superior iliac spine. Hip internal/external rotation (Camera C, Fig. 2), defined as the angle between two segments: the first one along the femur-axis and the second, in a horizontal direction, starting from the anterior superior iliac spine. Knee internal/external rotation (Camera C, Fig. 2), defined as the angle between two segments: the first one along the shin-axis and the second, in a horizontal direction, starting from the lateral epicondyle of the femur. Ankle dorsal-plantar flexion (Camera on the side of the pedal used for measurements), defined as the angle between two segments: the first one along the sole-axis and the second, in a vertical direction, starting from the lateral malleolus.
Procedure
Tests were planned in order to acquire the best set of data for describing the posture-related comfort and identify the RRPs. To do that, each subject was asked to perform three tests for each configuration:
Test 1 – Seated test for the hip flexion and abduction/adduction and knee flexion/extension analysis: the subject was requested to sit on an adjustable-height chair with rigid pan and rigid backseat, without armrest, and to position him/herself in the most comfortable position in terms of seat pan height. The first photographic acquisition was made in this configuration. After this step, the subject was asked to set the height of the seat pan at maximum and minimum heights. Test 2 – Standing test for hip and knee rotation acquisition: The subject was requested to stay in a standing position, point the heel to the floor and then rotate the hip, pointing the tip of the foot on a ground reference system, thereby evaluating and measuring the angle (this also applies to the rotation of the knee when sitting). Even in this case, the subject was requested to assume the most comfortable position, the zero position (this position was set for each subject) with a geometric angle of 0°, the most comfortable internal rotation position, and the most comfortable external rotation position. Test 3 – Lying test for ankle dorsal-plantar flexion acquisition: The subject was asked to lie down on an ultra-thin soft foam pad on top of a hard wooden bed. His/her right foot was arranged on a pedal capable of measuring the angle of ankle flexion, as done in a physiatrist’s test (40). The subject was requested to assume the most comfortable position, the zero position (this position was set for the subject) with a geometric angle of 0°, the most comfortable dorsal flexion and the most comfortable plantar flexion for the ankle.
It’s important to underline that DOFs of hip articular joints (Fig. 3) are linked to the thigh movements, DOFs of knee joint (Fig. 4) to the leg movements, and DOFs of the ankle articular joint (Fig. 5) to the foot movements. It represents a limitation of our study because the tests were not able to analyse combined movements with the consequent changes of their ROMs.
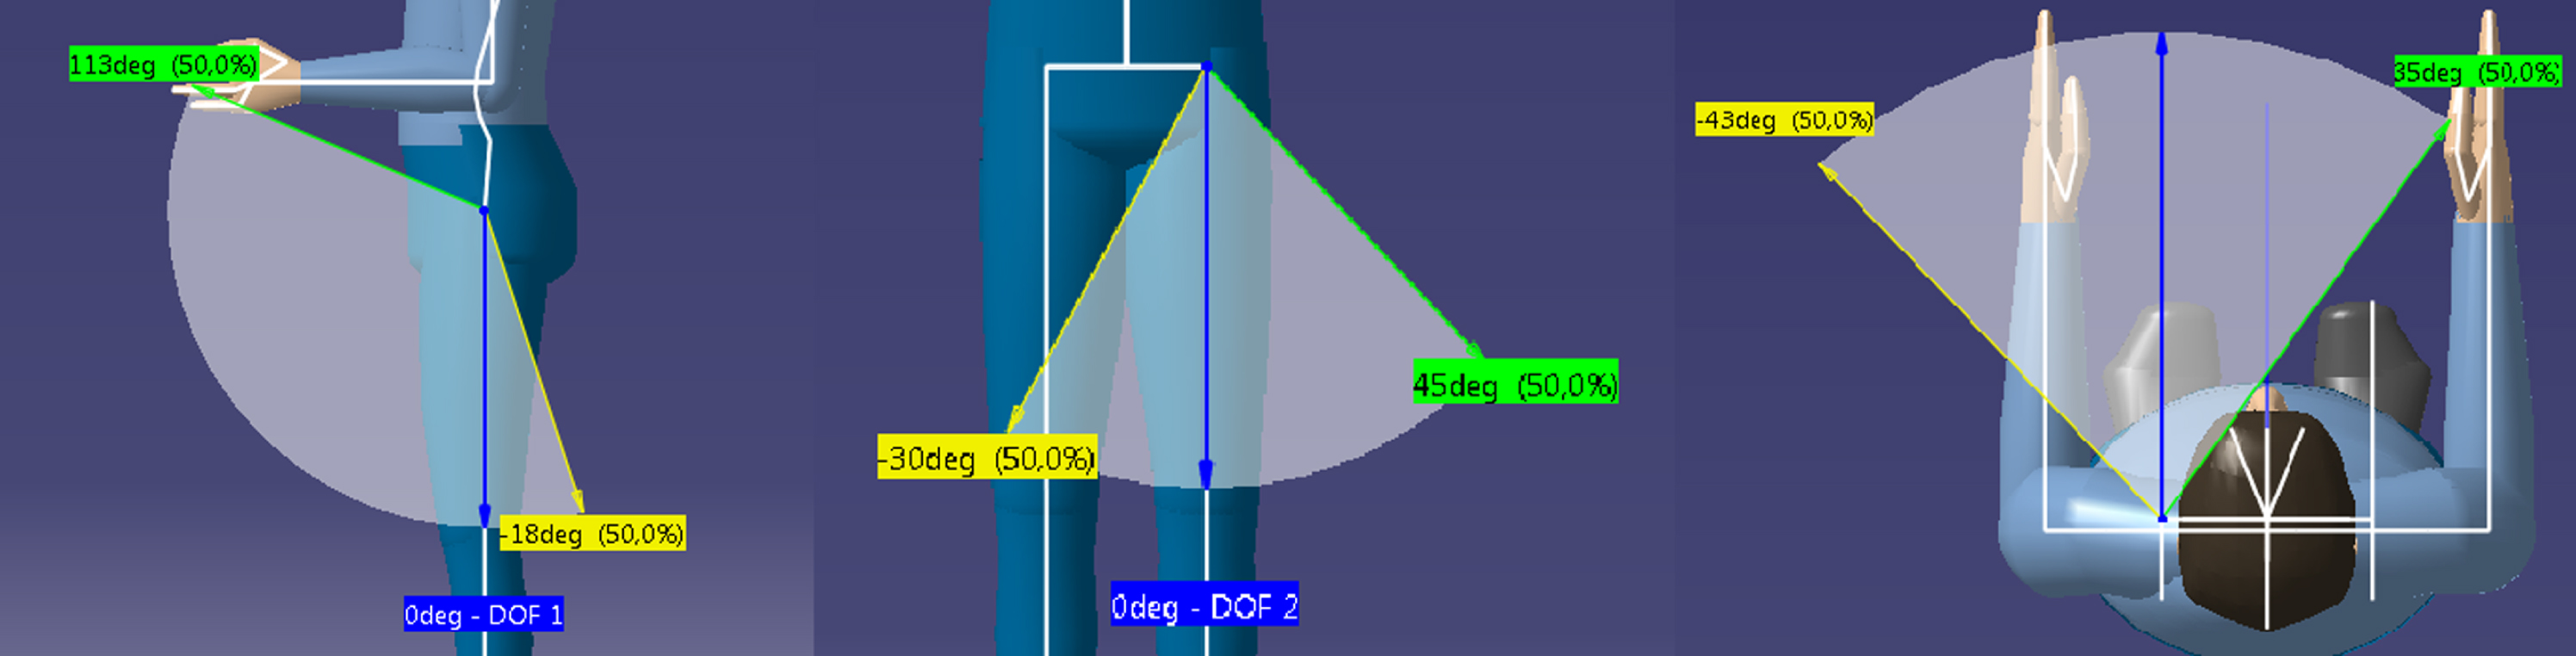
Thigh Degrees of Freedom.
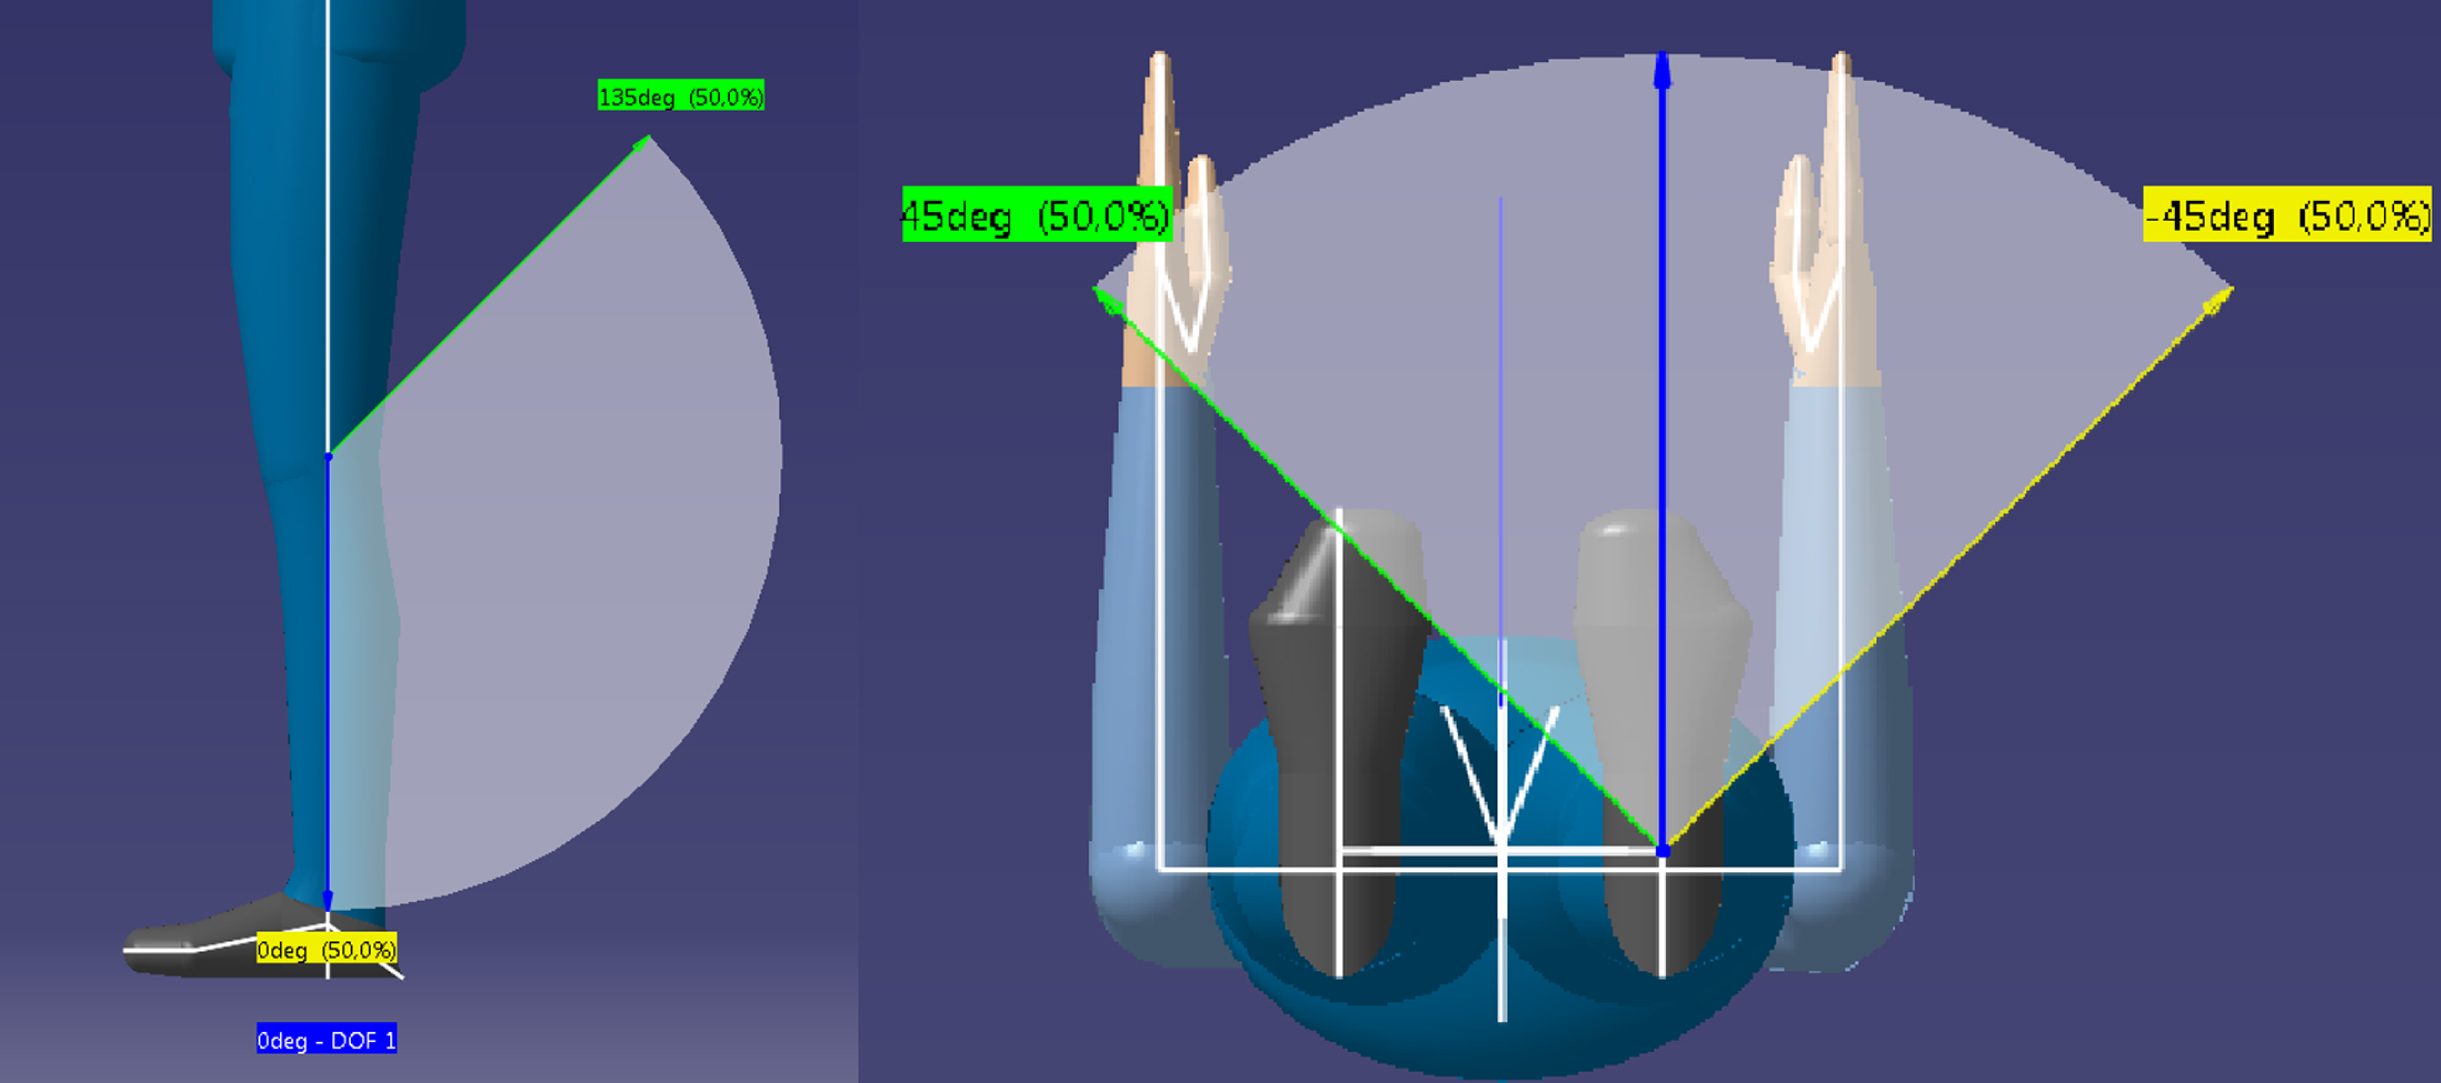
Knee Degrees of Freedom.

Ankle Degrees of Freedoms.
In order to perform a replicable measurement of the joints’ angles, reference points were set using the human body frame by Delmia® Software (by Dassault Systemes).
Data acquired during the experiments were organized and clustered towards subjects’ characteristics and by articular joints’ DOF and then processed using statistical techniques. The continuous distribution function for the RP population was calculated through inferential instruments. Once the appropriate distributions were chosen, the best representations were calculated using hypothesis testing in Minitab®17 software (Minitab, Inc, State College, PA), and each RRP was defined as the range within the II and III quartiles of the density probability distribution. The analyses were made distinctly for male and female samples due to the noted differences in the results.
For the hip, only the flexion was considered because in a seated position the extension cannot be performed and measured (Fig. 6). The male hip flexion distribution is a Weibull distribution; the mean value is approximately 83° that is far from the geometric zero because of the seated position but close to 90° that represents one of the most comfortable postures felt (mostly for the back, whose movements are linked to the hip and thigh postures). The same distribution was found as the best for describing the female hip flexion.
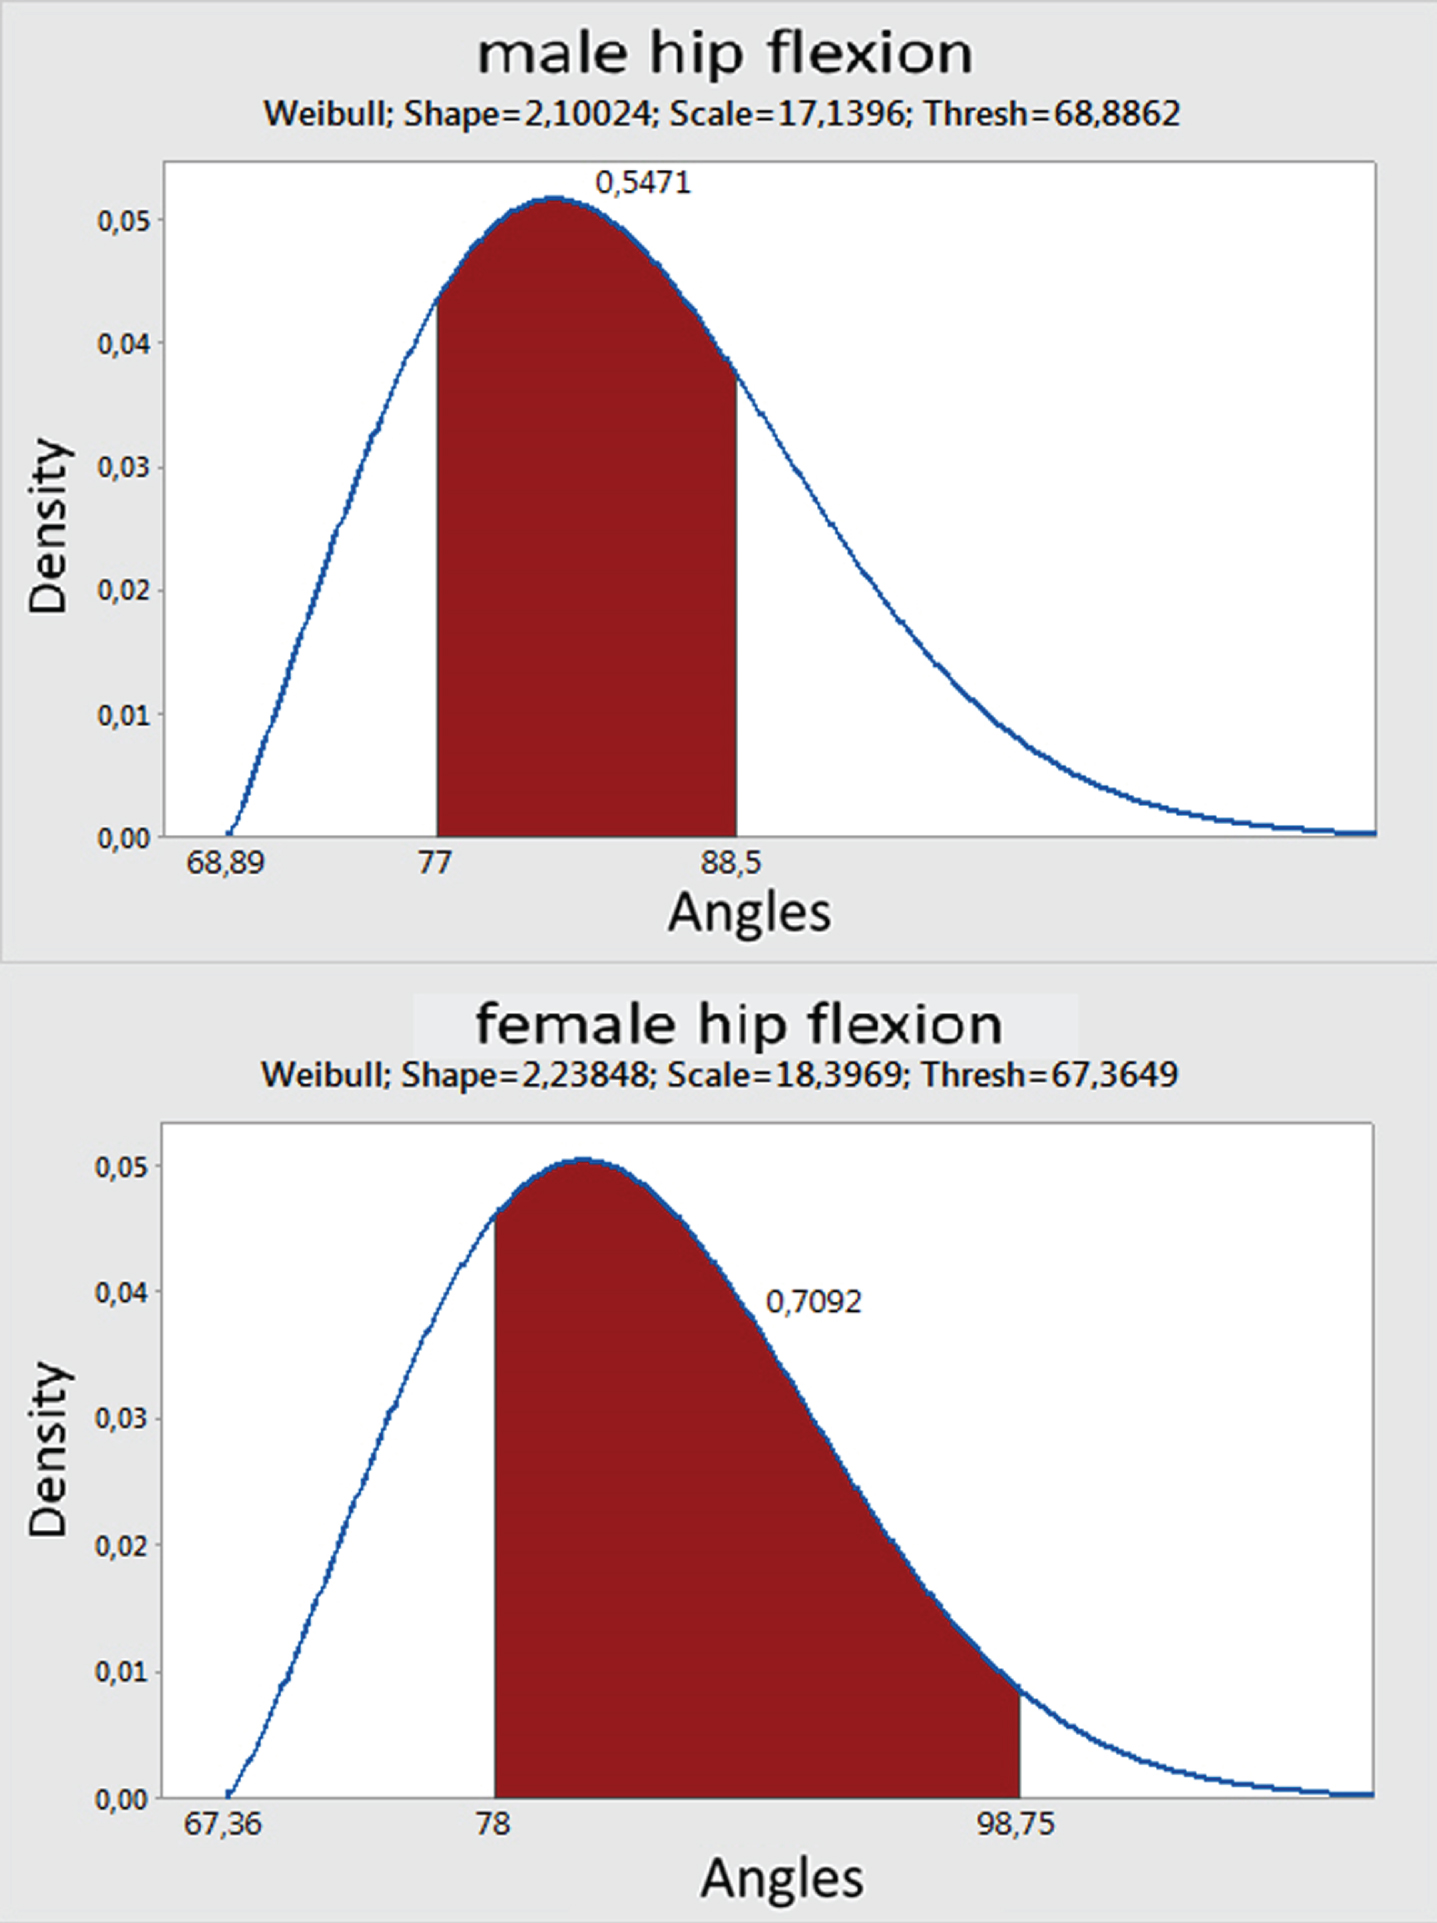
Male and female hip flexion.
The male and female hip add/abduction distribution is Weibull (Fig. 7). In the male case, the mean value is approximately 7° and the curve is mostly shifted toward high values of abduction. In the female case, the curve is centred around the geometric zero.
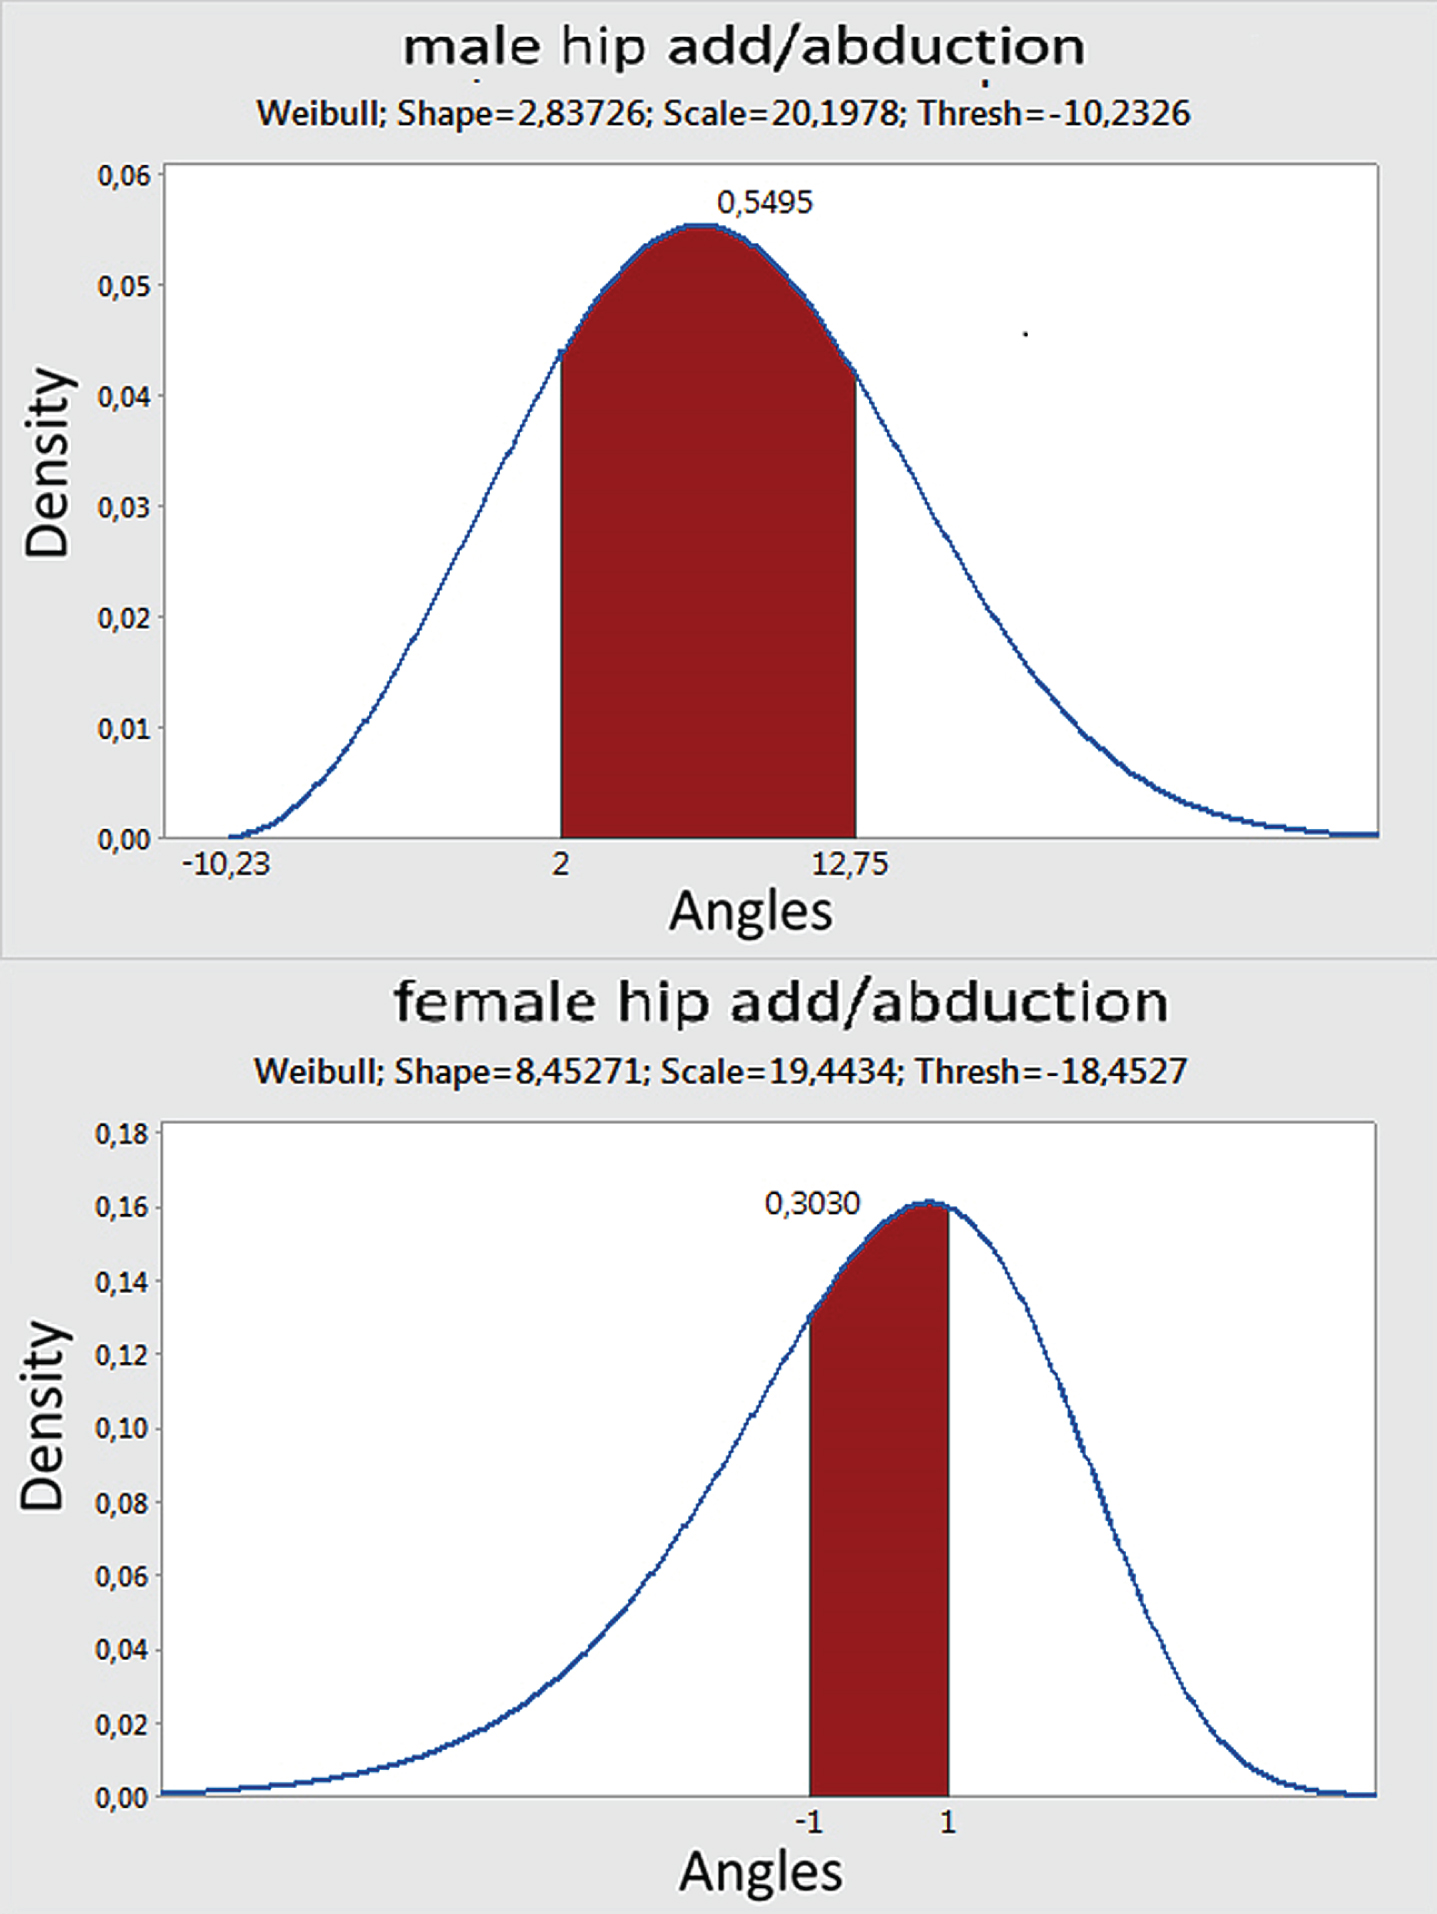
Male and female hip add/abduction.
In the case of hip rotation, the male and female distributions (Fig. 8), are different: the male data show a “smallest extreme value” distribution with the main value approximately equal to 5° and a curve that tends towards the right part of the ROM while the female data show a “largest extreme value” distribution, with the main value approximately equal to 7° and a quite symmetric curve; results show a male preference for external rotation.
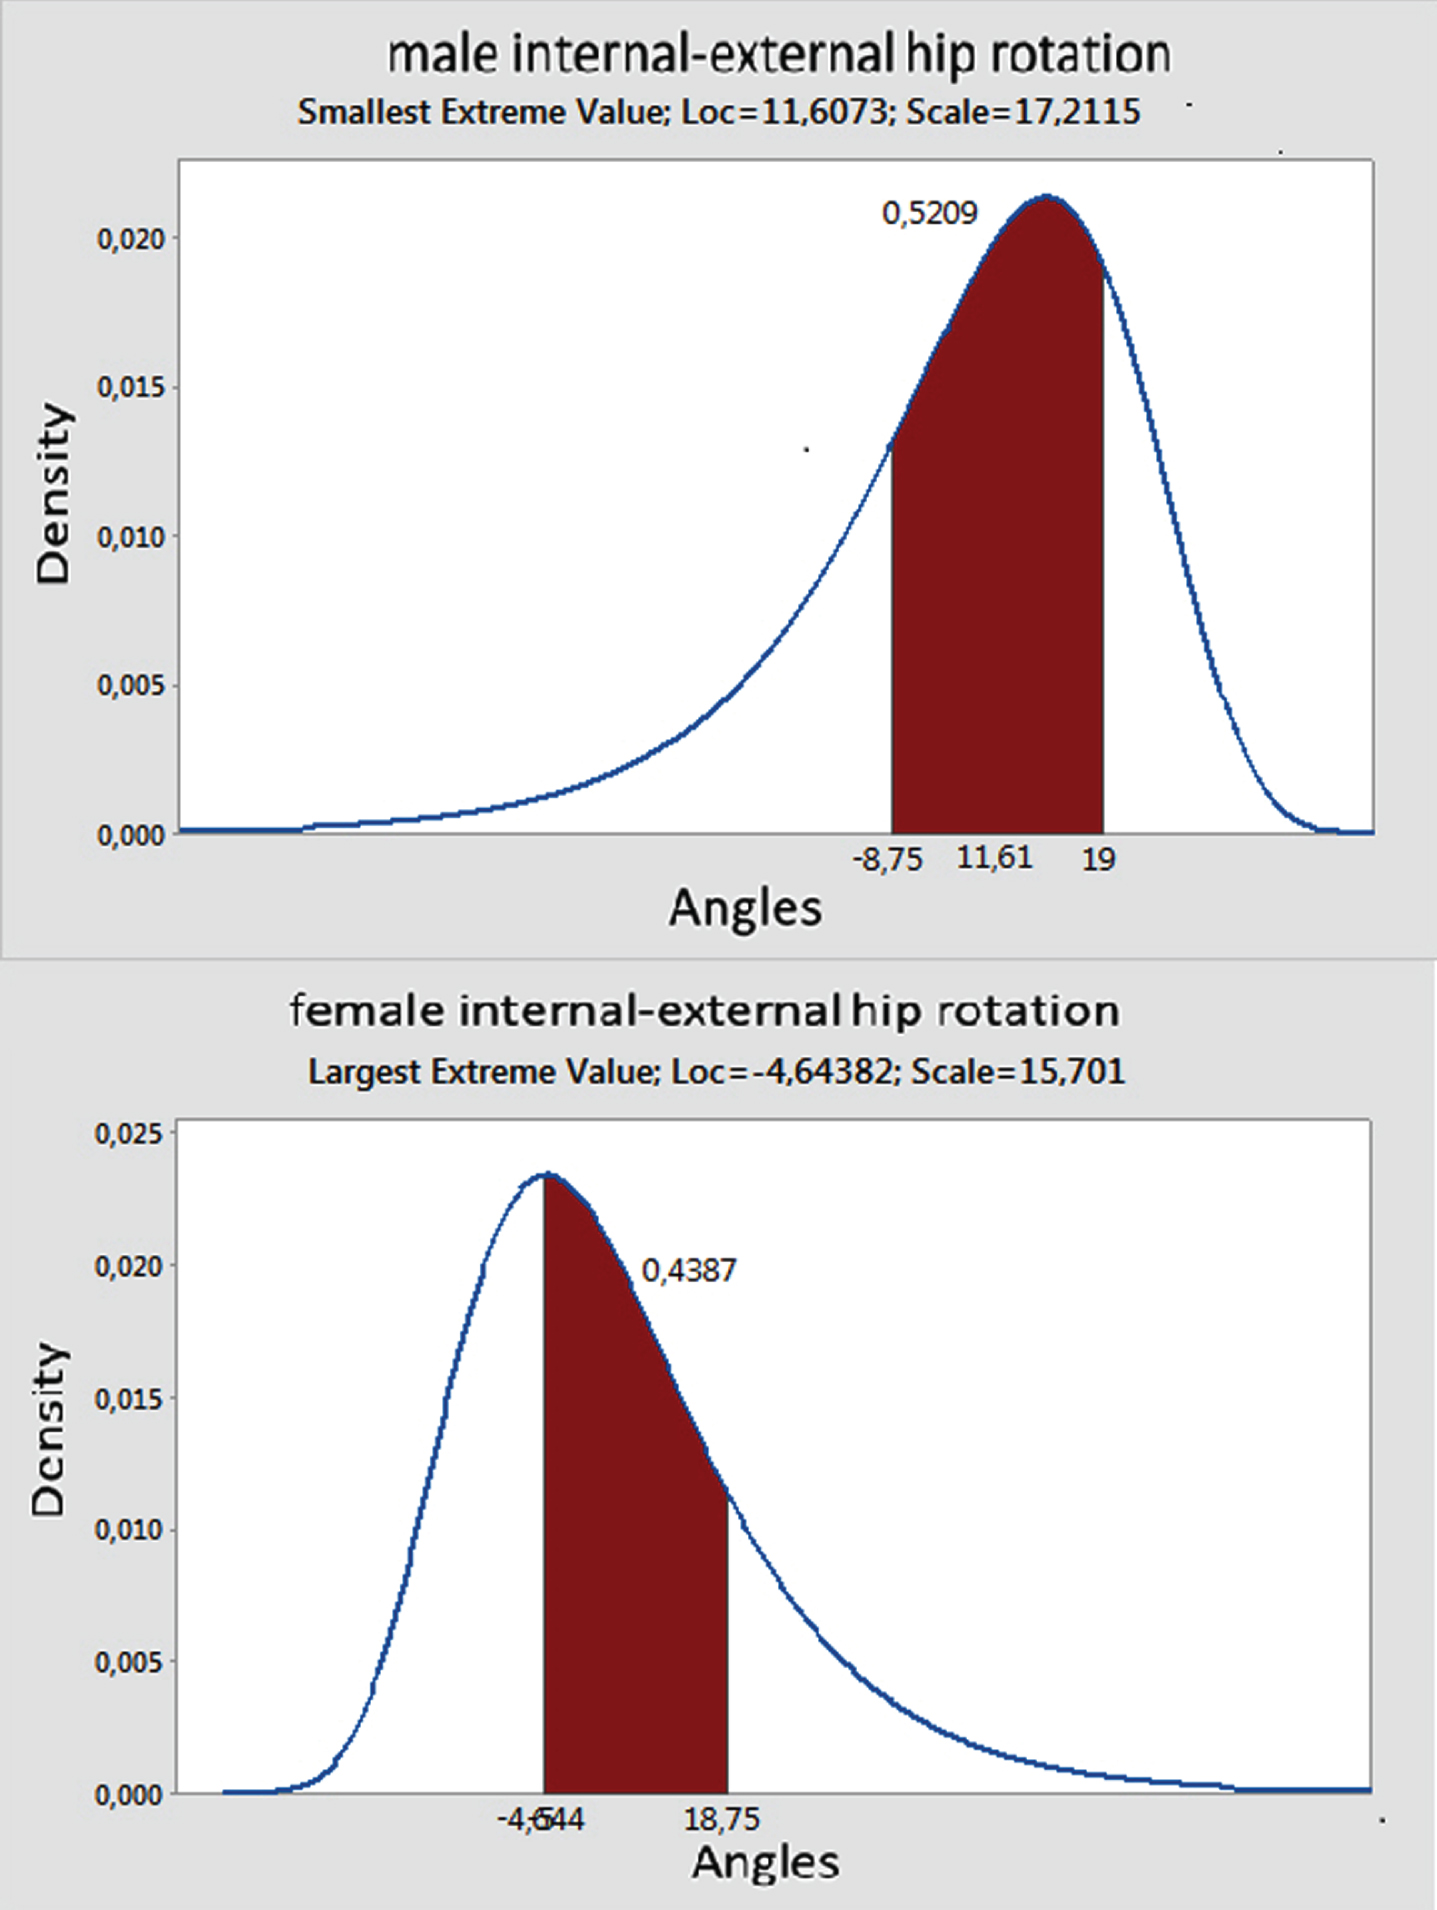
Male and female internal/external hip rotation.
In the case of knee flexion/extension, the male and female distributions are different; as shown in Fig. 9, the male data show a normal distribution while the female data show a log-logistic one. In both cases, the main value is 81°, but the log-logistic distribution is stretched to the right part of the ROM.
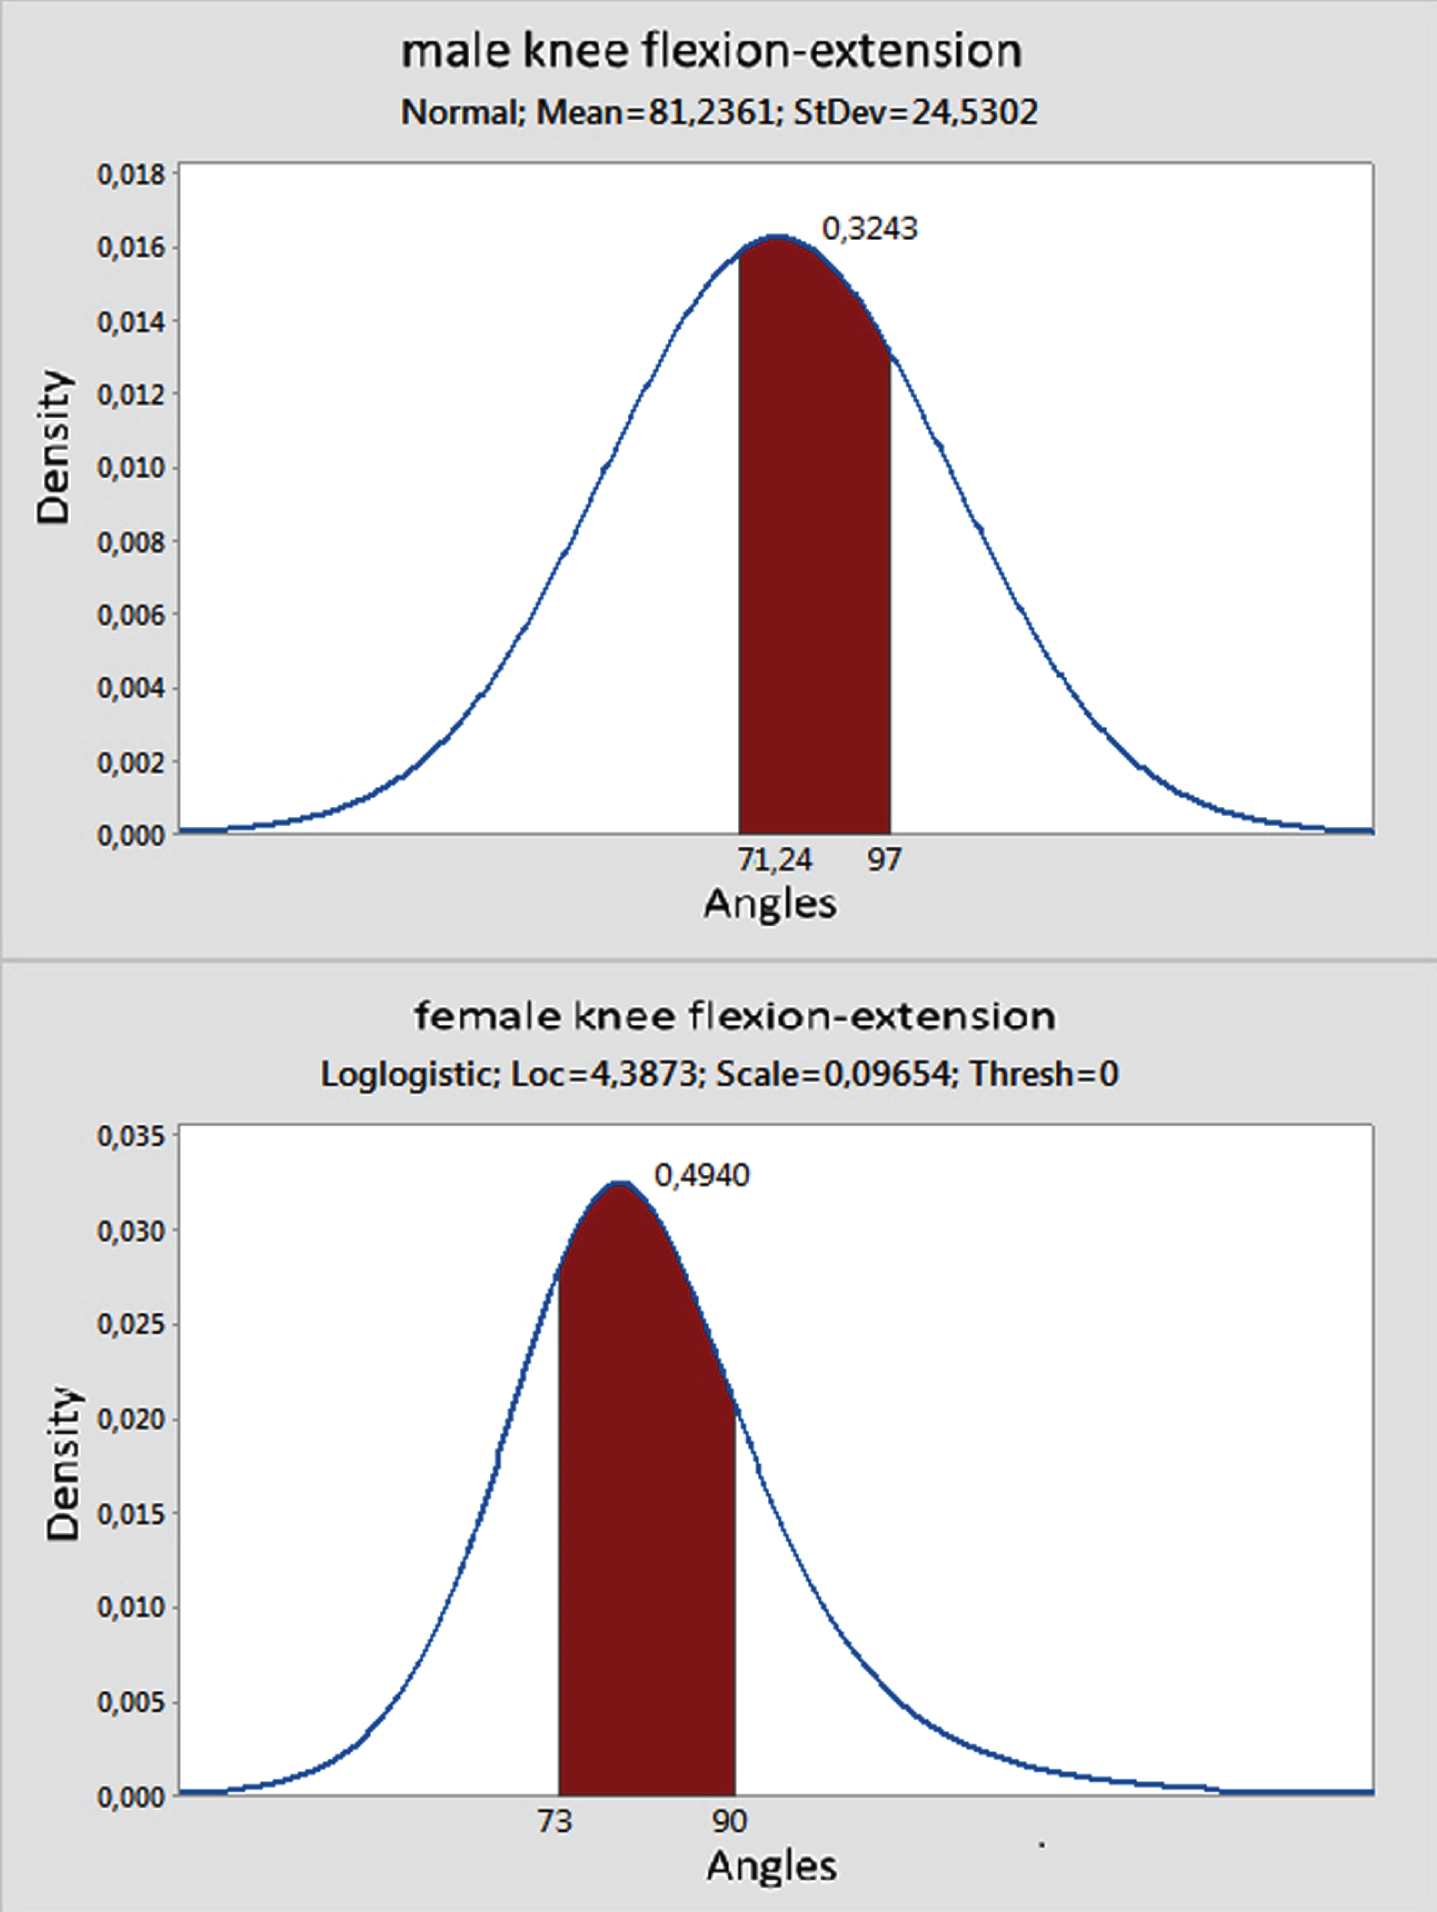
Male and female knee flexion/extension.
The distribution for the male and female knee rotation is a Weibull curve in both cases (Fig. 10). In the male case, the curve is not symmetric but stretches towards the right part of the ROM, showing a male preference to external rotation. The female distribution, instead, is quite symmetric toward the mean value, near to geometric zero.
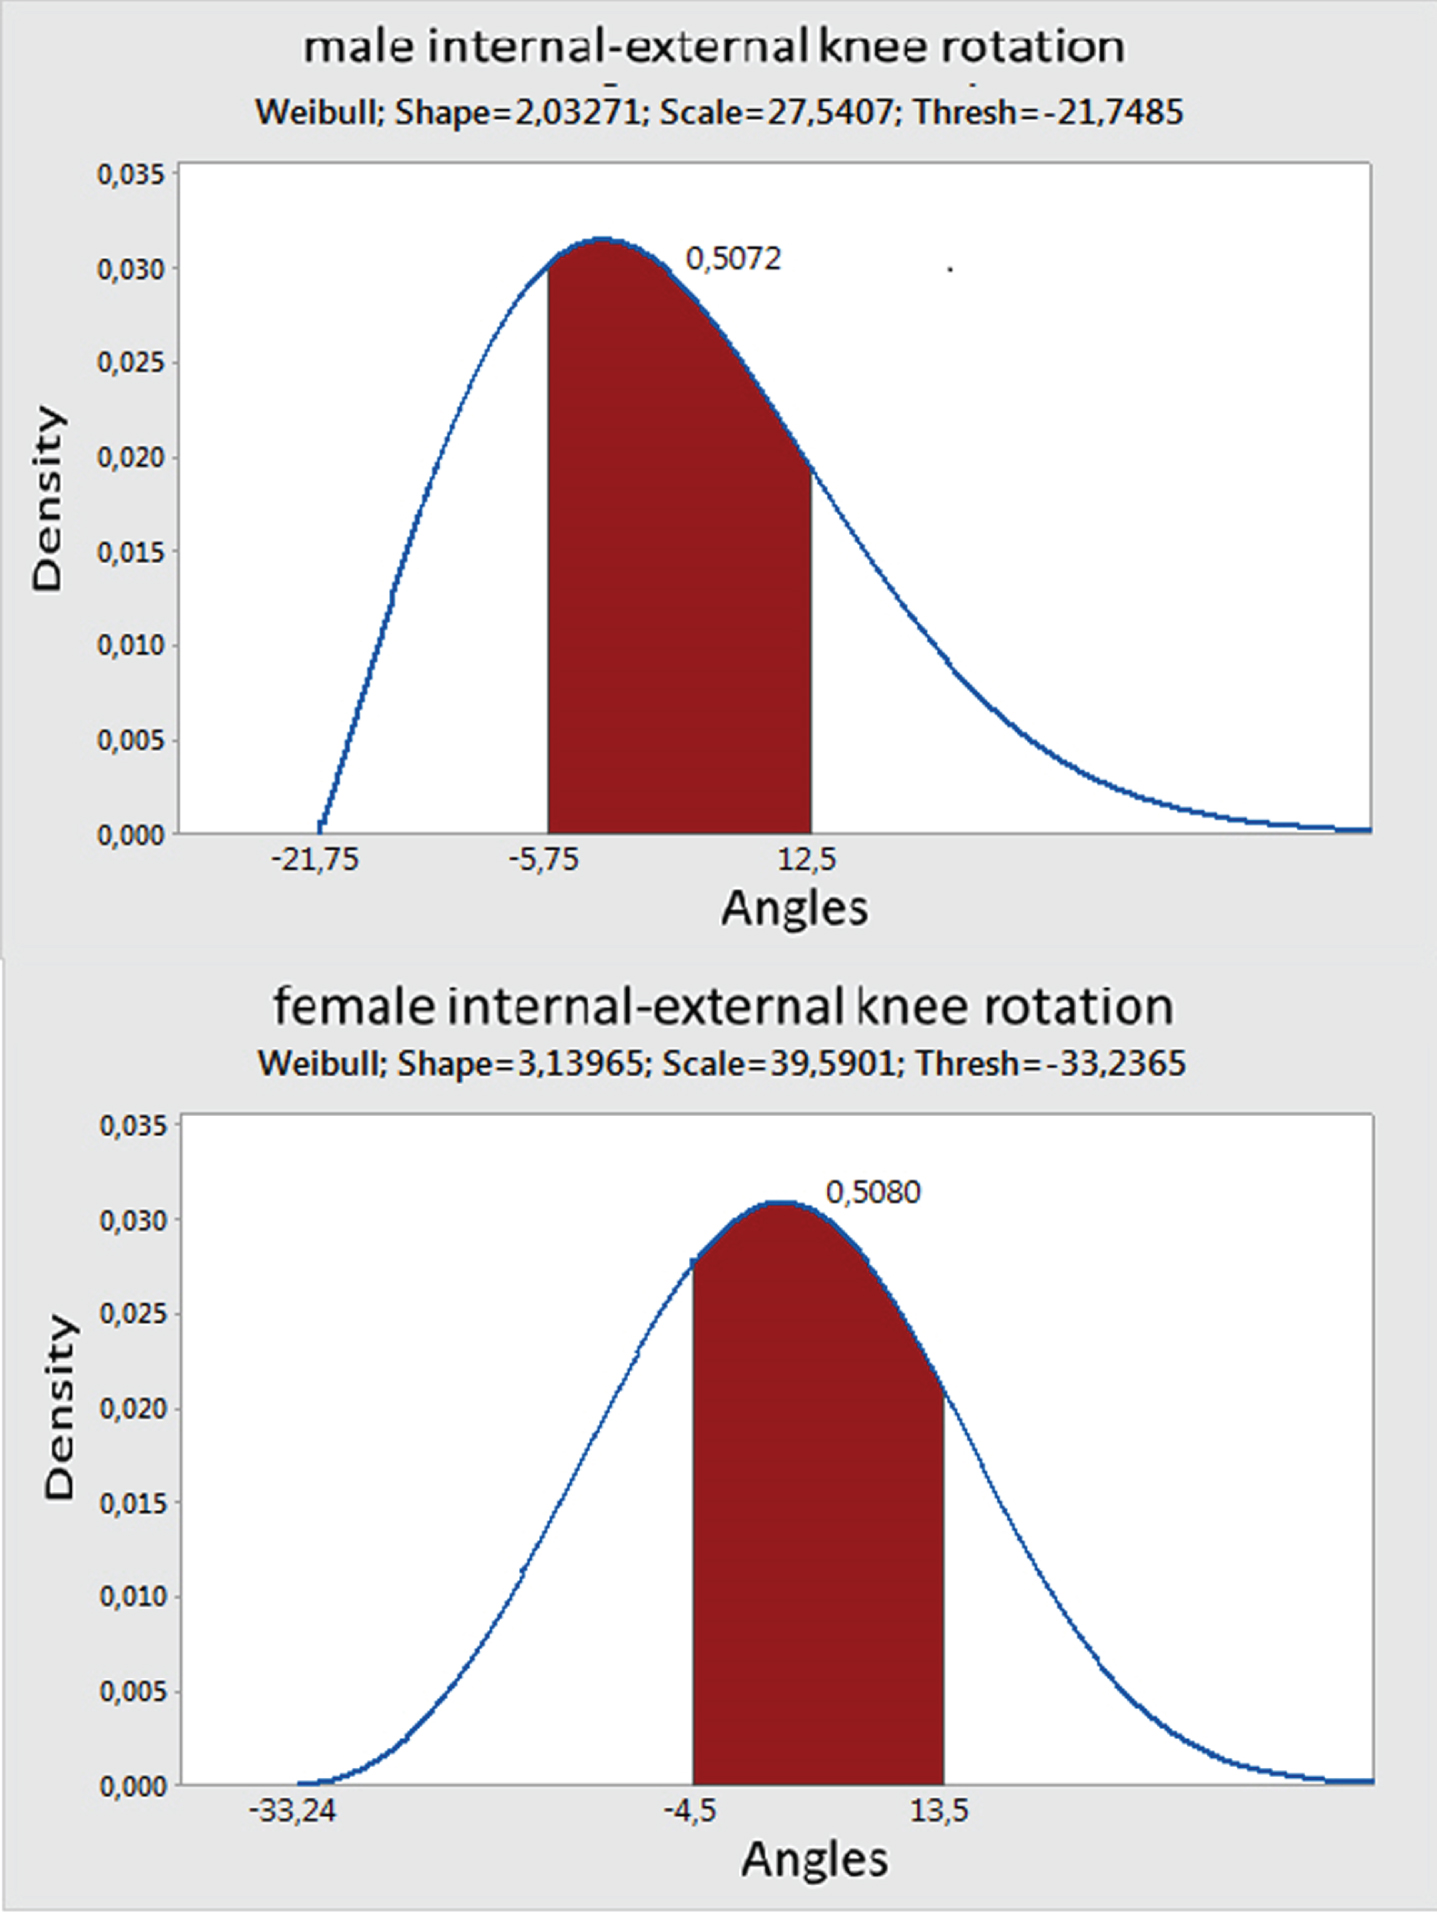
Male and female internal/external knee rotation.
In the case of dorsal-plantar ankle flexion, the male and female distributions differ again each other (Fig. 11): The male data show a “smallest extreme value” distribution while the female data show a Weibull distribution. In both cases, the average value falls inside the dorsal flexion area because the curves stretch to the left.
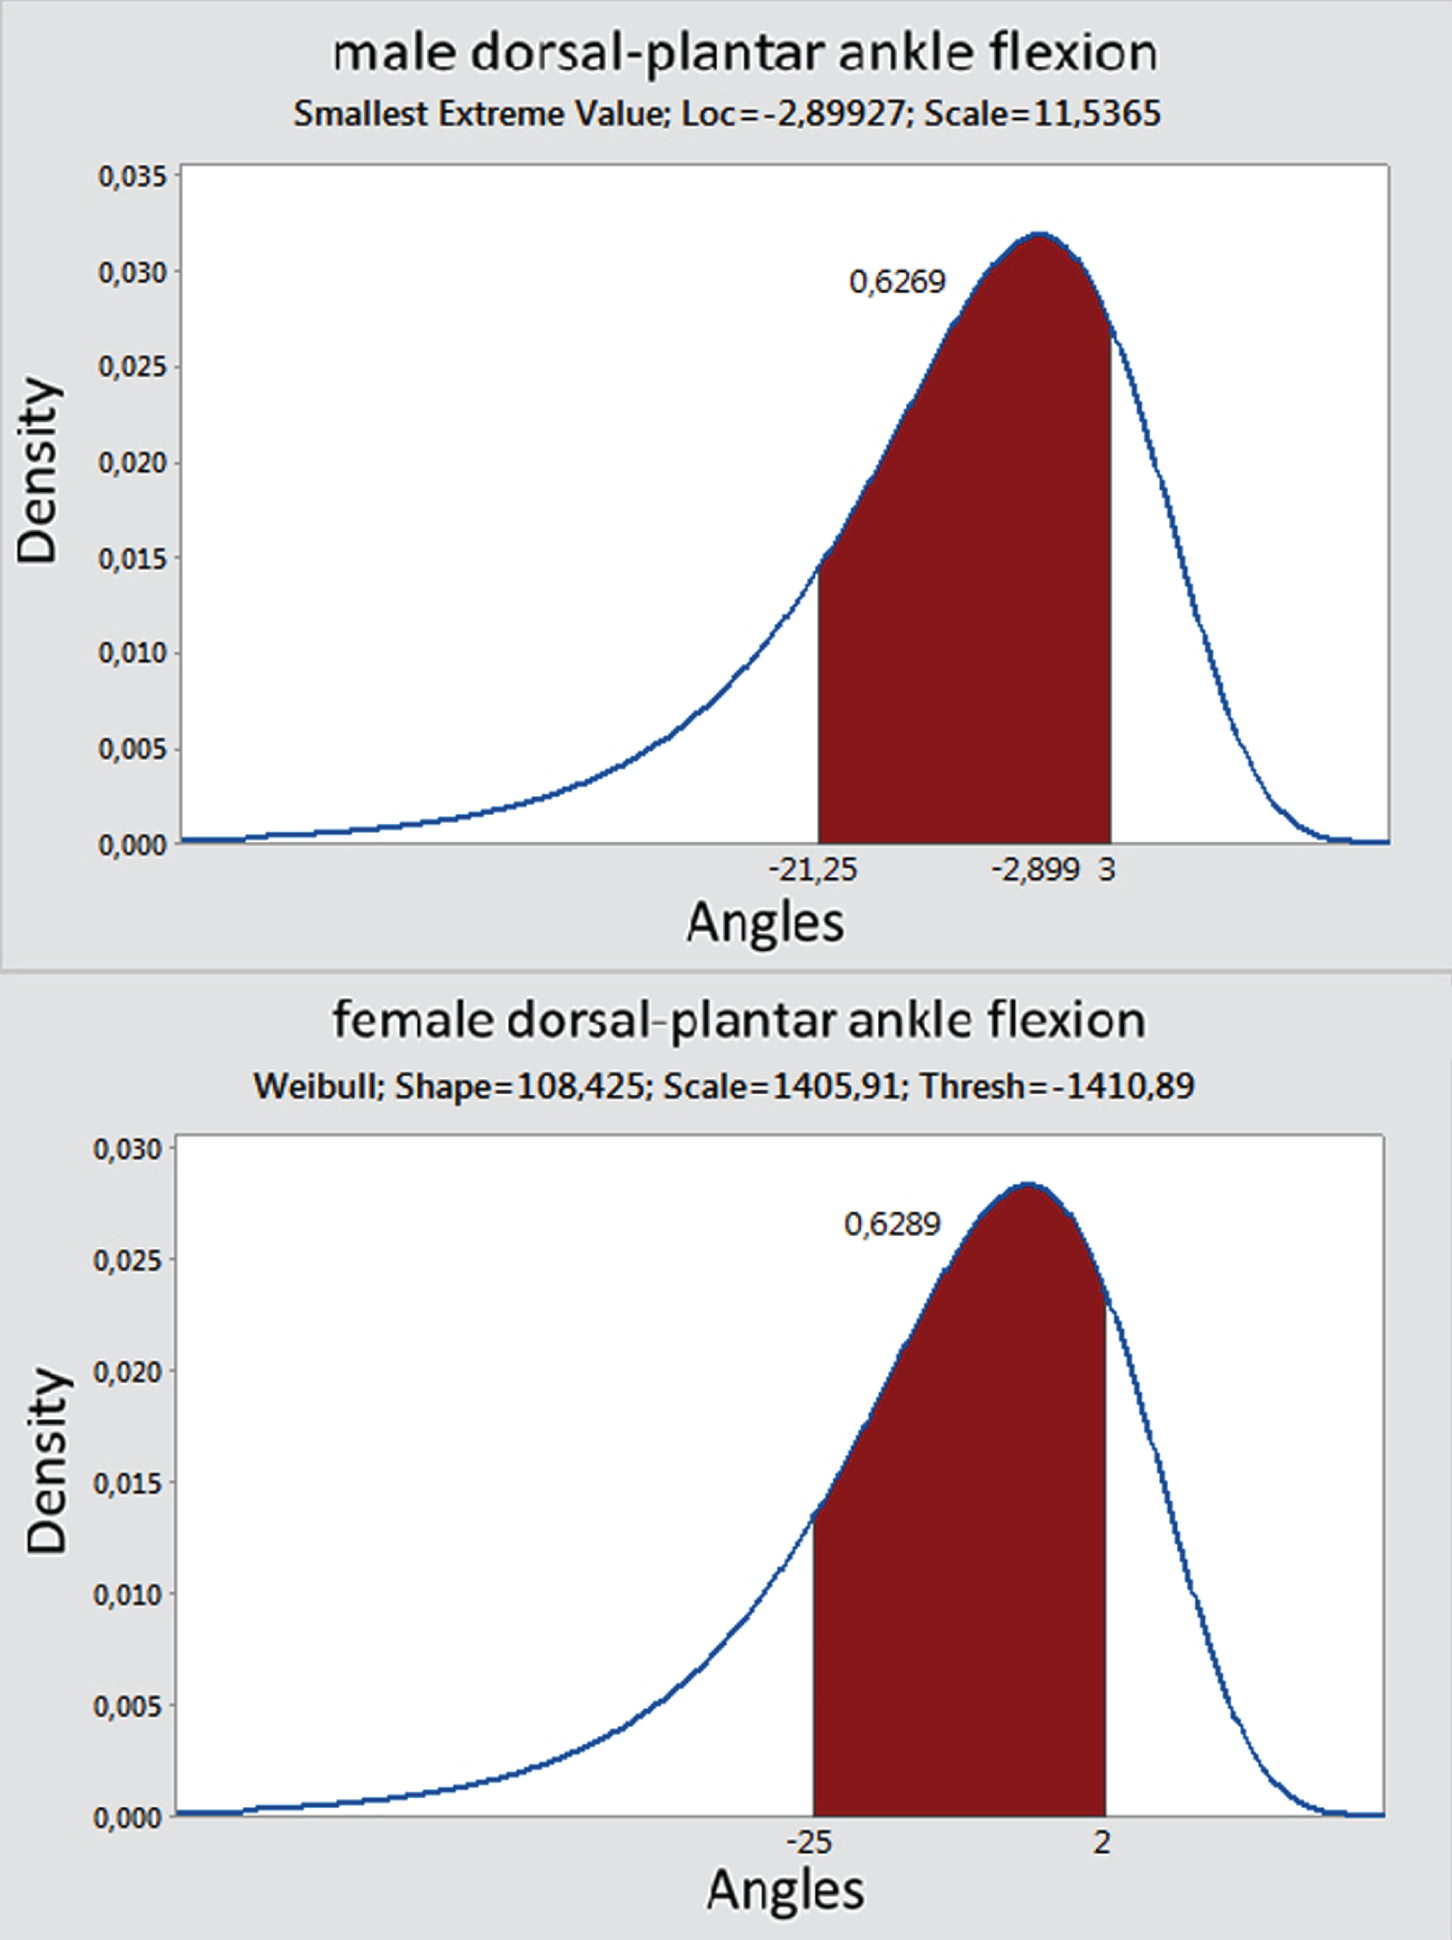
Male and female dorsal-plantar ankle flexion.
Table 1, Figs 12 and 13 shows the RRP for both male and female populations; we can define as a global range of a joint for the whole sample, the range between the lower bound given by the minimum value among male and female populations, and the upper bound given by the maximum value among male and female populations. The male and female RRPs differ each other because of the different body structure between the genders [41]. Table 2 shows the values of joints’ angles in which the Maximum Level of Comfort (MLC) is “statistically” perceived.
Range of Rest Postures
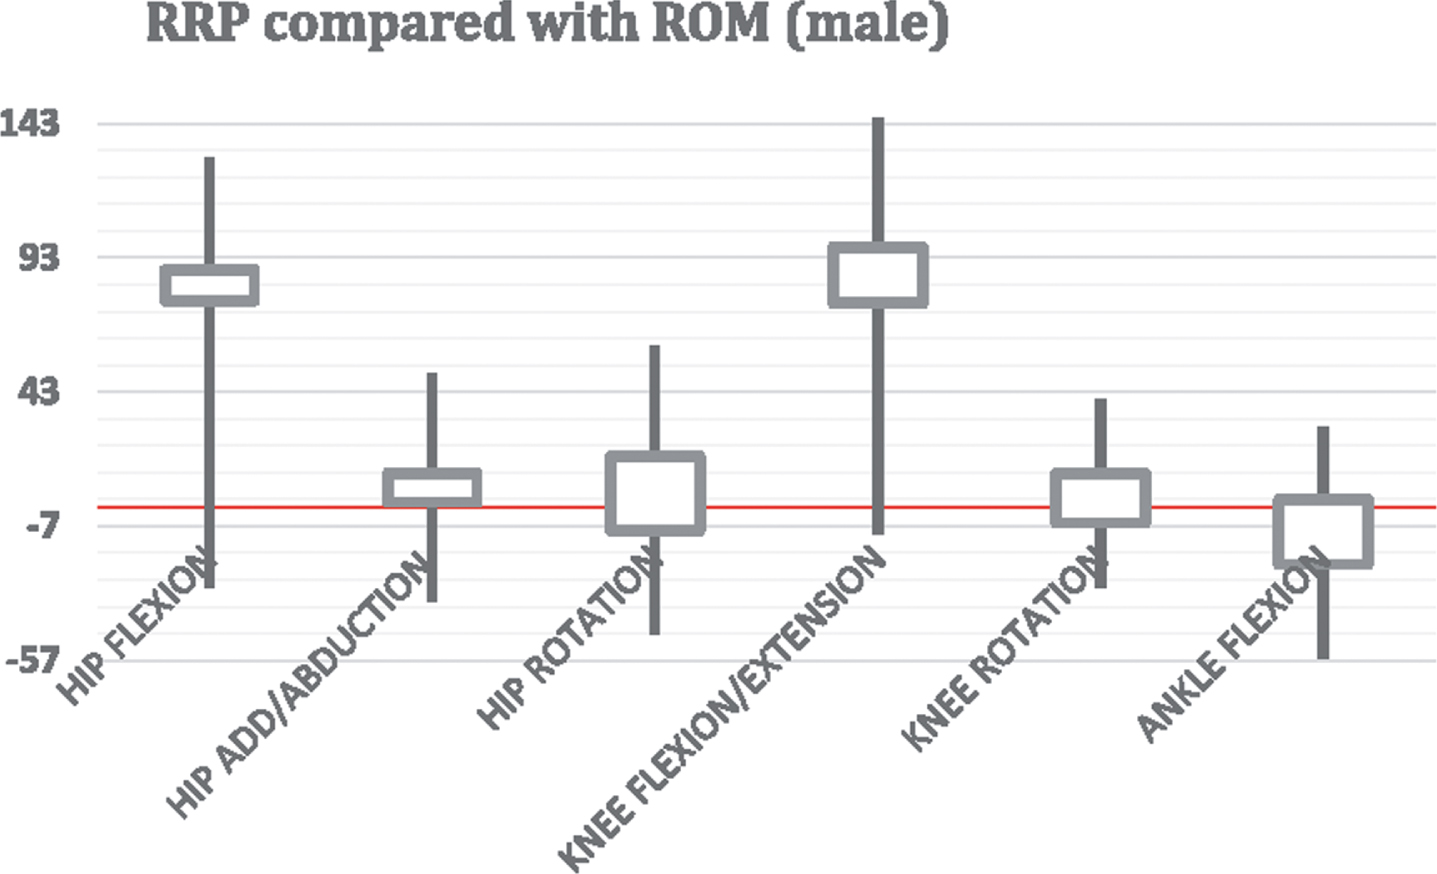
RRP vs ROM values. RRP = Range of Rest Postures, ROM = Range of Motion.

RRP vs ROM values. RRP = Range of Rest Postures, ROM = Range of Motion.
MLC positions for Males and Females
The main purpose of the study on which this paper is based to give an answer to the research questions:
How the behaviour of lower limb joints can be identified and described?
How the Range of Rest Posture (RRP) inside the ROM can be quantified and located to investigate further the CROM?
The authors show that lower limbs behaviour can be investigated using the same techniques used by physiatrists when they have to evaluate the functionality and the health of a human joint. On the bases of physiatrist experience, an experimental setup has been designed and realized in-lab in order to perform tests and acquire data about the upper limbs joints behaviour. Data were acquired in such a way that did not affect the comfort perception itself and in order to have a quite big data set for statistical inference and statistical analyses.
The synthesis of results has been shown in the form of graphs about the ROMs, statistical distribution and values for the RRPs. Several differences between male and female were found, highlighted and partially explained (It was not a purpose of this study).
Limitations of the study
The first limitation is related to the age and the distribution of the sample. Only students and young professors have been used to perform the tests. Even if it allows to fulfil the “healthy people” requirement, it is a limitation because the results are not representative of the whole population. Nevertheless, the experimental/assessment method is clear and the study can be easily extended to other people belonging to other age-range.
Another limitation is due to the performed tests. As shown, in order to fulfil the guidelines given by physiatrists about the ROM measurement, some tests had to be performed in a seated position and in laying position; as obvious, in this configuration, the loads on joints, ligaments and muscles change. It is needed to plan special tests in order to make the results usable for all load configuration.
Another limitation of the study is represented by the lack of analysis of the combined movements of lower limbs joints: these combined movements change the values of joints ROMs. Nevertheless, combined movements did not affect the results of our analyses and can represent a future development in studying complex postures and their related RRPs (if changing).
Finally, tests have been performed in static posture; it means that the results can be applied only for static and quasi-static application and need a revision if they want to be used for a dynamic application.
Conclusions
The needs of improving the ergonomics of the every-day life of people, and in particular of workers inside the companies, and to check for increasing comfortably working environment, push researchers and designer to look for the best way to do that in an easy and cheap way. It is widely demonstrated that the use of virtual prototyping both in working environment modelling and in Human-machine Interface simulation plays a key role for the future development in Human Factors and Ergonomics related issues. A method to predict the perceived comfort while performing a task is one of the essential steps for realizing this target and postural comfort is the most involved aspect of general comfort when dealing with working postures. As made in the past for the upper limbs [34], authors want to investigate the functions (curves) that describe the perceived postural comfort for a defined posture (given by the angles of upper limbs itself). To do that, the ROM and the RRP have to be investigated. This paper shows how the authors did that and the results of a wide experimentaltrial.
In the first part of the study, the authors defined the anthropometric parameters capable of describing the degrees of freedom (DOF) of upper limbs and their spatial movements. The planned experiments allowed to investigate the perception due to different postures in three configurations (standing, lying and seated) as suggested by physiatrists. Acquired data allowed to define, for each joint, CROM as the domain of the comfort function and RRP as a characteristic angular range of the human body in resting positions.
The experimental tests were made on two different wide statistical samples (male and female) so that the probability that acquired data are affected by unforeseeable or illogical errors is very low. Acquired RRP data were processed by statistical inference instruments to obtain continuous curves describing the probability distribution of the rest postures whose characteristics like mode and underlying area were calculated. The first research question was responded through the description of the research method and design of experiments.
RRP and MLC of lower limbs have been highlighted, for male and female through the analysis of the II and III quartiles of distributions to give us the answers to the second research question.
The next step of research, about the identification of Curves of (dis)comfort for each lower limbs joints, can be based on findings of this paper such as in Naddeo et al. [34].
The integration of upper limbs and lower limbs comfort curves inside a software for virtual postural comfort assessment will create a powerful instrument, to be implemented in Digital Human modellers (like DELMIA®), for a preventive comfort analysis during the HMI simulations. This instrument seems to be required both by scientists [44] and designer [45] for improving the method for comfort assessment. Finally, this feature will open the way to the realization of the comfort-driven design method, as explained in [46].
Conflict of interest
None to report.
Footnotes
Acknowledgments
The authors acknowledge the contribution of Damiano Fortuna for his support. Many thanks to the students of last year’s Mechanical and Management Engineering class (2017), who gave us their time and patience in carrying out many hours of testing.