
Abstract
BACKGROUND:
Physical employment standards (PES) ensure that candidates can demonstrate the physical capacity required to perform duties of work. However, movement competency, or an individual’s movement strategy, can relate to injury risk and safety, and therefore should be considered in PES.
OBJECTIVE:
Demonstrate the utility of using artificial intelligence (AI) to detect risk-potential of different movement strategies within PES.
METHODS:
Biomechanical analysis was used to calculate peak flexion angles and peak extensor moment about the lumbar spine during participants’ performance of a backboard lifting task. Lifts performed with relatively lower and higher exposure to postural and moment loading on the spine were characterized as “low” or “high” exposure, respectively. An AI model including principal component and linear discriminant analyses was then trained to detect and classify backboard lifts as “low” or “high”.
RESULTS:
The AI model accurately classified over 85% of lifts as “low” or “high” exposure using only motion data as an input.
CONCLUSIONS:
This proof-of-principle demonstrates that movement competency can be assessed in PES using AI. Similar classification approaches could be used to improve the utility of PES as a musculoskeletal disorders (MSD) prevention tool by proactively identifying candidates at higher risk of MSD based on movement competency.
Keywords
Introduction
Physical Employment Standards (PES) are used to select and retain workers that demonstrate the physical capacity to complete the essential duties of work [1, 2]. PES are common in public-safety-related occupations and have been developed and implemented in firefighting [3], police [4–6], corrections officers [7], military [8], and wildland firefighting sectors [9] among others. By implementing PES in public-safety-related occupations, only those candidates that can demonstrate the physical capacities required to perform the essential job duties (i.e., Bona Fide Occupational Requirements) continue with the hiring process. However, PES also play an important role in many other occupations, and in particular, those that require manual materials handling. When PES are applied in non-public safety related occupations, in some jurisdictions it is common to administer PES post-offer (also known as a post-offer employment test or POET). When applied post-offer the results of the PES do not directly affect the hiring process, but instead PES results inform job placement within a prospective company using a job-matching approach [10, 11]. From a theoretical perspective, it is believed that fewer workers will experience work-related musculoskeletal disorders (MSD) if they are placed into jobs best matched to their physical capabilities, as determined using a PES.
Data exist to demonstrate the utility of PES as an MSD prevention tool, but the prognostic ability seems to be dependent on more than an individual’s physical capacity alone. For example, Legge et al. [12] used a PES inclusive of job-specific test components in a prospective cohort study to identify if a job specific PES was predictive of musculoskeletal injury. The study reported that the probability of a worker suffering a manual materials handling injury was 3 times higher among workers who did not demonstrate the minimum physical capabilities for the job [12]. This was consistent with a previous prospective cohort study demonstrating improved prognostic ability when PES components were matched to job requirement, but poor prognostic ability of strength-based measures alone [13]. Considering evidence [12, 13] and contemporary theory [14, 15], the relationship between PES performance and injury risk may be strongest when PES are designed to closely replicate the physical demands of the job (i.e., simulation-based), both in terms of physical effort, and work layout and dynamic movement requirements. These findings suggest that an individual’s physical capability and the movement strategy they choose to leverage that capacity to meet the job requirements (herein referred to as movement competency) are likely mutually important when using PES as a prognostic tool for MSD prevention.
Although emerging trends in PES development are shifting towards administering PES as simulation-based tests [16, 17] that permit the ability to concurrently assess both physical capability and movement competency, limited attention has been given to objective movement competency assessment thus far. Our Demand-Capacity-Competency conceptual model (Figure 1) reinforces the importance of considering movement, where we suggest that movement can act as a fulcrum balancing between the physical demands of a job and an individual’s physical capability to meet those demands. Some individuals are likely able to demonstrate movement strategies best leveraging their physical capability (i.e., shift the fulcrum to the left), where others may not (i.e., shift the fulcrum to the right). One example of the importance of movement competency on the expression of physical capability was observed in research aiming to identify maximum acceptable weight limits in lifting. When participants leveraged their physical capacity by adopting a freestyle lifting-based movement strategy that allowed them to get closer to the load, they were able to comfortably lift more weight than when using a squat technique [18]. Continuing with a lifting focus, compressive and shear forces are directly dependant on how far away the lifted load is from the body [19–21]. Thus, compression and shear loads can be reduced when lifting the same absolute load by adopting a movement strategy that maintains the load closer to the body [22]. This is important because internal loading, including spine compression and shear, directly relate to the risk of developing an MSD [23, 24]. Conceptually, and theoretically, it is likely important to objectively evaluate both an individual’s physical capability and movement competency to maximize the prognostic ability of PES as an MSD prevention tool.
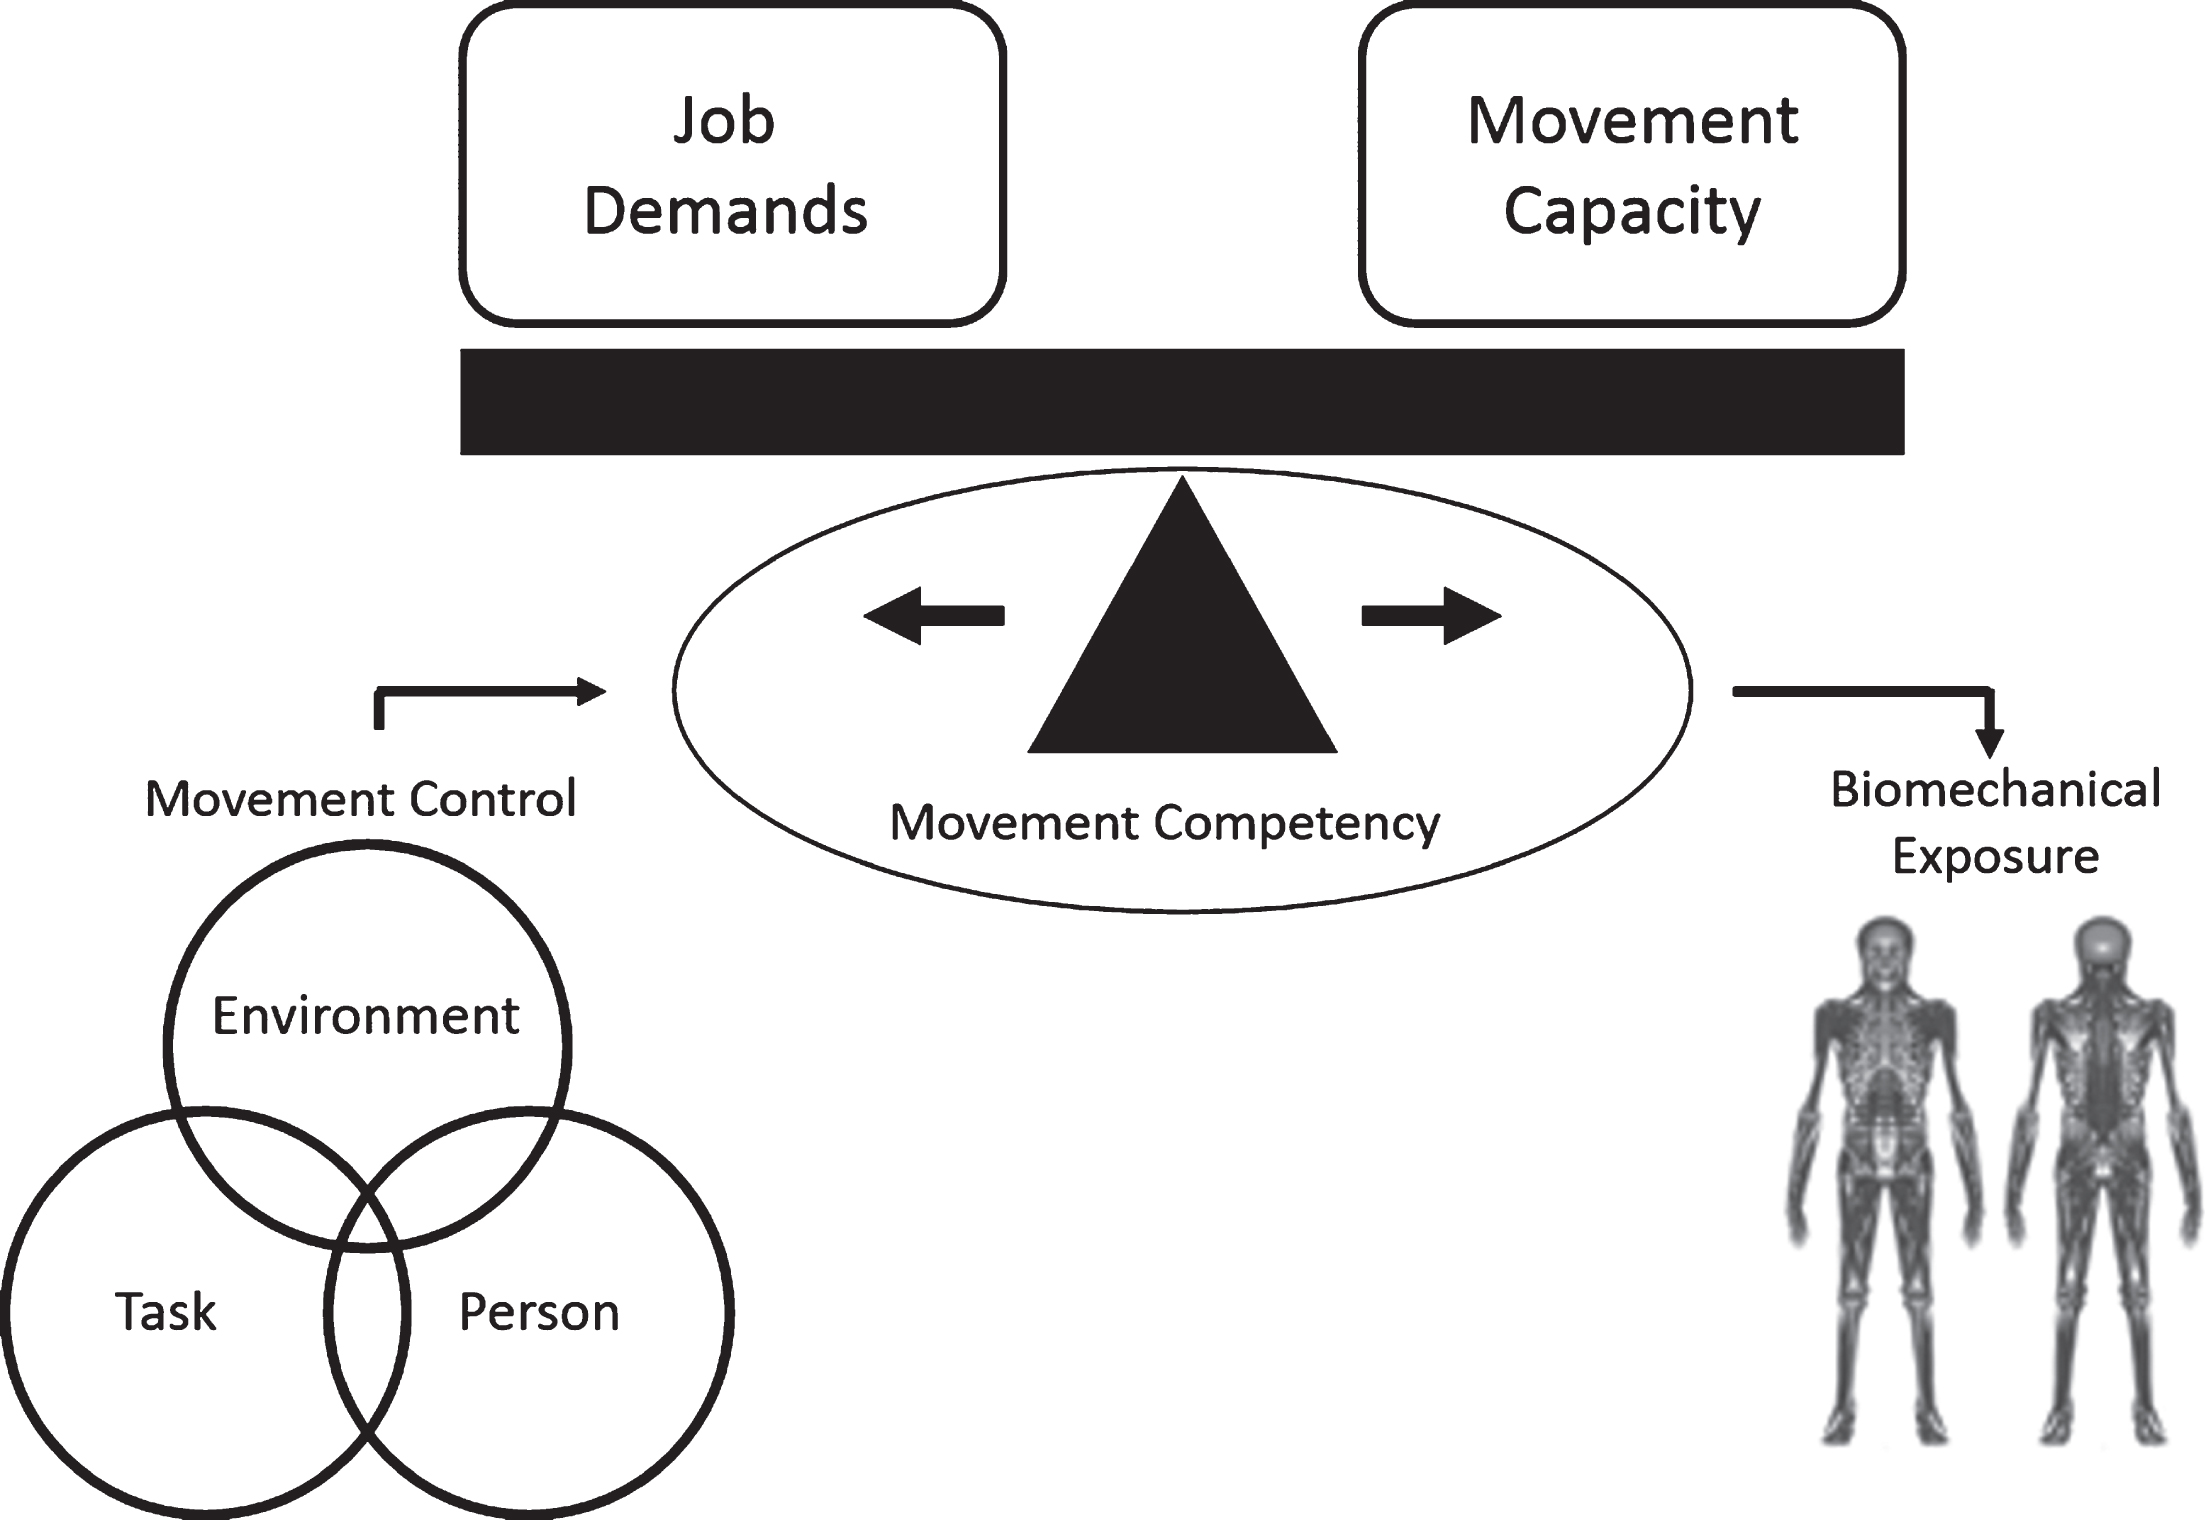
Demand-Capacity-Competency model with application to PES. The conceptual model aims to highlight the importance of movement competency in determining if and how an individual is able to express their physical capabilities with respect to the physical demands of a job. Additionally, the model serves to illustrate how movement control (e.g., using Newell’s model of interacting constraints [25] as an overarching theory of motor control) can determine movement competency, which in turn dictates biomechanical exposures and ultimately MSD risk.
Advances in artificial intelligence (AI) may provide unique tools to support movement competency assessment in PES. Recently, machine-learning-based AI approaches using principal component analysis (PCA) have detected differences in movement strategies between novice and elite athletes when performing a battery of functional ability assessment tasks [26] and during the performance of sport-specific actions [27]. This AI-based approach is originated in work by Troje [28] who applied PCA as a pattern recognition tool to identify differences in gait patterns between males and females. After reducing the data using PCA, machine learning techniques, such as linear discriminant analysis (LDA) [26, 28], can then be used to classify and visualize different movement strategy patterns. Applied to a PES context, the application of pattern recognition and machine learning techniques (collectively termed AI) may help to distinguish between those that optimally leverage their physical capacity in a manner that minimizes their biomechanical exposures (“low”) versus those that do not (“high”).
The purpose of this paper was to provide proof-of-principle evidence to demonstrate how advances in AI can be exploited to inform movement competency assessment within a PES framework. To address this purpose, a movement assessment framework was applied [26] to identify and classify movement competency during the performance of the backboard lift [29]. For the purpose of this investigation, movement competency was operationalized as the ability to perform the required backboard lift (i.e., demonstrate the minimum physical capability), in a manner that minimized the relative biomechanical exposure (postural and joint moment loading) on the spine. Defined in this way, individuals that lifted with lower relative biomechanical exposure were considered to demonstrate better movement competency than those that did not.
Participants
A sample of 22 individuals participated in the study. The participant sample included 9 active-duty paramedics and 13 novices with no paramedic experience (Table 1). All participants were free of MSD for the 6-month period prior to data collection. This study was approved by the University of Waterloo’s Office of Research Ethics, and all participants provided informed consent prior to participation.
Participant demographics
Participant demographics
Participants were invited to the lab on two separate occasions. In the first session, participants completed a sub-maximal protocol to estimate their one repetition maximum (1RM) lifting capacity. In the second session, participants completed the experimental protocol, where each participant repeated a backboard lifting task. Each participant performed the backboard lifting task under three different weight conditions, where the weight on the backboard was normalized to each participant’s estimated 1RM lifting capacity (25, 50, and 75% of estimated 1RM, respectively).
Sub-maximal protocol to estimate one repetition maximum (1RM) lifting capacity
Prior to completing the sub-maximal testing protocol, participants provided demographic information including sex, height, weight, age, and experience specific to performing backboard lifting. A 10-repetition-maximum-based sub-maximal testing protocol [30] was modified to estimate 1RM lifting capacity during the performance of a backboard lift. However, backboard lifting is a two-person task, where each lifter is positioned on opposite ends of the backboard. To execute the two-person lift, a trained lifting partner lifted the opposite end of the board. To minimize the bias of the trained lifting partner on the participant’s movement strategy, participants were instructed to take the lead in counting and cueing the lift while the lifting partner closely followed the participant’s cues. One lifting partner was used throughout the study to minimize any confounding effects from the use of different lifting partners. No more than one participant was tested per day to minimize the influence of fatigue on the lifting partner.
Participants began the sub-maximal 1RM test by performing two familiarization sets where the load on the backboard was progressively increased. In the third set, the backboard was loaded with a weight that the participant believed they could lift repetitively for no more than 10 repetitions, where the actual number of repetitions completed prior to volitional fatigue was recorded. As a precautionary factor, a research assistant could also terminate the set (prior to the participant’s volitional fatigue) if the participant dramatically altered their movement strategy from that observed in the initial repetitions, particularly where the movement strategy might expose the participant to significant risk. The purpose of this safeguard was to prevent participants from suffering an injury as a result of an increased difficulty in controlling the backboard (load) as they fatigued. To estimate each participant’s 1RM backboard lift, Wathan’s regression equation [31] was used where the load on the backboard and the number of repetitions completed in the third set were used as input variables. The Wathan regression equation has been shown as a more accurate prediction of true 1RM capacity compared to other methods utilized in the strength and conditioning field [32], however, it is important to recognize that it is not a true 1RM max, but rather an indirect estimate.
Backboard lifting session
At least 24 hours following their initial visit, participants returned to the laboratory to compete a total of 30 backboard lifts, each separated with sufficient recovery. The lifting trials were divided into three blocks of 10 lifts; light, medium and heavy, corresponding to 25%, 50% and 75% of each participants’ 1RM, respectively. To address the confounding effects of familiarization of mass lifted and fatigue, the order of presentation of the lifted loads was randomized. To further minimize the influence of fatigue throughout the protocol, a mandatory 1-2 minute rest was taken after every lift, where an additional 3–5 minute rest was taken after every five lifts.
During the performance of each backboard lift, participants’ whole-body motion and ground reaction force data were recorded. Whole-body motion data were recorded using a 12-camera (six, Vantage v5; six, Vero v2.2) Vicon motion capture system (Vicon, Oxford, UK) at 100 Hz. Participants were outfitted with 86 passive reflective markers; 46 calibration markers placed on anatomical landmarks as required to define local coordinate systems for segments including the feet, shanks, thighs, pelvis, trunk, upper arms, forearms, hands and head; and, 40 tracking markers attached to 10 rigid body clusters (4 markers per cluster) which were used to track segmental motions while minimizing the potential for soft tissue artefact. Ground reaction force data were measured using two force platforms (Bertec Corporation, Columbus, OH, USA) embedded into the lab floor, where force data were recorded at 1000 Hz. All data were recorded and synchronized through the Vicon Lock Lab (Vicon, Oxford, UK).
Participants began each lift by placing their feet on the force platforms (one foot per force platform). The participant then cued the lifting partner to bend down to grasp the backboard to initiate the lift. A lifting trial consisted of the participants’ approach to the backboard and the lift of the backboard to the participant’s waist height. All lifts were performed with the lifting partner and participants were asked to lead all counting and cueing during each lift.
Data conditioning and analysis
The primary purpose of this paper was to provide proof-of-principle evidence demonstrating how advances in AI might be exploited to inform movement competency assessment within a PES framework. To achieve that purpose, motion and force data were conditioned and analyzed. First, motion data were conditioned using Vicon Nexus 2.6 (Vicon, Oxford, UK) software by inspecting and correcting mislabeled markers and by filling any gaps in the marker data. Gaps ≤200 ms in duration were filled via interpolation using a cubic spline, while gaps >200 ms were filled using a pattern fill or rigid body fill function built into the Vicon Nexus 2.0 software, consistent with best practice [33].
Second, force (kinetic) and correctly labelled and gap-filled marker data (kinematic) were imported into Visual 3D software (C-Motion, Germantown, MA, USA) for additional data conditioning and preliminary analysis. Kinematic and kinetic data were filtered using a 2nd order dual-pass Butterworth filter with an effective cut-off frequency of 6 Hz [34] to remove high frequency noise from each signal. Tracking marker data, calibrated to the segment-defined local coordinate systems were then used for pose estimation via an inverse kinematics approach, yielding a rigid-linked model of each lifting performance. Time-series segment end-point positions (ankle joint centres, knee joint centres, hip joint centres, shoulder joint centres, elbow joint centres and wrist joint centres) and the centre of mass (COM) locations for the feet, pelvis, trunk and head were then extracted from the model for input into a PCA (described in 2.4.1). The rigid-linked model data was also used, in combination with the ground reaction force data, as inputs into a bottom-up 3D inverse dynamics analysis to estimate relevant biomechanical exposures associated with each lifting task (described in 2.4.2). Biomechanical exposure data were required to train a supervised machine learning algorithm to classify which movement strategies exposed lifters to higher or lower biomechanical exposure.
Classification of high vs. Low biomechanical exposure lifting
Pattern recognition for data reduction
Consistent with previous methods, [26, 28] PCA was applied as a data reduction technique to identify patterns in the 3D time-series segment endpoint and centre of mass location data (collectively termed motion data) extracted from the rigid-linked model. Prior to building a matrix of motion data, two important steps were completed. All positional data were normalized to participant height (as calculated using the motion data) to control for the confounding effect of height on variance in the motion data. Second the time-series motion data were time-normalized (via interpolation) to 101 points to represent the percent of lifting cycle. To apply the PCA approach, a matrix [n,m] of motion data was then constructed. In this example, m represented the motion data from each trial as a row vector (m = 3 axes×number of joint center/segment COM locations×number of time points) and n represented the number of trials (n = number of repetitions×number of participants).
Time- and height-normalized motion data were inputted into an n×m matrix. The length of each row vector, m, was 5151 points (3 axes×17 anatomical locations×101 time points) [35]. While the total number of backboard lifts, n, should have been 660 (22 participants×30 lifts per participant), 22 trials were removed from the analysis due to instrumentation error and participant drop-out. As a result, motion data from 22 participants and 638 lifts were retained (n = 638). Using Matlab (The MathWorks, Natick, USA), PCA was applied to the n×mmatrix.
Classifying biomechanical exposures
Three biomechanical metrics were aggregated to estimate the relative risk associated with each backboard lift. Metrics included: peak low back flexion angle, peak low back extensor moment, and low back extensor moment at peak low back flexion angle as these metrics have been strongly associated with the development of low back disorders [36, 37]. To calculate an aggregated relative risk metric for each individual lift, each biomechanical metric was calculated (as described below) and then expressed as a z-score (unit-less) relative to the distribution of scores for that metric across the 638 lifts considered in the analysis. The z-scores corresponding to each metric were then summed together yielding an aggregate relative risk (summed z-score), where a higher summed z-score was indicative of higher relative biomechanical risk. For the purpose of this proof-of-principle, the median aggregate relative risk score was determined and all trials with an aggregate relative risk score below the median were defined as low exposure lifts, while trials with aggregate relative risk score above the median were defined as high exposure lifts. While the aggregated relative risk score approach is not without limitation, it was selected as an appropriate a priori approach to support this proof-of-principle.
Each biomechanical metric was calculated using Visual 3D software (C-Motion, Germantown, MA, USA). Low back angles were calculated as the angle of the trunk relative to the pelvis, normalized to upright standing, where both segment coordinate systems were defined according to International Society of Biomechanics recommendations [38, 39]. A bottom-up 3D inverse dynamics approach was used to estimate the low back moment, expressed in the local coordinate system of the pelvis, where the peak moment and the moment at the instance of peak low back angle were extracted. Extracted moments were normalized to participant mass and to the mass of the lifted load to control for the confounding effect of participant mass and load on the aggregated relative risk metric. Only angles and moments about the flexion/extension axis were considered in this analysis due to the symmetrical nature of the backboard lift.
Linear discriminant analysis (LDA)
An LDA with and without leave-one-out cross-validation was used to assess the ability to classify a lift as either high or low biomechanical exposure based on movement strategy. The first 60 PCs and associated scores for each lift were retained following the recommendation of at least 10 trials per predictor used in the linear discriminant analysis [40]. Lacking a second data set to test the linear classifier, a leave-one-out validation was conducted to test the generalizability of the model. The classification rate with and without leave-one-out validation, as well as sensitivity (percent likelihood of low exposure lift being classified as a low exposure lift) and specificity (percent likelihood of high exposure lift being classified as a high exposure lift), were calculated incrementally for all 1–60 PCs retained. The point at which the classification rates plateaued as more PCs were added was used in the final linear discriminant analysis for classification. Retaining less than the full 60 PCs allows for more predictors per sample, decreases the likelihood of overfitting the model and decreases the computational power of the analysis.
Interpreting classification of strategy based on exposure
The application of a linear discriminant analysis to objectively dichotomize a lift as high or low biomechanical exposure based on movement strategy was used as the classification method. The linear discriminant function, retaining only the PCs prior to classification rates plateauing, was then used to reconstruct the data to interpret the differences in movement strategies between high and low biomechanical exposure lifts using the following equation:
Application of classification of strategy based on exposure
To provide a practical application of the classification of movement strategy based on exposure, two lifts (one high-exposure and one low-exposure lift) were randomly selected from the existing database to observe how they scored along the linear discriminant function. The lifts were scored based on z-scores, with the high-exposure and low-exposure lifts being on either side of the mean. Z-scores were calculated by:
Results
Classification
The LDA was able to accurately classify biomechanical exposure based on movement strategy with 88.56% and 85.42% accuracy when 60 PCs were retained for the non-validated and leave-one-out validated models, respectively (Fig. 2). Improvements in classification plateaued when 20 PCs were retained corresponding to an accuracy of 83.54% and 82.28% when considering the non-validated and validated LDA models, respectively. When using the model based on 20 retained PCs, sensitivity and specificity were 79.08% and 87.95%, respectively (Fig. 3).
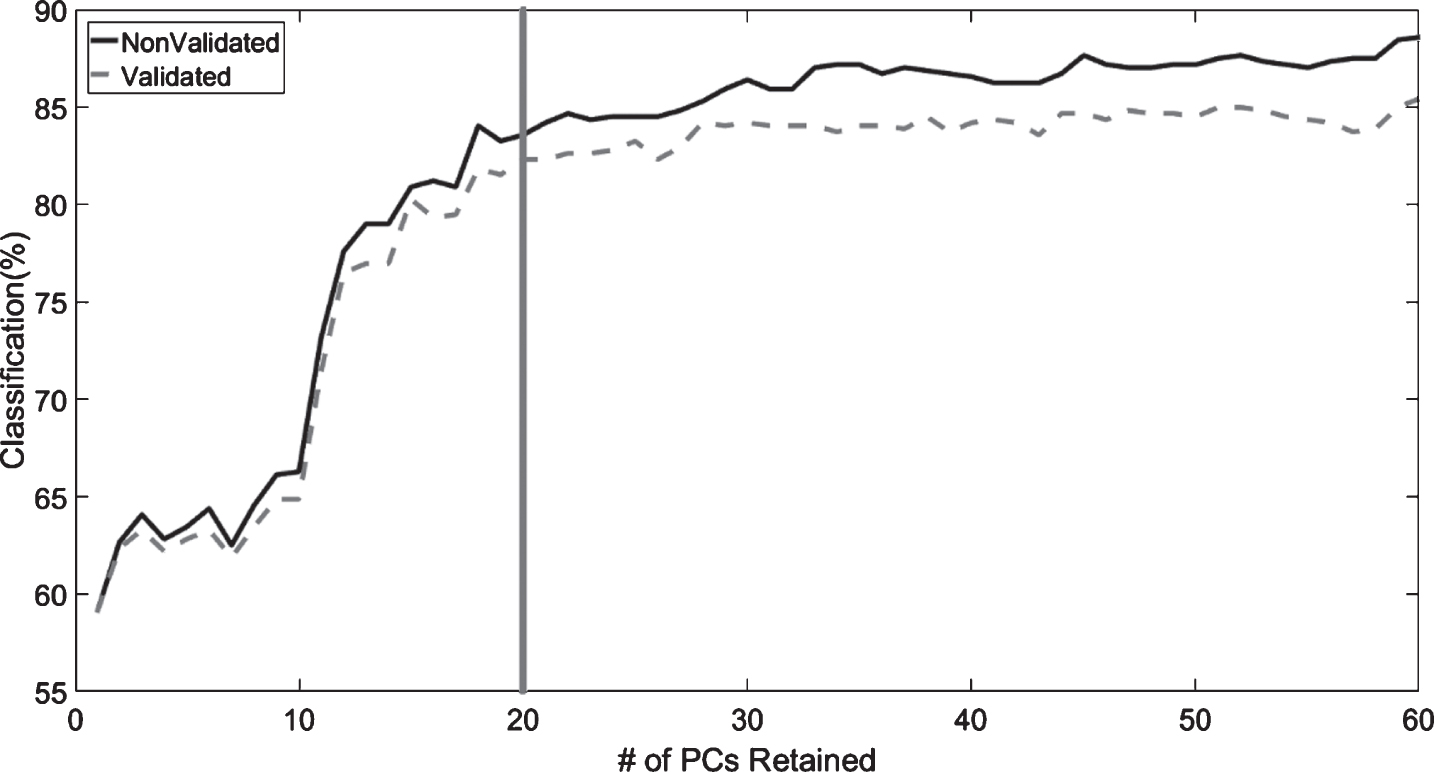
Percentage of correctly classified lifts as high or low biomechanical exposure when 1 to 60 PC scores were retained for the LDA models with leave-one-out cross validation (gray dashed line) and no validation (black line). The vertical gray line illustrates the point where improvements in classification plateaued.

The sensitivity (percent likelihood of correctly classifying a low exposure lift; black line) and specificity (percent likelihood of correctly classifying a high exposure lift; gray dashed line) for when 1 to 60 PCs were retained. The vertical gray line illustrates the point where improvements in classification plateaued.
To visually interpret differences between high and low biomechanical exposure lifts the linear discriminant function was used including the first 20 PCs (Fig. 4). In the reconstruction, the high exposure lift (gray dashed line) initiates the movement of the board from the ground with extension through the low back, which would result in greater normalized low back moments in lifting. Conversely, the low exposure lift (black line) initiates the movement of the load using the lower body while extension of the low back occurs later in the lift. Despite seemingly subtle visually detectable differences in movement competency, the corresponding biomechanics were meaningfully different between the high and low exposure groups (Table 2). For example, lifts classified as high biomechanical exposure experienced double the peak moment per kilogram of body weight, per kilogram of load lifted.
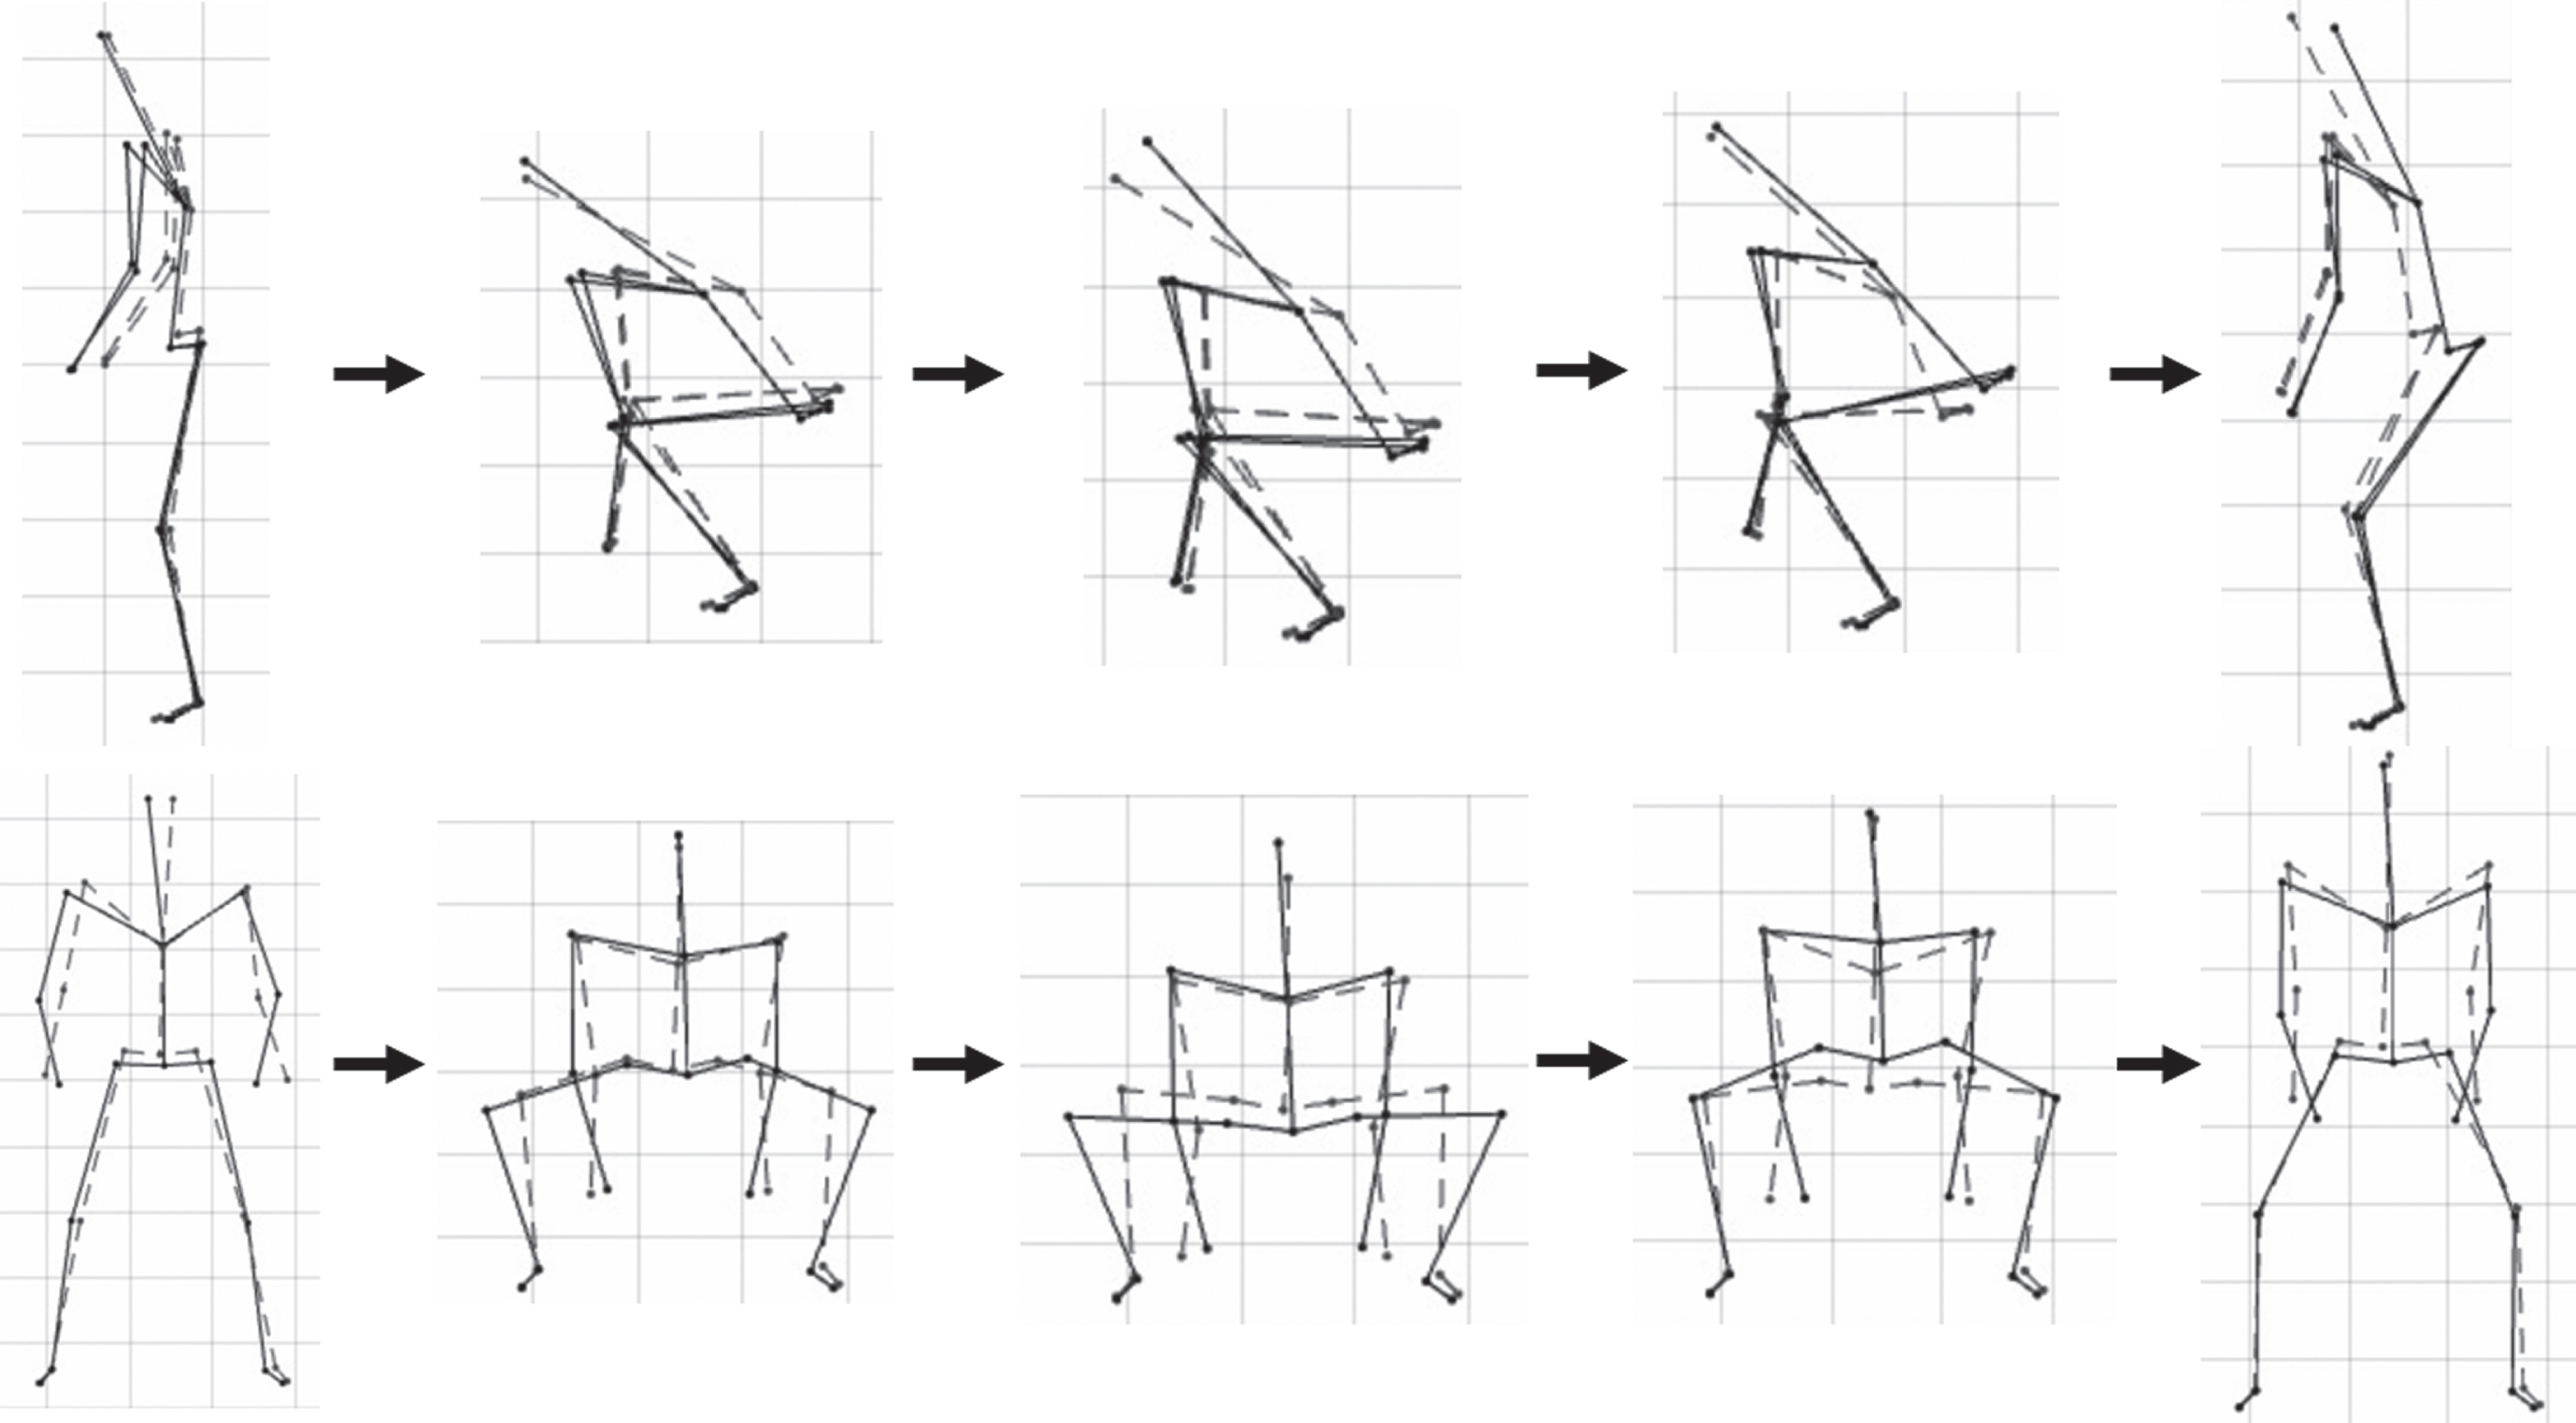
Reconstruction of the linear discriminant function differing between low exposure (black line) and high exposure (gray dashed line) lifts using 20 PCs. Data are reconstructed using the equation: reconstructed data = mean data±3×linear discriminant function.
Descriptive differences in normalized peak low back angle, peak low back extensor moment, and low back extensor moment at peak low back angle between high and low exposure lifts
To provide a practical application of the classification of movement strategy based on exposure, two lifts (one high-exposure and one-low exposure lift) were randomly selected from the existing database to observe how they scored along the linear discriminant function. When interpreting the outcome (Fig. 5), a lower percentage (lower relative exposure) represents better movement competency (more towards the left – conceptually akin to a better leveraged movement strategy in the conceptual model [Fig. 1]) and higher percentage (higher relative exposure) represents poorer movement competency (more towards the right, conceptually akin to a poorly leveraged movement strategy). The two randomly selected lifts were performed by an experienced paramedic (low exposure lift; *) and an individual with no paramedic experience (high exposure lift, X). As illustrated, the low-exposure lift (*) is to the left of the 50% mark, and the high-exposure lift (X) is to the right of the 50% mark (Fig. 5).
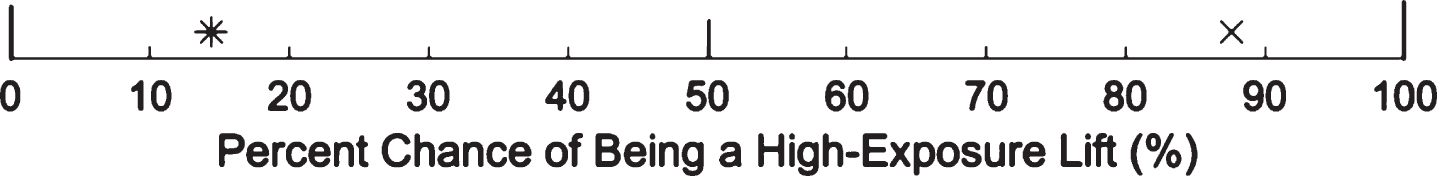
An example of the movement report created for a high-exposure lift (no paramedic experience, poor movement competency; X) and a low-exposure lift (paramedic, good movement competency; *). The scores describe the percent likelihood of the lift being a high-exposure lift (0–100%) based on the movement kinematics of the lift.
This study is the first to demonstrate the utility of AI to recognize and classify individuals movement strategies as “low” or “high” relative biomechanical exposure during the performance of a simulated occupational task that is used within a PES protocol. With the use of linear discriminant analysis, over 85% of lifts could be accurately classified as high or low relative postural and peak spine moment exposure. This has important implications for PES, particularly within the Demand-Capacity-Competency framework. By design, participants in this study lifted weights based on their individual capacities. In this regard, the study was intentionally designed to ensure that participants would be able to demonstrate the task-specific physical capacity requirement of lifting the weighted backboard. In the traditional PES approach, each participant would have successfully demonstrated the physical capacity to meet the job (study) requirements. However, by applying AI in the form of pattern recognition and machine learning techniques (PCA and LDA, respectively), lifts could be classified by relative biomechanical exposure based on movement strategy with greater than 82% accuracy when only retaining 20 PCs as input for the linear discriminant analysis. In our study, some lifts were performed with worse movement competency where lifters demonstrated the ability to meet the physical capacity requirements, but did so by using a strategy that may be potentially unsafe for the spine. In the context of PES, from a Bona Fide Occupational Requirement (BFOR) perspective it remains imperative that candidates can indeed demonstrate the minimum physical capabilities for a job. However, by exploiting advances in AI, similar to this novel approach, we can also objectively evaluate how candidates move to leverage their physical capability to identify those that move in a body-sparing way versus those that do not.
The ability to classify biomechanical exposure based on movement strategy was successful but classification accuracy varied based on the number of PCs retained in analysis. Considering the results of the validated model, classification accuracy remained high (82%) when 20 PCs were retained. Specificity and sensitivity, which should be appropriately balanced for each testing situation, were also high when using the 20 PC model, achieving 87% and 79%, respectively. Within this PES related testing application, strong specificity results have important clinical implications as the goal of the classification procedure is to identify those who may be at a higher relative risk for injury due to poor movement competency. Conversely, there is little risk associated with misclassifying a low exposure lifter as a high exposure lifter, so the lower sensitivity results do not pose a significant concern. The high classification accuracy and specificity support the utility of deploying an AI approach within PES to objectively classify exposure based on movement strategy. The ability to further increase classification accuracy and specificity with the retention of more PCs provides the user with options to adjust classification and specificity percentages on a case-by-case basis. However, when adjusting the number of PCs retained as a method to alter the AI model performance to different PES contexts, it is important to be aware of tradeoffs between improved predictive ability and concomitant higher computational costs and potential model overfitting.
The application of an objective computational approach to detect and classify movement could also reduce the reliance on clinical judgement. Sinden et al. [41] recently showed that clinicians routinely rely on their subjective assessment of an individual’s biomechanics when observing candidates performing task-predictive and job simulation-based tests, such as gait assessments. However, specific to observational-based gait assessment, interrater reliability is often a concern [42]. In our study, the LDA yielded high classification rates based on biomechanical exposure at the low back, but the differences in movement strategy were difficult to perceive visually. This draws into question the ability to robustly visually perceive meaningful difference in movement competency. Therefore, a need exists to exploit advances in technology, such as AI, to automate movement competency assessment to improve the accuracy of and/or supplement movement competency assessment. In doing so, clinicians can then focus their skills and expertise on planning appropriate strategies, grounded in principles of motor learning, to correct and improve an individual’s movement competency, and not on trying to diagnose potential movement competency challenges which may be difficult to detect by eye.
Movement plays an important role in helping us to leverage and apply physical capabilities, but also serves to modulate risk for developing injury. Numerous studies highlight the relationship between task-specific movement and the likelihood of injury [19–21]. While PES remain as an essential tool to ensure candidates can demonstrate the minimum physical capabilities as required to meet a BFOR, effectiveness of PES to support primary injury prevention might be further improved by concurrently considering movement competency, as a component within a multifactorial model of injury [11]. This point is well argued by McGill [43] who notes that while ergonomics has been focused on fitting the task to the worker (i.e., reducing the demands of the job), in some cases it will also be important to ‘fit the worker to the task’ [43], but without discrimination. The consideration of movement strategy within our Demand-Capacity-Competency model, enabled in practice by exploiting advances in AI, will allow us to identify those who can demonstrate the physical capacities required for a job, but who might also need additional coaching to ‘fit the worker to the task’ to ensure the worker can perform job duties safely. If a secondary goal of PES is to support primary injury prevention, then movement competency, the link between how an individual leverages their physical capabilities and their subsequent biomechanical exposure, should be considered. This paper provides novel proof-of-principle evidence to demonstrate how advances in AI can be applied to objectively assess movement competency within a PES paradigm.
The use of AI offers much promise for the objective assessment of movement competency in PES, but there are important issues to consider prior to implementation. First, the consideration of movement competency should not likely be used to make decisions on whether candidates or incumbents are successful on attempting a PES. In the development of a legally defensible PES, the PES tests whether an incumbent can demonstrate sufficient capacity to execute essential tasks of work properly and efficiently [44]. The movement strategy used, while potentially associated with long term injury risk, does not implicitly affect an individual’s ability to demonstrate adequate physical capability and therefore might not be best used as a legally defensible criterion in PES evaluation. Second, establishing threshold limit values for biomechanical exposure to definitively distinguish between safe and at-risk for injury is challenging. In this study, the median exposure was calculated and any exposure below the median was classified as low exposure. However, this threshold, defined relative to our participant population, does not necessarily relate directly to injury risk. Instead, seeking opportunities for a continuum-based (better to worse) definition of exposure may provide a better approach. Third, this study relied on motion data obtained from high fidelity motion capture equipment in a controlled lab environment. To effectively deploy objective movement competency assessment within a PES paradigm, it is essential that useful, high quality movement information can be obtained using technology that can easily be deployed in a gymnasium or clinic. Approaches such as convolutional pose machines [45] are emerging that can robustly estimate whole body motion and underlying joint centre locations (similar to the data used in this study) using only simple video, as recorded from a smart phone for example, as the input. A final remaining challenge relates to how to best use this new movement assessment related information. Historically, movement coaching has not been shown to be effective in changing behavior [46]. However, by considering the role of movement control (pictured in the Demand-Capacity-Competency model) and underlying determinants of workplace movement behavior (e.g., Newell’s model of interacting constraints [25]) within the overarching Demand-Capacity-Competency framework, more targeted, personalized coaching interventions could be developed, that show greater worker retention and that can be sustained to prevent injury over the long term.
Conclusion
The movement strategy that a candidate uses when performing a simulated job task within a PES is an important consideration when aiming to use PES performance as a prognostic indicator of an individual’s risk of injury. This novel study demonstrates how the future of PES could include objective assessments of movement competency by exploiting AI. It is useful to identify those individuals who chose to use higher risk movement strategies when demonstrating their physical capabilities, particularly within simulation-based PES. Moving forward, movement competency assessment should be considered in PES, which in turn will improve the utility of PES for injury prevention.
Conflict of interest
None to report.