
Abstract
BACKGROUND:
Increased genu recurvatum (GR) angle is a risk factor for knee injury. Identification of factors causing GR is important for the prevention and rehabilitation of GR. Few studies have investigated the association between muscle strength and GR.
OBJECTIVE:
To examine the association between GR angle and hip and knee muscle strength in standing workers
METHODS:
The participants in this study were 110 healthy volunteers (59 male, 51 female) who performed standing work in a theme park. The GR angle, muscle strength, and strength ratio of the lower extremities were measured to determine their associations with GR. The GR angle was measured using a Smart KEMA motion sensor, and muscle strength was assessed using a Smart KEMA strength sensor. Stepwise multiple regression models were used to investigate which muscles contributed most to the extent of the GR angle.
RESULTS:
Stepwise multiple regression analysis showed that the decreased hip external rotator to hip internal rotator ratio, increased knee extensor to knee flexor ratio, and young age were associated with an increased GR angle.
CONCLUSIONS:
Many factors are known to increase the GR angle. However, this study investigated the roles of only hip and knee muscle strength. The results suggest that muscle strength ratios are more important than the weakness of any muscle.
Introduction
Genu recurvatum (GR) is the term given to an increase in the passive anterior angle of the femur relative to the tibia that is greater than 10° [1]. Increased GR alters the gait pattern, increasing the knee angle in stance phase and the extension moment in early stance phase [2]. The knees of women with increased GR absorb less force during a drop jump landing, which might contribute to anterior cruciate ligament (ACL) injury [3–6].
Several studies have examined the causes of GR. In women, lower muscle mass and muscle strength can increase GR [5, 8]. Sex hormones can also increase joint laxity, such that the GR angle is increased during the menstrual cycle [9, 10]. Other causes of GR include altered lower extremity alignment, increased hip anteversion, and greater navicular drop [11–14]. Shultz et al. (2012) examined the physical characteristics that influence knee laxity, including GR, and showed that a smaller tibiofemoral angle and longer femur length were associated with GR [5]; consistent with previous studies, they also found that women had increased GR. Few studies have investigated the relationship between GR and lower extremity muscle strength. Kisner and Colby (2012) suggested that a loss of hamstring function increases the GR angle [15]. The hamstrings control forward swing during swing phase and support the knee posterior capsule during stance phase. Thus, when hamstring function is degraded, the GR angle will increase because it does not perform this role [15].
The work related risk factors can lead to increase GR angle. Prolonged exposure to an occupational risk factors can lead to malalignment of the joints by causing abnormal structural adaptations [16, 17]. Standing for a long time during working time can lead workers to experience muscle fatigue and feel discomfort [16, 19]. Previous studies have reported increased malalignment of the lower limb including GR, in the standing worker [17]. This malalignment may also cause musculoskeletal disorders by increasing joint load and muscle imbalance [17]. In a cross-sectional study, Halim et al. (2011) showed that prolonged standing and pain in the back, lower leg, and shoulder were strongly related. The American Podiatric Association reported that 83% of industrial workers experienced foot and lower leg pain associated with prolonged standing [20, 21]. These work-related musculoskeletal disorders require management due to not only reduce worker quality of life, but also reduce the productivity and increase the cost of treatment [22, 23]. Localized muscle fatigue is one of the reasons posited for work-related musculoskeletal disorders; thus, exercises to increase muscle strength and endurance have been used to prevent this problem [24].
It is important to understanding the factors that are associated with GR to prevent and treat GR. When planning exercise programs for GR, it is important to understand the influence of muscle strength. However, few studies have investigated the association between muscle strength and GR. The hip muscles play an important role in maintaining the alignment of the lower extremity. Nevertheless, to our knowledge, no study has investigated the relationship between hip muscle strength and GR angle. Therefore, this study examined the association between GR angle and the strength of the hip and knee muscles in standing workers. We hypothesized that increased strength of the quadriceps would lead to an increased GR, as would weakness of the hip abductors (HABD) and hip external rotators (HER).
Methods
Subjects
This study enrolled 110 healthy volunteer subjects (59 male, 51 female) who worked in a theme park and stood for periods longer than 8 hours per day. The work entailed food and beverage preparation, serving food, and product sales in the theme park. The GR angle was measured in all volunteers. Subjects were excluded if they met the following criteria: neurological pain, history of hip or knee joint surgery, current pain in the hip or knee joint, or a GR angle of less than 3° (Fig. 1). Participant characteristics are listed in Table 1. We based our sample size on the suggestion offered by Barlett et al. (2001): that the optimal number of samples for multiple regression analysis is 5–10 for each independent variable [20, 24]. Before testing, each participant received an explanation of the study procedures and provided informed consent. The study was approved by the Yonsei University Wonju Institutional Review Board.
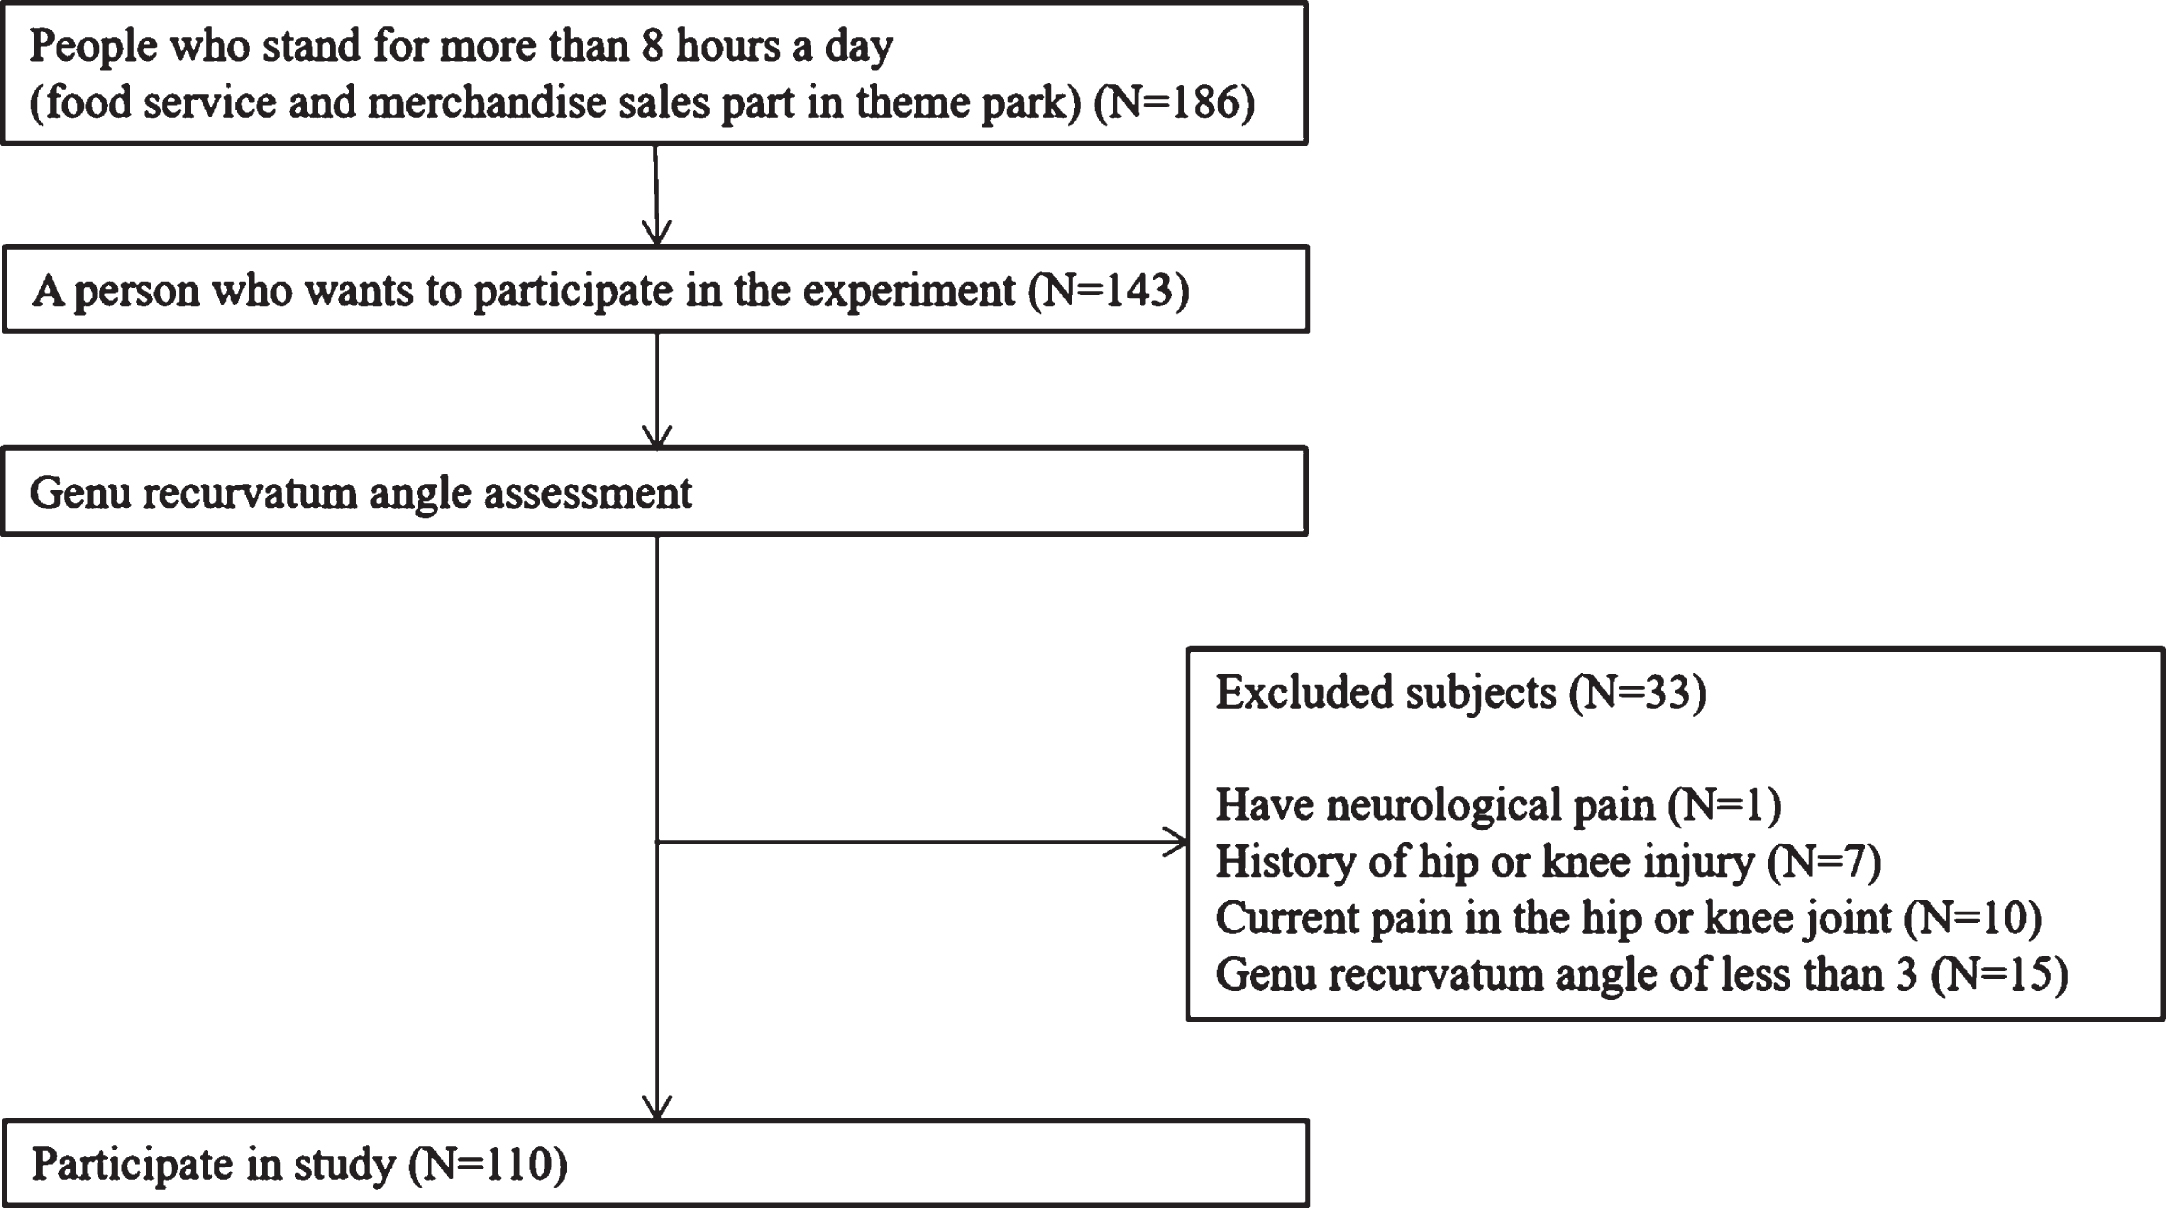
Flow chart of study participant selection.
Subjects characteristics
BMI = body mass index, SD = standard deviation, mean±SD.
The theme park employs various occupational groups; among these, food service workers and merchandise sales workers stand for most of their working day. The tasks of food service workers can be classified as follows; preparing ingredients, cooking, putting food on a plate, serving food, and washing up. The tasks of merchandise sales workers can be classified as merchandise display and sales operations. Workers in these occupational groups are likely to experience lower leg pain due to prolonged standing or walking.
Experimental instruments
Range of motion measurement
The GR angle was measured using a Smart KEMA motion sensor (Factorial Holdings, Seoul, Korea). The Smart KEMA motion sensor is a tri-axillar gyroscope, magnetometer, and accelerometer sensor that measures movement angles. The sensor was attached to the subject using a custom-made strap that has a pocket to hold the sensor. The sensor was calibrated in the starting position, and the movement angle of the axis was then measured. The data collected from the motion analysis sensor were transmitted to the Smart KEMA application via Bluetooth. The maximum range of motion during the analysis period was calculated by the application.
Strength measurement
The strength of lower extremity muscles, including the hip extensor (HE), HABD, HER, hip internal rotator (HIR), knee flexor (KF), and knee extensor (KE), was measured using a Smart KEMA strength sensor (Factorial Holdings, Seoul, Korea), which has a built-in tension sensor to measure tension generated by pulling on both ends. One end of the sensor was attached to a strap, and the other end was fixed to an immovable object by a length-adjustable non-elastic belt. The attachment area of the body and the fixed attachment area were in line, such that the tension was measured while force is applied force. The length of the belt was tightly adjusted in the starting position, and the sensor measured the force of tension generated by the movement of the body part. Data were collected for 5 seconds and transmitted to the Smart KEMA application via Bluetooth. The results were calculated as the average of the middle 3 seconds.
Experimental procedures
First, the examiner measured the GR angle while the subject was in a supine position. After measuring the GR angles of both legs, the leg with the larger GR angle was selected as the testing side. If both GR angles were the same, the strength of the dominant leg was measured. The maximal isometric muscle strength at the hip and knee joints (HE, HABD, HER, HIR, KF, and KE) was measured (once each). The order of the muscle strength measurements was randomized using ‘www.randomization.com’.
Outcome measurements
GR angle
To measure the GR angle, the subjects lay on their backs and wore the strap with the motion sensor on their ankles. The motion sensor was calibrated to 0° while in this position. Then, the examiner pressed on the subject’s distal femur with one hand to fix the upper part of the knee joint. With the other hand under the subject’s ankle joint, the examiner pulled up vertically until reaching the end of motion [25]. The angle of the motion sensor, i.e., the angle between the tibia and a horizontal line, was recorded (Fig. 2).
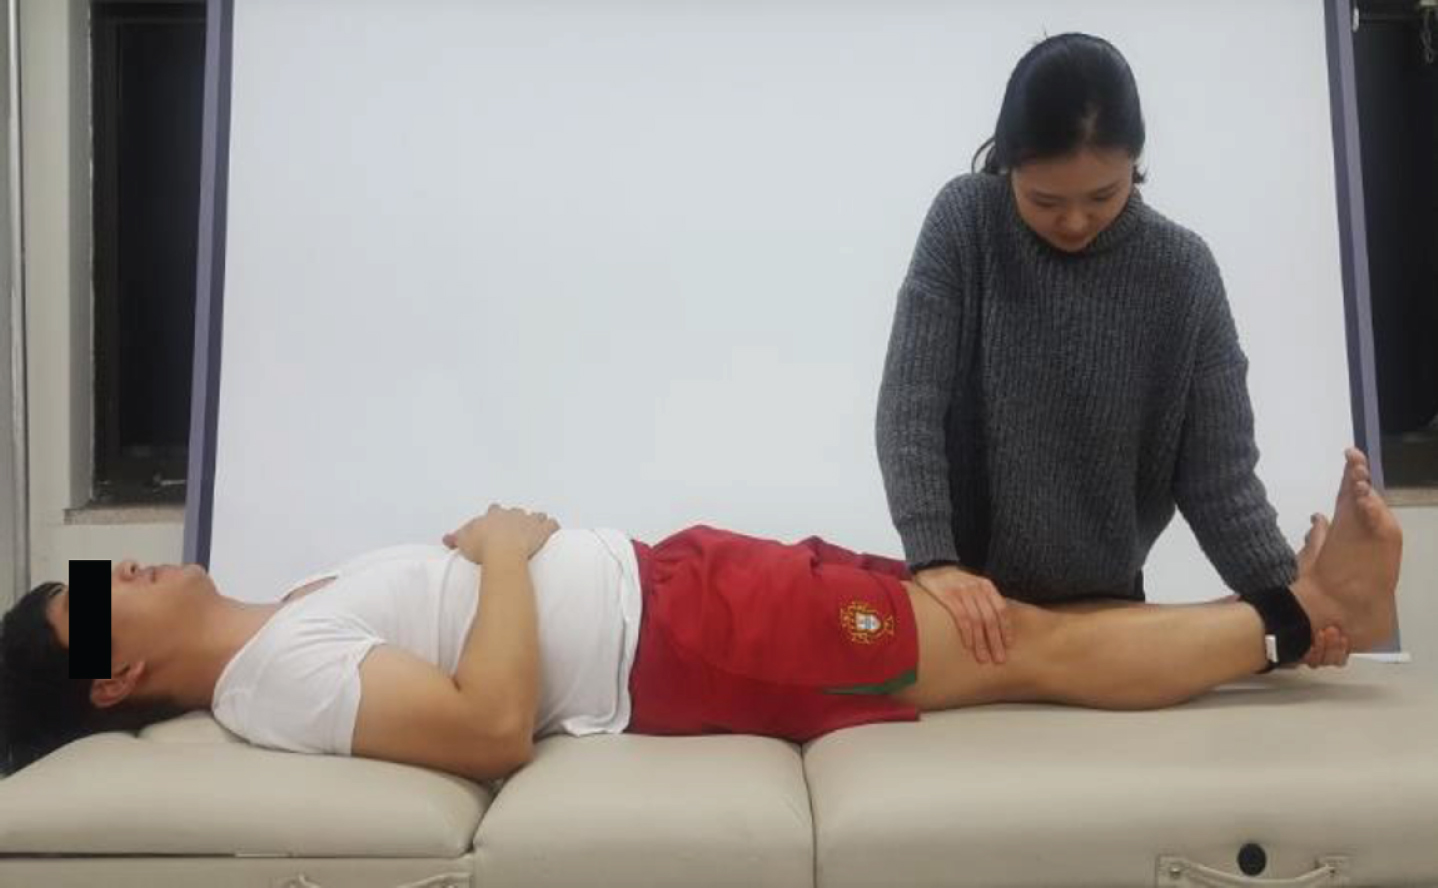
Measuring the genu recurvatum angle.
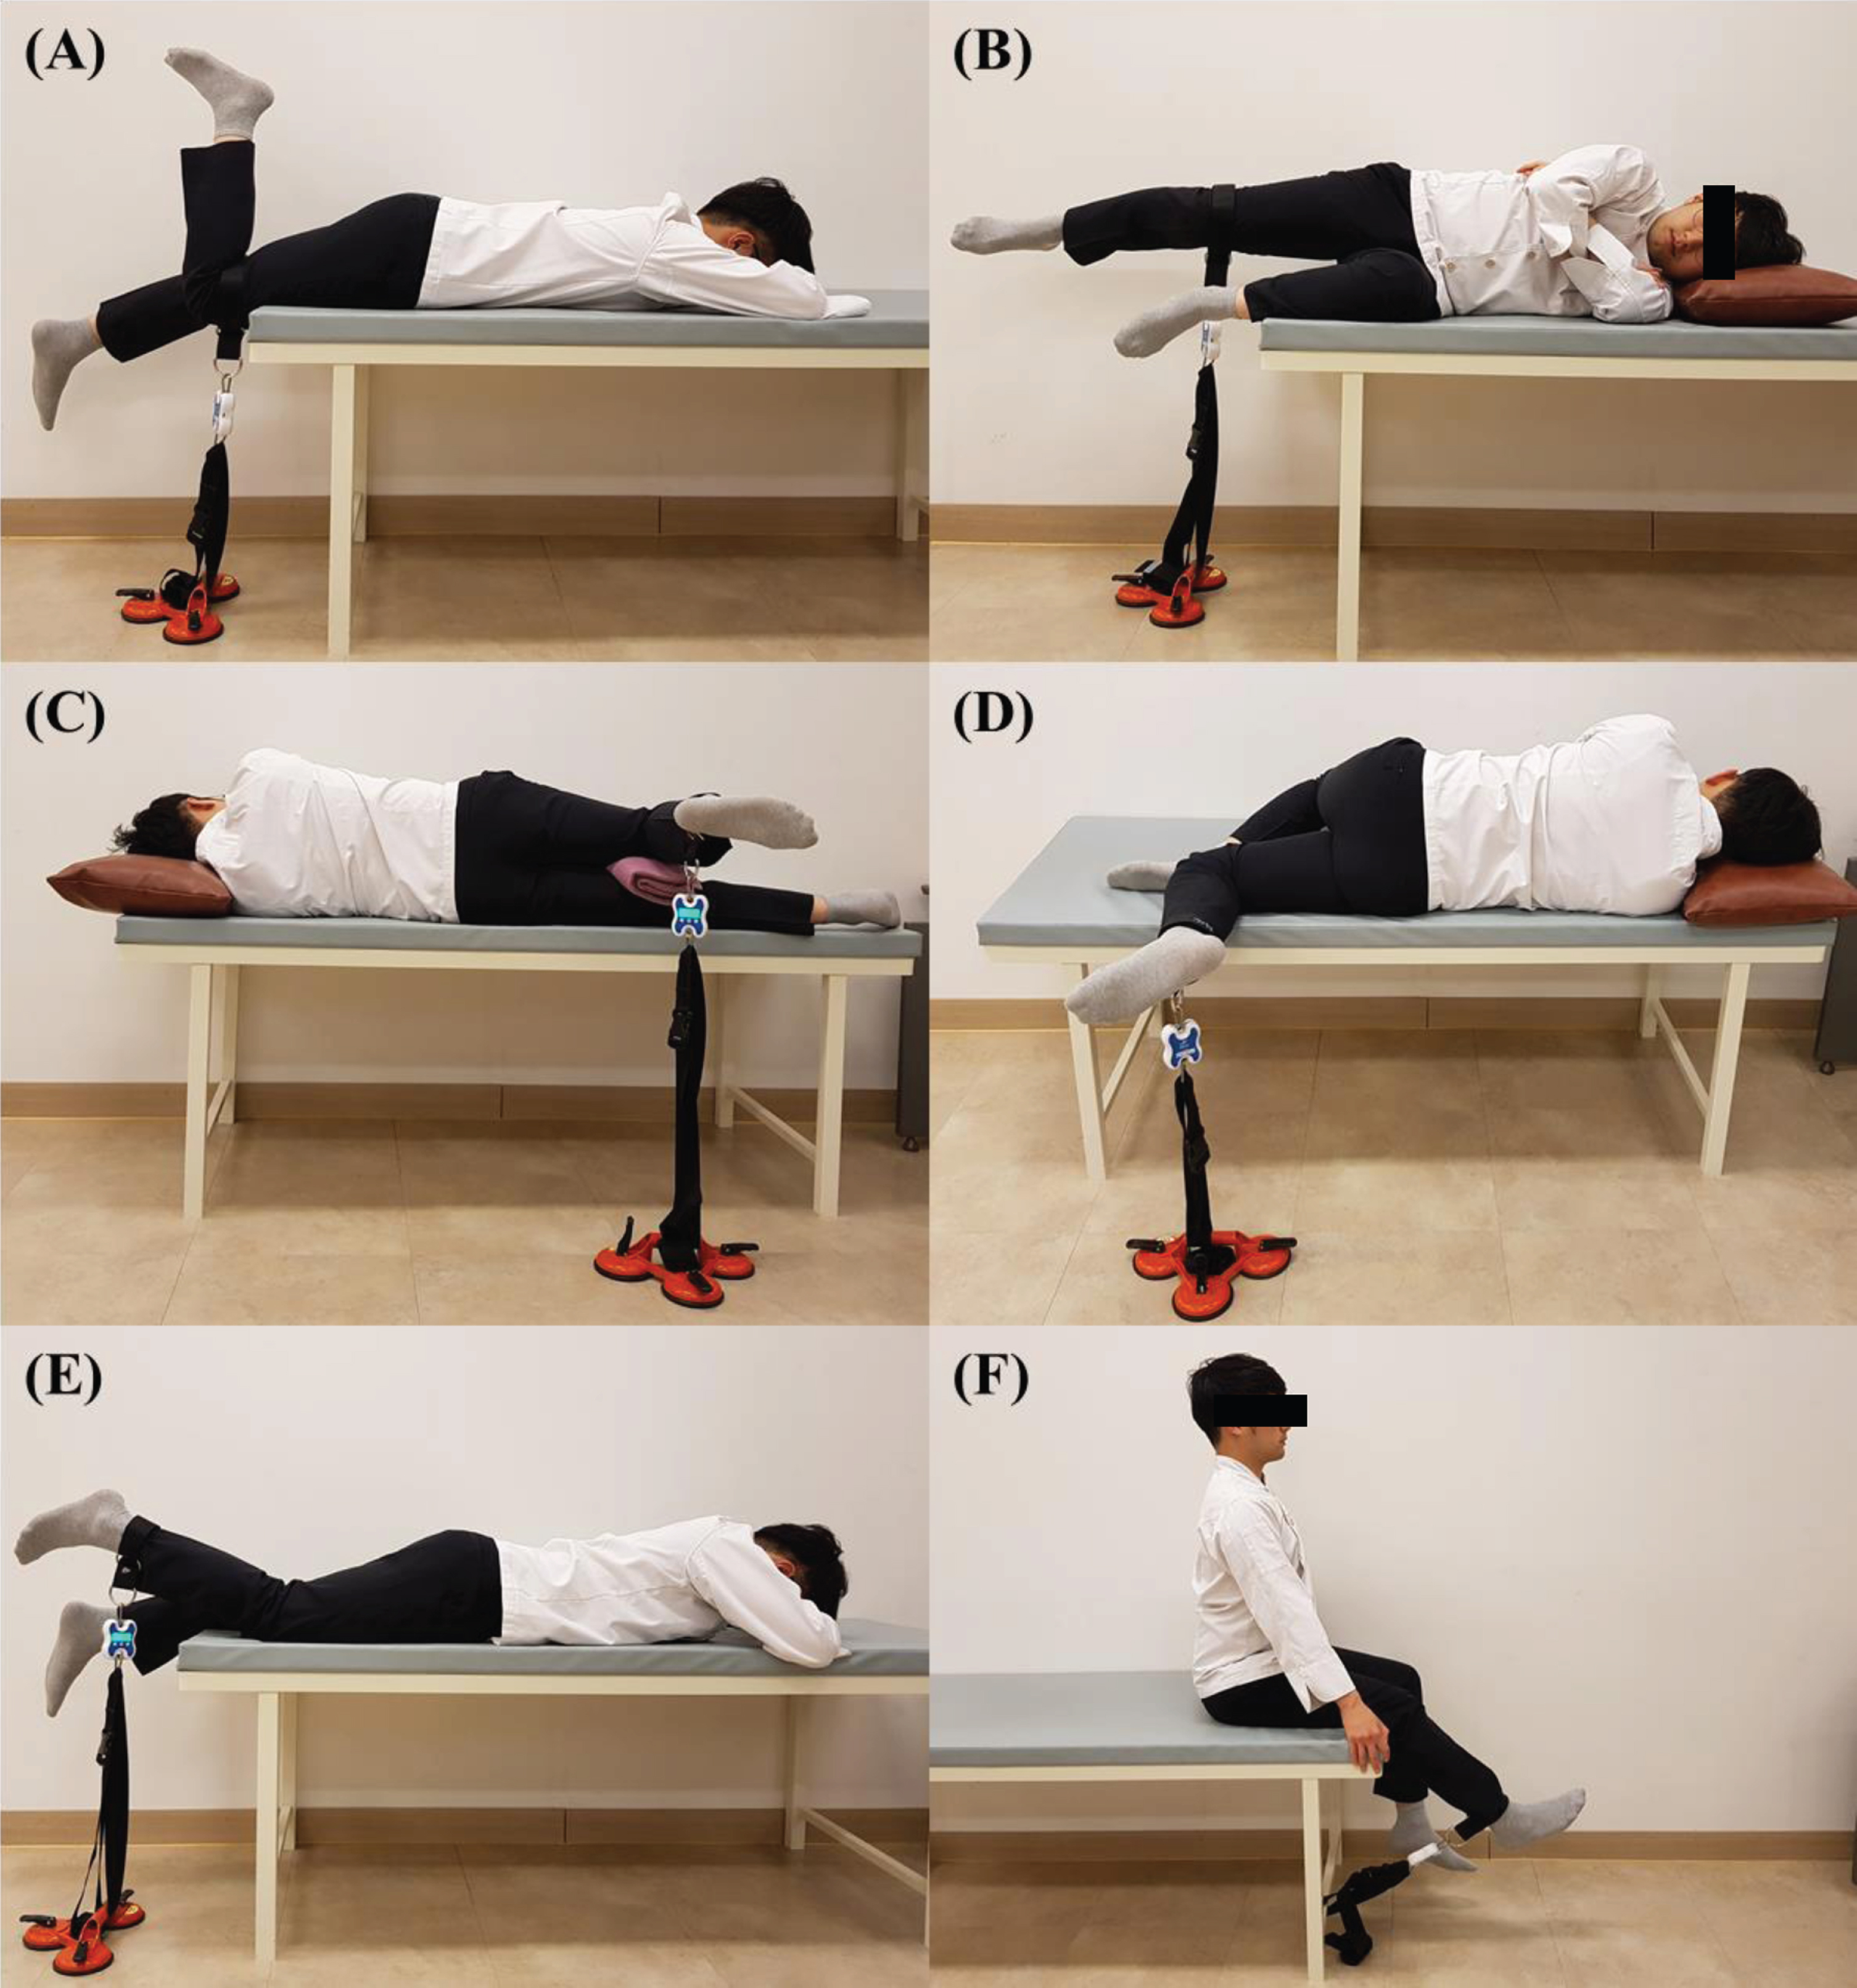
To measure muscle strength, the strength sensor was attached to the thigh or ankle by a strap. An adjustable belt was used to attach the sensor to an immovable object. Then, the belt length was adjusted tightly in the starting position to measure the isometric muscle strength. Next, the tension of the belt was adjusted to 2 kgf in the starting position to control the tension and standardize the tests. The subject was asked to contract each muscle with maximal strength for 5 seconds and the mean value of the middle 3 seconds was determined. For normalization, the value was divided by the subject’s weight [26]. The positions and procedures used for each muscle strength test are described in the following sections. HE strength To measure HE strength, the participant lay face-down with the knee joint to be tested flexed [27, 28]. Then, the strap was attached to the distal thigh of the tested leg. The examiner guided the subject to demonstrate the direction of hip extension before the test. Then, the subject was told “raise your leg in the direction of the ceiling as powerfully as possible for 5 seconds” (Fig. 3A). HABD strength To test HABD strength, the participants lay on their non-tested leg side. The hip and knee of the non-tested leg were naturally bent forward. The hip and knee joint of the tested leg were extended to 0° [29]. The thigh strap with the strength sensor was attached to the distal thigh of the tested leg. Before the measurement, the limb was guided passively in the direction of movement several times for familiarization with the test. Then, subject raised the tested leg toward the ceiling as strongly as possible for 5 seconds. The subjects were told to be careful not to flex their hip or knee during the test (Fig. 3B). HIR strength HIR strength was measured with the subject lying on the non-tested leg side. The subject extended both legs, and then the tested knee joint was flexed to 90°. A folded towel was placed between the knees to prevent excessive adduction or abduction of the hip during testing. Subjects wore the strap on the ankle of the tested leg. Then, the subject raised their foot with the maximum force for 5 seconds with their knees fixed. At this time, the angle of the knee was maintained at 90° (Fig. 3C). HER strength To test HER strength, the participants lay on the non-tested side. The hip joint of the tested leg was extended to 0° and the knee joint was flexed to 90°. The non-tested hip and knee were flexed forward, so the foot on the non-tested side was located ahead of the knee on the tested side. A folded towel was placed under the knee of the non-tested leg to prevent pelvic rotation during testing. The ankle strap with the strength sensor was applied to the tested leg [30]. Then, the subjects raised their foot with the maximum force for 5 seconds, with the knees fixed and the angle of the knee maintained at 90° (Fig. 3D). KF strength KF strength was tested in the prone position with the distal half of the lower leg extending beyond the table. The strap with the strength measurement sensor was placed on the ankle of the tested side. The strength was measured isometrically, with the knee flexed slightly to avoid having the muscle in a lengthened position [31]. Then, the subject was asked to flex the tested knee as strongly as possible. The examiner prevented pelvic anterior tilt by pushing on the sacrum during the test (Fig. 3E). KE strength To measure KE strength, the subject was seated at the edge of a table in an upright position with the knee flexed at 90°. The ankle strap with the strength measurement sensor was attached. The subject held the table edge with both hands to stabilize the trunk [32]. An isometric strength test was performed with the knee flexed at 45° to avoid shortening the muscle. The subject then extended the tested knee as strongly as possible (Fig. 3F). Measurements of the strength of the (A) hip extensor, (B) hip abductor, (C) hip internal rotator, (D) hip external rotator, (E) knee flexor, and (F) knee extensor muscles.
Quadriceps-to-hamstring ratio (Q/H) Q/H was calculated to detect any muscle strength imbalance at KF or KE. Q/H is the strength of KE (quadriceps) divided by the strength of knee flexor (hamstring). Thus, an increased Q/H ratio indicates that the KE is stronger than the KF. HER/HIR ratio Hip rotation control is important for maintaining hip alignment during gait and prolonged standing. The HER/HIR ratio was calculated to determine whether there was any imbalance in hip joint rotation. The HER/HIR ratio was calculated by dividing the HER strength by the HIR strength. The HER/HIR ratio increases when HER is stronger than HIR.
Statistical analysis
The Kolmogorov–Smirnov test was used to verify that the data were normally distributed. Intra-class correlation coefficients (ICCs) with 95% confidence intervals (CIs) were used to determine the intra- and inter-rater reliability of the smart KEMA strength and motion sensor. ICC values were ‘very high’ at >0.9, ‘high’ at 0.7–0.89, and ‘moderate’ at 0.5–0.69 [33]. The standard error of measurement (SEM) was calculated as SEM = SD √ (1 –ICC) to determine measurement precision in the same units. SEM% values (SEM divided by the mean) less than 10% were considered acceptable [34].
Pearson correlation coefficients were used to calculate correlations among the study variables. Stepwise multiple regression models were used to identify the muscle involved in the hip and knee joint contributed most significantly to the GR angle. Independent variables were the subject characteristics, including sex, age, body mass index (BMI), hip and knee muscle strength (HE, HABD, HER, HIR, KF, and KE), and the muscle strength ratios (Q/H and HER/HIR). The dependent variable was the GR angle. SPSS software (SPSS Inc., Chicago, IL, USA) was used for the analysis and the significance level was set at p < 0.05. A post hoc power analysis using G*power ver. 3.1.2 (Franz Faul, University of Kiel, Germany) was used to confirm that the sample size was sufficient to achieve a large power.
Results
The data collected for all variables were normally distributed. Table 2 shows the intra- and inter-rater ICCs, 95% CIs, SEM of the smart KEMA strength measurements, and motion analysis for the eight (male) participants. The intra-rater reliability was very high (ICC3,1 > 0.9) for most conditions except HABD, for which it was high (ICC3,1 = 0.77 [95% CI = –0.18 to 0.95]). The inter-rater reliability was very high for most conditions (ICC2,1 > 0.9), except for high HABD and HER reliability (HABD: ICC2,1 = 0.86 [95% CI = 0.28–0.97], HER: ICC2,1 = 0.75 [95% CI = –0.27 to 0.95]). The intra- and inter-rater SEM was generally less than 10%, except for the inter-rater reliability of HER strength measurements.
Intra- and Inter-rater reliability of Smart KEMA strength sensor and motion sensor
Intra- and Inter-rater reliability of Smart KEMA strength sensor and motion sensor
aHE: hip extensor strength. bHABD: hip abductor strength. cHER: hip external rotator strength. dHIR: hip internal rotator strength. eKF: knee flexor strength. fKE: knee extensor strength. gGR angle: genu recurvatum angle. hICC: intraclass correlation coefficient. iCI: confidence interval. jSEM: Standard error of the measurement.
Table 3 shows the descriptive statistics for each variable and Pearson’s correlations between the GR angle and subject characteristics (sex, age, and BMI), muscle strength (HE, HABD, HER, HIR, KE, and KF), and muscle balance (Q/H and HER/HIR). There was a significant positive correlation between the GR angle and Q/H (r = 0.235; p = 0.007). There were also significant negative correlations between GR angle and age (r = –0.185; p = 0.03), normalized HER (r = –0.215, p = 0.01), and HER/HIR ratio (r = –0.247, p = 0.005) (Table 3). There were no significant correlations between GR angle and sex, BMI, or normalized strength of the HABD, HIR, or KE (p > 0.05).
Descriptive statistics for variables and Pearson’s correlations
aSD: Standard devation. bBMI: Body mass index. cGR angle: genu recurvatum angle. dHE: hip extensor strength (normalized with body weight). eHABD: hip abductor strength (normalized with body weight). fHER: hip external rotator strength (normalized with body weight). gHIR: hip internal rotator strength (normalized with body weight). hKE: knee extensor strength (normalized with body weight). iKF: knee flexor strength (normalized with body weight). jQ/H ratio: quadriceps strength to hamstring strength ratio. kHER/HIR ratio: hip external rotator strength to hip internal rotator strength ratio. *p < 0.05.
The stepwise multiple regression analysis identified factors that significantly contributed to GR angle. The results indicated that three of the independent variables (HER/HIR ratio, Q/H ratio, and age) were significant contributing factors. This model had 14.8% of the explanatory power (R2 = 0.148) (Table 4). A regression equation was determined using the β values of the unstandardized coefficients. The β values of the independent variables influencing the GR angle were as follows: HER/HIR, β= –1.04; Q/H, β= 1.13; and age, β= –0.06). The equation used to determine the GR angle from the multiple regression model was as follows:
Results of stepwise multiple regression analysis
aGR angle: genu recurvatum angle. bHER/HIR ratio: hip external rotator to internal rotator ratio. cQ/H ratio: quadriceps to hamstring ratio.
GR angle = 9.097 –1.037 (HER/HIR) + 1.13 (Q/H) –0.063 (age)
An increased GR angle can lead to ACL injury by affecting lower extremity biomechanics during gait or when landing after a jump [2, 4]. Therapy for GR involves various exercises including muscle control, gait training, and proprioception [35]. However, the cause of GR remains unidentified, although it is clearly related to the muscle strength of the lower extremity. Therefore, this study examined the association between GR angle and muscle strength at the hip and knee in standing workers. We found that decreased HER/HIR, increased Q/H, and younger age were associated with an increased GR angle, with these variables explaining 15% of the variance therein.
These results indicate that the muscle strength ratio has a greater effect on the increased GR angle than does the strength of each individual muscle. The GR angle increased with a decreased HER/HIR. The mean value of HER/HIR in this study was 1.01±0.5. Hoglund et al. (2014) measured the isometric strength of HER and HIR in healthy young subjects using an instrumented dynamometer and found that the mean HER and HIR strength values were 12.48 and 10.45 kg, respectively, giving a HER/HIR = 1.19 [35]. Magalhaes et al. (2013) compared the HIR/HER of patients with patellofemoral pain syndrome (PFPS) and control healthy subjects [36]. Converting the HIR/HER into HER/HIR, the value was 1.03 in the healthy subjects and 0.90 in the PFPS subjects. An increased GR angle is associated with changes in knee mechanics in daily life, which increases the risk of knee injury. To reduce the GR angle, it is necessary to strengthen HER strength relative to HIR.
Q/H reflects the quadriceps strength relative to the hamstring strength. In this study, the mean Q/H was 1.42, and the GR angle increased with Q/H. Thus, greater quadriceps strength compared with hamstring strength can lead to an increased GR angle. This result is consistent with that of Devan et al. (2004), who showed that athletes with an increased GR angle had a Hkneeflexor/Qkneeextensor ratio lower than the normal values of 0.6 at 60°/s and 0.8 at 300°/s [1]. Muscle imbalance with hyperactivity of the quadriceps relative to the hamstrings can lead to hyperextension of the knee joint during functional activity. During gait, the hamstrings control the forward swing of the lower leg during the terminal swing phase and provide posterior support to the knee capsule during the stance phase [15]. If the hamstrings cannot perform this function, the GR angle will increase progressively [15]. The hamstrings and quadriceps are therefore the muscles most often strengthened during knee rehabilitation. However, the relative strength of the two muscles, rather than the strength of each individual muscle, was identified as a factor causing a change in the GR angle. Therefore, to reduce the GR angle, the treatment strategy must consider the relative strength of both muscles.
Our results showed that young age was the factor most closely associated with an increased GR angle. Many studies have reported that joint flexibility decreases with increasing age [37, 38]. Only 5–10% of the population maintains a high degree of joint flexibility in adulthood [37]. Studies suggest that as age increases, the mobility of the joints decreases because of increased cross-linking of fibrous proteins [38]. Several studies have shown that an increased GR angle is associated with sex: females have less muscle mass and muscle strength than males, so their GR angles increase [7, 39]. Although we found that sex was not significantly related to an increased GR angle, the average GR angle was larger in females than in males (7.58 vs. 6.84).
This study had several limitations. First, the results do not show a causal relationship between an increased GR angle and other factors, because the design was cross-sectional. A longitudinal study is needed to identify causal relationships between the GR angle, muscle strength and muscle strength ratios. Second, the regression equation derived in this study had low explanatory power. In previous studies, the increase in GR angle was influenced by factors such as anthropometry, the subject characteristics, proprioception, sex hormones, and general laxity, while we studied only the relationship between the GR angle and hip and knee muscle strength. This might explain the low explanatory power. We found that a decreased HER/HIR and increased Q/H were related to an increased GR angle. Further longitudinal studies should examine the effect of strengthening the HER relative to the HIR, and hamstrings relative to the quadriceps, on the GR angle.
Conclusion
This study found that a decreased HER/HIR, increased Q/H, and young age were related to an increased GR angle. Many factors are known to increase the GR angle. However, this study investigated only the roles of hip and knee muscle strength. The results suggest that muscle strength ratios are more important than the weakness of any muscle.
Conflict of interest
None to report.
Footnotes
Acknowledgments
We greatly appreciate the assistance of everyone in the laboratory as well as the participants, who helped to make this study possible.