
Abstract
BACKGROUND:
It is unclear whether and under which conditions stretch training programs lead to gains in flexibility when applied in work health promotion for office workers in order to reduce musculoskeletal disorders (MSD).
OBJECTIVE:
The aim of this study was to analyze whether the stretch training “five-Business” leads to gains in range of motion (ROM). Furthermore, the influence of baseline flexibility and socio-demographic factors (sex, age, weight, height and body mass index (BMI)) on trainability was assessed.
METHODS:
161 office workers (n = 45 female; n = 116 male) without major MSD were recruited. Over three months, a standardized static stretch training (“five-Business”) was executed on a device, supervised twice per week for 10 min. ROM was assessed using a digital inclinometer (shoulder, hip and trunk extension) and a tape measure (fingertip-to-floor and lateral inclination).
RESULTS:
ROM gains (p≤0.001) were present in all tests, except for the hip extension. ROM changes correlated moderately (0.24–0.62) with the baseline flexibility (p≤0.001). Subjects with limited flexibility reached the largest gains (1.41–25.33%). Regarding the socio-demographic factors only one low correlation occurred (weight - retroflexion; –0.177).
CONCLUSION:
The “five-Business” stretch training effectively increases ROM in office workers, especially when baseline flexibility is limited.
Introduction
Stretch training programs are used in work health promotion programs (WHPP) to reduce musculoskeletal disorders (MSD) in office workers [1–3]. MSD, especially back pain, are a common health problem in this population [4–6] and has been associated to prolonged static sitting [7]. In this working environment, back pain has been associated with muscle tightness [5] and limited range of motion (ROM) [8]. However, it has been proposed that this can be addressed through stretch training programs [9, 10]. The most effective approach for increasing ROM is static stretching [11], in which the musculotendinous units are held in an elongated position for 15–30 sec in order to reduce muscle tightness [2, 12]. Muscle tightness can be caused by neuronally activated spasms and contractions or passively by postural adaptations [9].
Current evidence supports the assumption that stretch training programs can reduce MSD in office workers [3, 15]. In these studies, the authors usually evaluate the intervention via questionnaires [8, 16–18], such as the visual analog scale (VAS) [8, 17] or the Corlett-Bishop body map [14, 16]. Tunwattanapong et al. [8], for example, combined instructions for ergonomic posture with a stretch training program for the neck, shoulders and trunk, which the subjects were instructed to perform twice a day for 10–15 min. The training program was not equipment supported and presented to the participants in a brochure. In both VAS (–1.4; 95% CI: –2.2, –0.7) and the physical sum scale of the Short Form-36 (14.0; 95% CI: 7.1, 20.9) improvements in the number of neck and shoulder complaints were demonstrated.
In the context of WHPP it is nevertheless rarely assessed whether stretch training programs actually lead to an increase in flexibility [8, 9]. For example, questionnaires reporting the pain intensity in the neck, shoulders and lower back (Cornell Muscoloskeletal Discomfort Questionnaire) and perceived exertion (Borg CR-10 scale) were combined with a ROM assessment via a goniometer on the neck, shoulders, hips and knees [15]. The stretch training consisted of 13 exercises which had to be executed three times per day (10–15 min per session, resulting in 30–45 min in total per day) for 11 weeks. The results showed that pain and ROM improved in all assessed regions (effect sizes: partial eta2 0.299–0.942) [15].
This frequency in training is common in the current literature where subjects stopped working twice [8] or three times [18] per day for 10–15 min, or even up to ten very short breaks per hour [17]. From the employers’ point of view, the movement breaks should be kept short and few in order to save working time. If a WHPP is associated with a considerably high loss of actual working time, it is unlikely to be implemented, even though it may be effective [19].
Office workers, naturally, are heterogeneous in terms of age, body weight, height and body mass index (BMI) [20]. Since it has been shown that sex, age and BMI affect the risk for MSD [6, 21], these parameters might as well influence the response to a stretch training. It can also be assumed that participants with higher muscle tension and, therefore, limited ROM [22], would profit most from stretch training, while those with higher flexibility would respond less. Based on the current study situation, it is however unclear if a stretch training is equally effective for all employees, or whether such measures are more suitable for subjects with certain physical conditions (e.g. high BMI or relatively low flexibility).
The first aim of the present study was to assess whether a static stretch training program leads to an increase in ROM in office workers. Regarding the feasibility of the training as a WHPP, we chose a relatively low training frequency (twice per week, for 10 min each) over a period of three months. Secondly, we aim to analyze age, sex, weight, height, BMI and baseline flexibility as possible influencing factors on the trainability. In order to get reliable results, it needs to be ensured, that the training intensity is comparable in all subjects. This can be achieved using the “five-Business” stretch training, which consists of five static stretching exercises executed on a single device (Fig. 1). Here, a standardized execution is ensured, since wooden struts determine the stretch position. These struts can be adjusted according to body size and flexibility allowing for an individual customization for each subject. Based on the results, occupational health managers can decide whether and for whom this stretch training program is suitable.
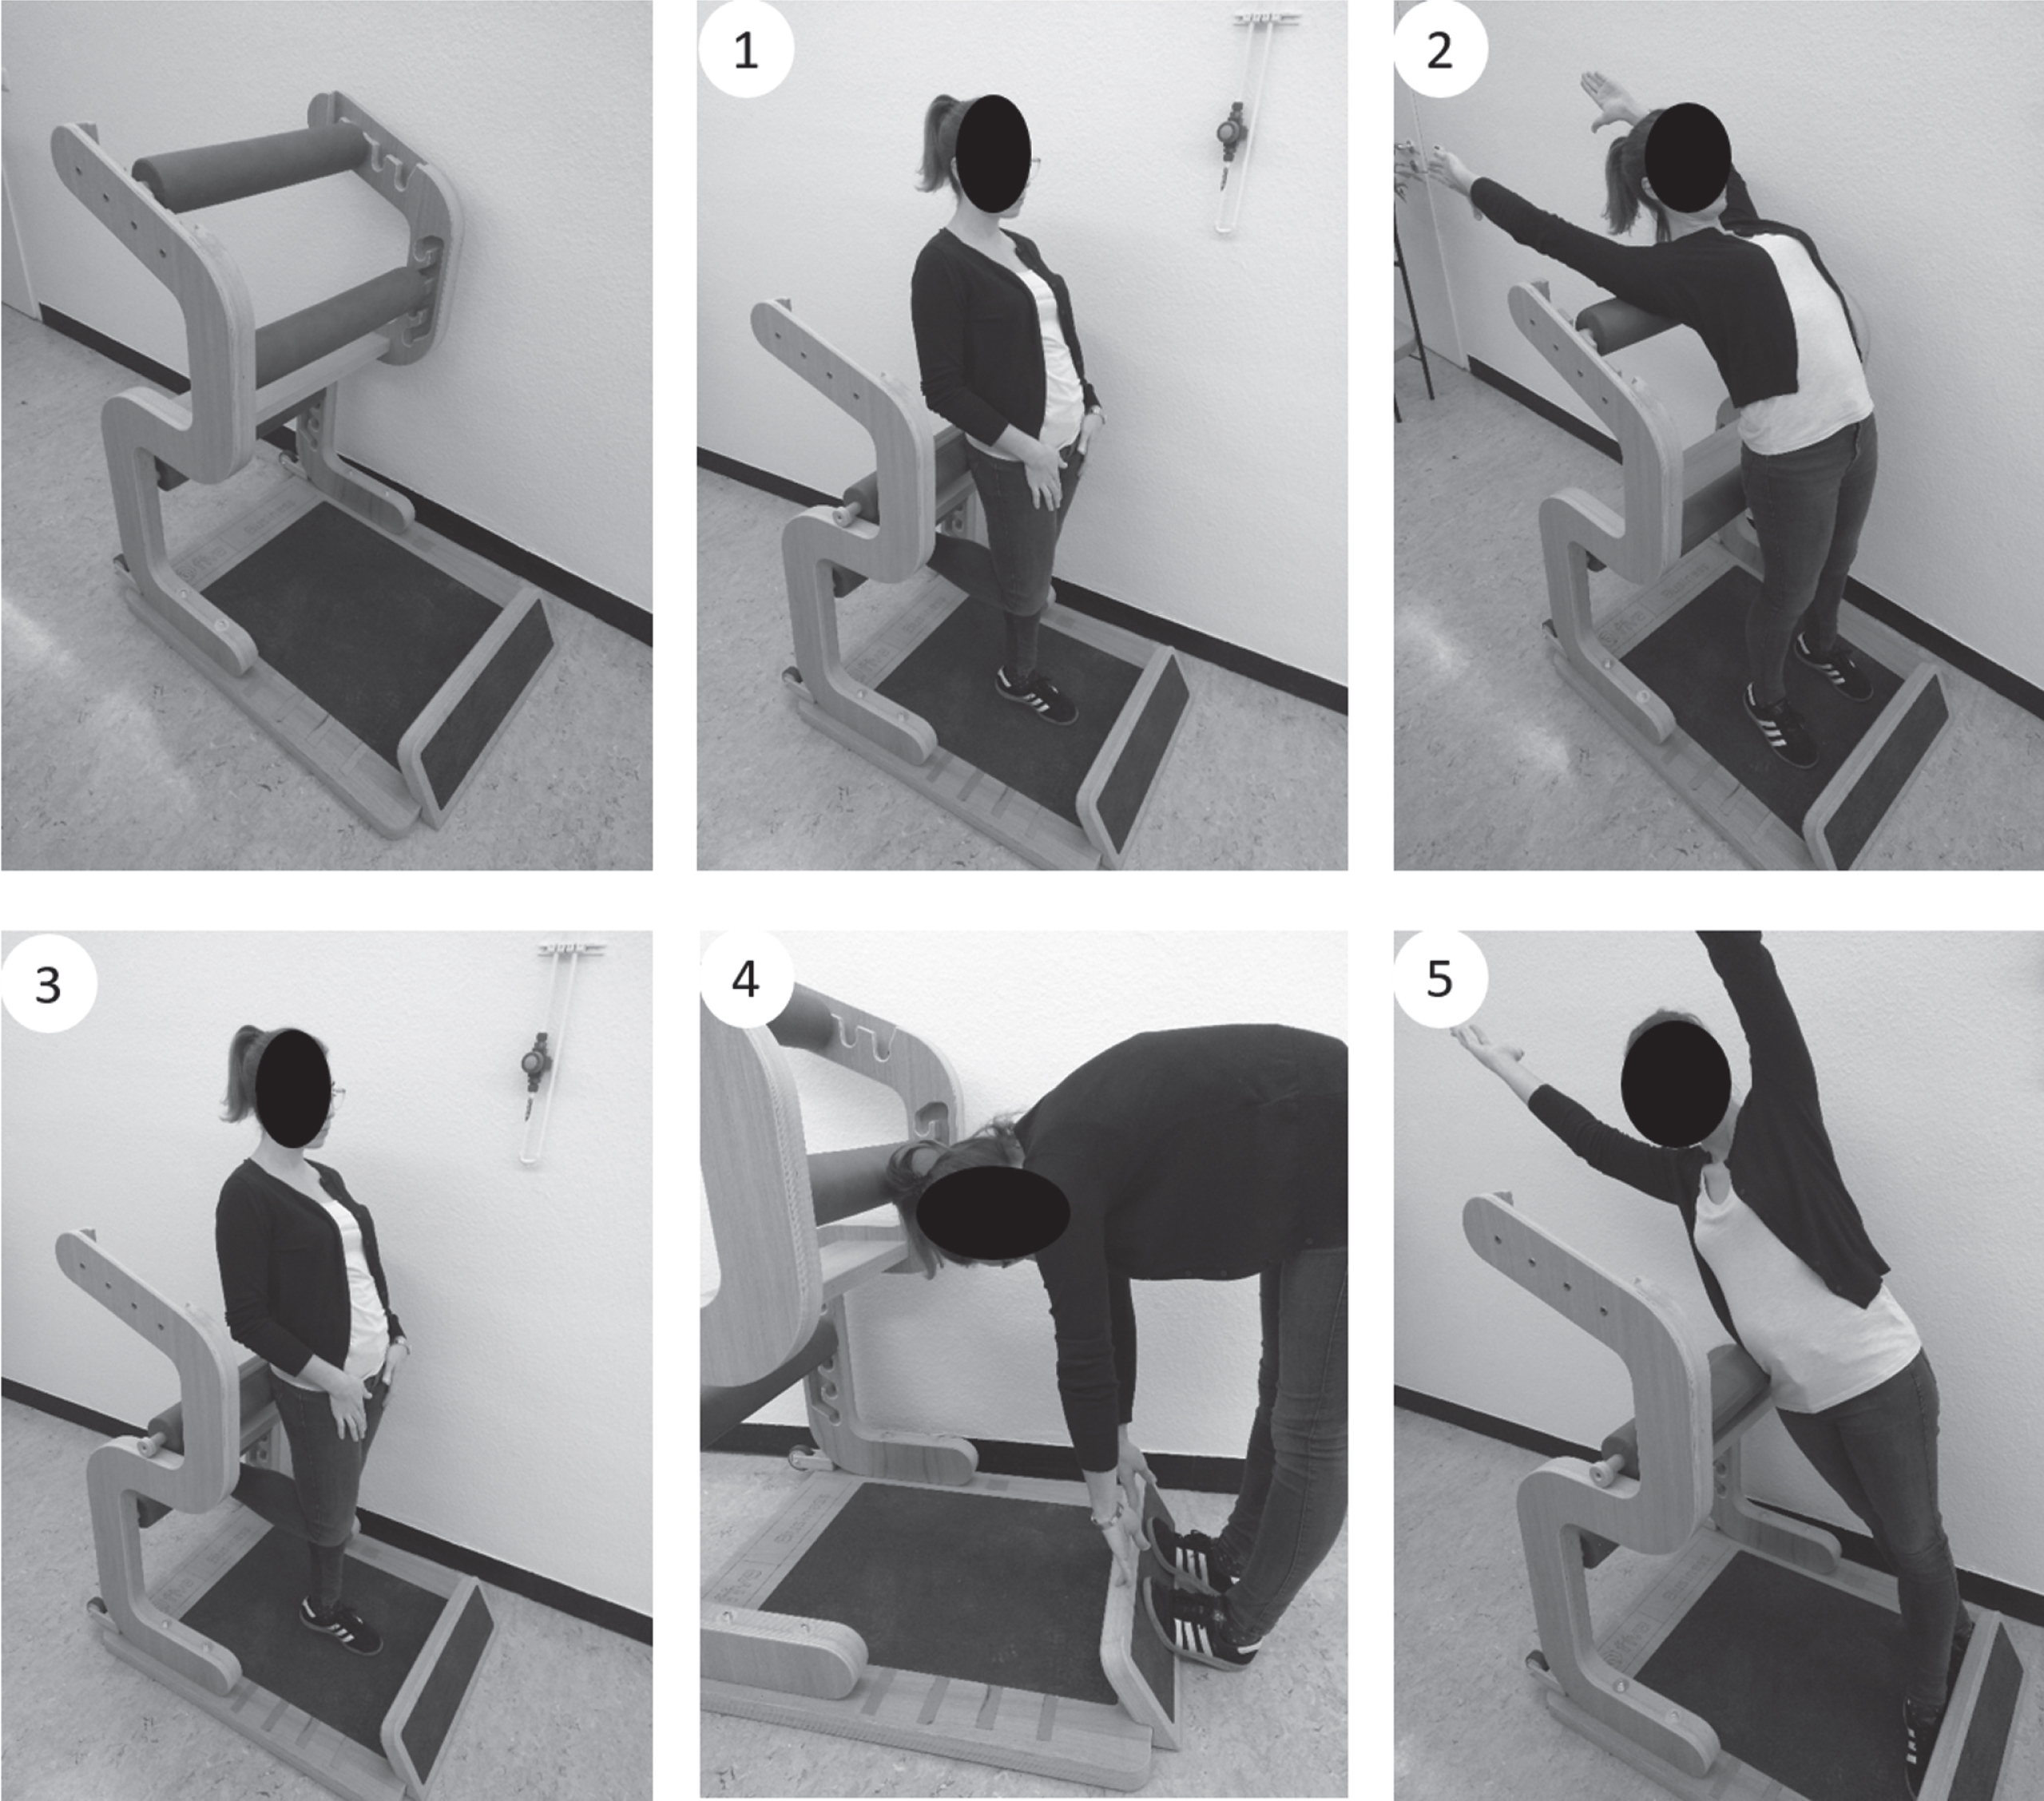
The “five-Business” training: The device “five-Business” (left) and all 5 exercises performed on the device in exercise order. 1) Stand, 2) Chest, 3) Ischio, 4) Hip and 5) Lateral (right).
Subjects
A total of 216 (n = 79 female; n = 137 male) adult subjects volunteered to participate in this intervention study. 25.5% (n = 55 total; n = 21 female; n = 34 male) left the study as drop-outs, mostly because they could not integrate the training twice into their working week. This was due to frequent business trips, part-time work or long holidays. 161 participants (n = 45 female; n = 116 male) completed the study successfully. Subjects were recruited from an office building in the automotive industry in Stuttgart, Germany. In total, 1958 employees who worked in the four-story building received a PowerPoint presentation via email two months prior to the study, in which the study and the potential health benefits of the training were explained. Healthy employees as well as employees with mild musculoskeletal complaints aged 18–65 years were addressed. Interested employees contacted the study directors via email or telephone and arranged an appointment for the baseline testing. All other training appointments for the upcoming 12 weeks and the post-test were also successively scheduled. 8.22% of the primarily contacted employees completed the study.
Exclusion criteria were: relevant surgeries/surgical stiffening of relevant joints, relevant artificial joint replacement, severe diseases such as Bechterew’s disease, chronic destructive joint diseases, multiple sclerosis, myodystrophic or neurodegenerative diseases, congenital malpositions of the musculoskeletal system, acute herniated disc, intake of muscle relaxants or other medications that influence the elasticity of the muscles and pregnancy.
Written informed consent was obtained by all participants. A positive ethics recommendation from the Medical Association of Baden-Württemberg (F-2017-073) was obtained.
The intervention program
The intervention program “five-Business” has been designed by the commercial provider Five-Konzept (Hüfingen, Germany) for the implementation in WHPPs. The program contains five stretching exercises of the trunk in different degrees of freedom on a specially developed device (Fig. 1). All exercises can be performed in business clothing. The device offers the opportunity to adjust the struts to the subjects’ individual anthropometry. At the same time a standardized exercise execution is ensured. Each exercise was held twice for 20 sec, with the subjects being able to choose their own break duration. One training session took a maximum of 10 min. In the period of three months, 22–24 sessions had to be completed as the intervention was scheduled for a time frame of 12 weeks by training twice a week. As the study took place in a regular office, where employees go on holidays or business trips, a two week break from training was allowed. Missed sessions could be made up for by training three times per week after the vacation. Four devices were strategically placed on the first and third floor (two devices in one training area) of the four story building, ensuring short distances for each participant. On both floors an experienced trainer supervised the correct execution of the stretching. The training area was framed by a portable 1.60 m high wall. If subjects missed a training session, they would be contacted via email to schedule a new appointment.
In the “five-Business” program the positions had to be held statically by the stretched musculature, requiring light isometric contractions. Taking into account the course of the myofascial pathways, whole muscle chains were stretched [25]. The training focused on the muscles of the trunk and, in particular, the extension of the spine. The exercises partly resembled yoga positions. In addition, the “five-Business” included the trunk extension, a treatment frequently recommended by McKenzie and May [26].
Range of motion tests
Evaluation was carried out by means of ROM tests (see Fig. 2), which were chosen because of their congruency to the addressed musculature by the five stretching exercises. Sufficient descriptions of these tests can be found in Holzgreve et al. [27]. In the lateral inclination, the distances between fingertip and floor were calculated relative to body height (distance (cm)/body height (cm)) and are therefore displayed without unit.

ROM tests: Tests (a), (b) and (c) are performed with a digital inclinometer. In a) the inclinometer is held on the stiloideus radii, in b) proximal to the patella and in c) on the proximal part of the sternum. For d) and e), a tape measure is used between the fingertips and the floor. All tests are repeated three times to rule out acute effects.
Two different measurement devices were used to measure flexibility. A digital inclinometer was used for the angle measurement in the shoulder test, modified after Janda [28], the modified Thomas test [29] and the retroflexion of the trunk, modified after Janda [28]. Specifically, the Acumar™ digital inclinometer Model ACU002 (Lafayette Instrument Company, Lafayette, USA) was chosen. This device displays integers which leads to an absolute measurement error of 0.3°. For the fingertip-to-floor test [30] and the lateral inclination [31], a tape measure was applied. The custom made tape measure was graduated in 0.1 cm increments.
To test for normal distribution, the Kolmogoroff-Smirnoff test with Lilliefors correction was used. As the vast majority of baseline and post data were normally distributed, parametric tests were chosen. To test whether a subjects’ ROM changed, a t-test for paired samples was performed including effect sizes according to Cohen (d = 0.2 low effect; d = 0.5 medium effect; d = 0.8 strong effect) [32].
In order to analyze whether socio-demographic factors or baseline data influence trainability, correlations were performed. For age, weight, height, BMI and baseline data Spearmen correlations were calculated against baseline-post differences, since the majority of the difference data was not normally distributed. Also correlations between the socio-demographic data and the baseline data were performed (Pearson correlations, since the majority of the baseline data was normally distributed). The influence of the subjects’ sex on trainability and baseline data was assessed using the Mann-Whitney U test.
To further characterize the intervention group, subjects were respectively clustered into three subgroups for each test. In subgroups “limited”, all participants were included whose pre-tests results laid below the 25th percentile. Subgroups “average” included all participants with baseline data between the 25th and the 75th percentile. Subgroups “advanced” included all participants whose baseline results laid above the 75th percentile. These three subgroups were consequently calculated for each test. Here, baseline-post differences, effect sizes and relative changes from baseline as well as socio-demographic analyses on sex, age, weight, height and BMI were calculated for each subgroup, respectively. To further analyze the trainability of the subgroups, baseline-post differences were additionally checked by means of ANOVA with a Tamhane-correction since the vast majority of data were normally distributed. The significance level was α= 0.05 and all tests were performed two-sidedly. All tests were performed using SPSS Statistics for Windows version 26 (IBM Corp., Armonk, NY, USA).
Results
Subjects on average±SD were 44.81±10.55 years old, 1.76±0.09 m tall, weighed 78.03±15.11 kg and had a BMI of 25.03±3.92 kg/m2. T-tests on the whole intervention group revealed highly significant gains in flexibility in four out of five ROM tests, when comparing baseline and post data (Table 1). The mean differences showed that subjects experienced gains in ROM in the shoulder test (right: 2.1±7.7°, p = 0.001, d = 0.24; left: 2.7±10.11°, p = 0.001, d = 0.26), the retroflexion of the trunk modified after Janda (5.4±8.6°, p < 0.001, d = 0.62), the fingertip-to-floor test (–1.9±4.0 cm, p < 0.001, d = 0.46) and in the lateral flexion (right: –0.004±0.01, p = 0.002, d = 0.25; left: –0.004±0.01, p < 0.001, d = 0.33). Note that in the fingertip-to-floor test and in the lateral inclination, negative differences are positive as the distance to the floor decreases with greater flexibility. In the Thomas test, subjects showed decreases in flexibility (right: –2.1±4.5°, p < 0.001, d = 0.43; left: –1.2±4.7°, p = 0.001, d = 0.26). In all tests, the effect sizes showed low to medium effects (d = 0.24–0.62).
Changes in range of motion in the whole intervention group. For each test the results of the baseline and the post-test are displayed. In the lateral inclination, the distances between fingertip and floor were calculated relative to body height (distance (cm)/body height (cm)) and are therefore displayed without unit.
= mean (all means are displayed with±standard deviation);
diff was calculated by subtracting the post data of the baseline data. p-value shows the significance of the t-test, significant data is printed in italics. As the majority of the data was normally distributed, p-values were calculated using the t-test for paired samples. Effect sizes were calculated according to Cohen (d = 0.2 low effect; d = 0.5 medium effect; d = 0.8 strong effect)
Changes in range of motion in the whole intervention group. For each test the results of the baseline and the post-test are displayed. In the lateral inclination, the distances between fingertip and floor were calculated relative to body height (distance (cm)/body height (cm)) and are therefore displayed without unit.
Spearmen correlations between the socio-demographic factors and the baseline data against the baseline-post differences (Table 2b) revealed that the baseline data showed the strongest correlation with trainability. Here, highly significant and moderate correlations in all tests, indicated that limited initial flexibility is connected to larger gains in ROM. This accounts for all tests except for the Thomas test where the opposite direction of correlations occurred.
Correlations. 2a shows the correlation of socio-demographic data with baseline data. Since data were mostly normally distributed, Pearson correlation coefficients of socio-demographic factors and baseline flexibility were calculated. 2b shows the correlations of socio-demographic data and baseline data with trainability (baseline-post differences). Since the vast majority of the data was not normally distributed, Spearman Correlations were calculated. Displayed are Spearman-Rho values. In 2a and 2b “a” indicates that a Mann-Whitney U test was used (not normally distributed data) since sex was dichotomously distributed. Where significances occurred, (f) indicates that females showed higher flexibility. Note that in the fingertip-to-floor test and both lateral tests, lower results indicate advanced higher flexibility. *p < 0.05 (2-tailed); **p < 0.01 (2-tailed); ***p < 0.005 (2-tailed)
Correlations. 2a shows the correlation of socio-demographic data with baseline data. Since data were mostly normally distributed, Pearson correlation coefficients of socio-demographic factors and baseline flexibility were calculated. 2b shows the correlations of socio-demographic data and baseline data with trainability (baseline-post differences). Since the vast majority of the data was not normally distributed, Spearman Correlations were calculated. Displayed are Spearman-Rho values. In 2a and 2b “a” indicates that a Mann-Whitney U test was used (not normally distributed data) since sex was dichotomously distributed. Where significances occurred, (f) indicates that females showed higher flexibility. Note that in the fingertip-to-floor test and both lateral tests, lower results indicate advanced higher flexibility. *p < 0.05 (2-tailed); **p < 0.01 (2-tailed); ***p < 0.005 (2-tailed)
Regarding the influences of socio-demographic factors, only two significant results were observed: in the Thomas test (left) the differences correlated (t-test) significantly with sex (p = 0.01) and in the retroflexion of the trunk, the differences correlated significantly with body weight (p = 0.027). No other univariate test between the differences and potential influencing factors showed significant results.
In Table 2a the Pearson correlations between the baseline data and the socio-demographic factors are shown. Percentiles to divide the three subgroups for each test are displayed in Table 3. The average age and gender distribution for the subgroups in all tests are also presented.
Grouping of flexibility according to percentiles of the pre-test. Subgroups are divided according to their baseline flexibility. In “limited” all participants were included whose pre-tests results lay below the 25th percentile. “Average” includes all participants with a pre-test result between the 25th and the 75th percentile. “Advanced” includes all participants whose pre-test results lay above the 76th percentile. In the first column (gray), average age and gender distribution are presented. From the second column ROM values are shown. Note that in the fingertip-to-floor test and both lateral tests, lower results indicate advanced flexibility. In the lateral tests, relative values are calculated: measured results (cm)/height (cm)
In the shoulder test on both body sides, in the fingertip-to-floor test and in the lateral inclination on both body sides, subgroups “limited” showed larger gains than subgroups “average”, while subgroups “advanced” showed slight decreases. In the retroflexion of the trunk, the differences between baseline and post data showed that participants of subgroup “limited” experienced the largest gains in range of motion, followed by subgroup “average” and “advanced”.
In total, in subgroups “limited” (except for the Thomas test) and “average”, the t-tests revealed highly significant changes in range of motion (p < 0.001 –p = 0.004, d = 0.2–1.5). In subgroups “advanced” (except for the retroflexion of the trunk), participants experienced decreases in range of motion. These decreases, however, were significant only in the shoulder test on the right (p = 0.05, d = 0.4), the Thomas test (right p < 0.001, d = 1; left = 0.003, d = 0.1) and the lateral flexion on the right (p = 0.009, d = 0.5).
In the Thomas test on both body sides, subgroups “limited” experienced no significant changes while subgroups “average” and “advanced” showed slight, but highly significant decreases in range of motion (subgroup “average”: right: p = 0.001, d = 0.6; left: p = 0.004, d = 0.4; subgroup “advanced”: right >0.001, d = 1; left: p = 0.003, d = 0.1). Relative changes in range of motion are displayed in Fig. 3 and the data can be seen in Table 4.
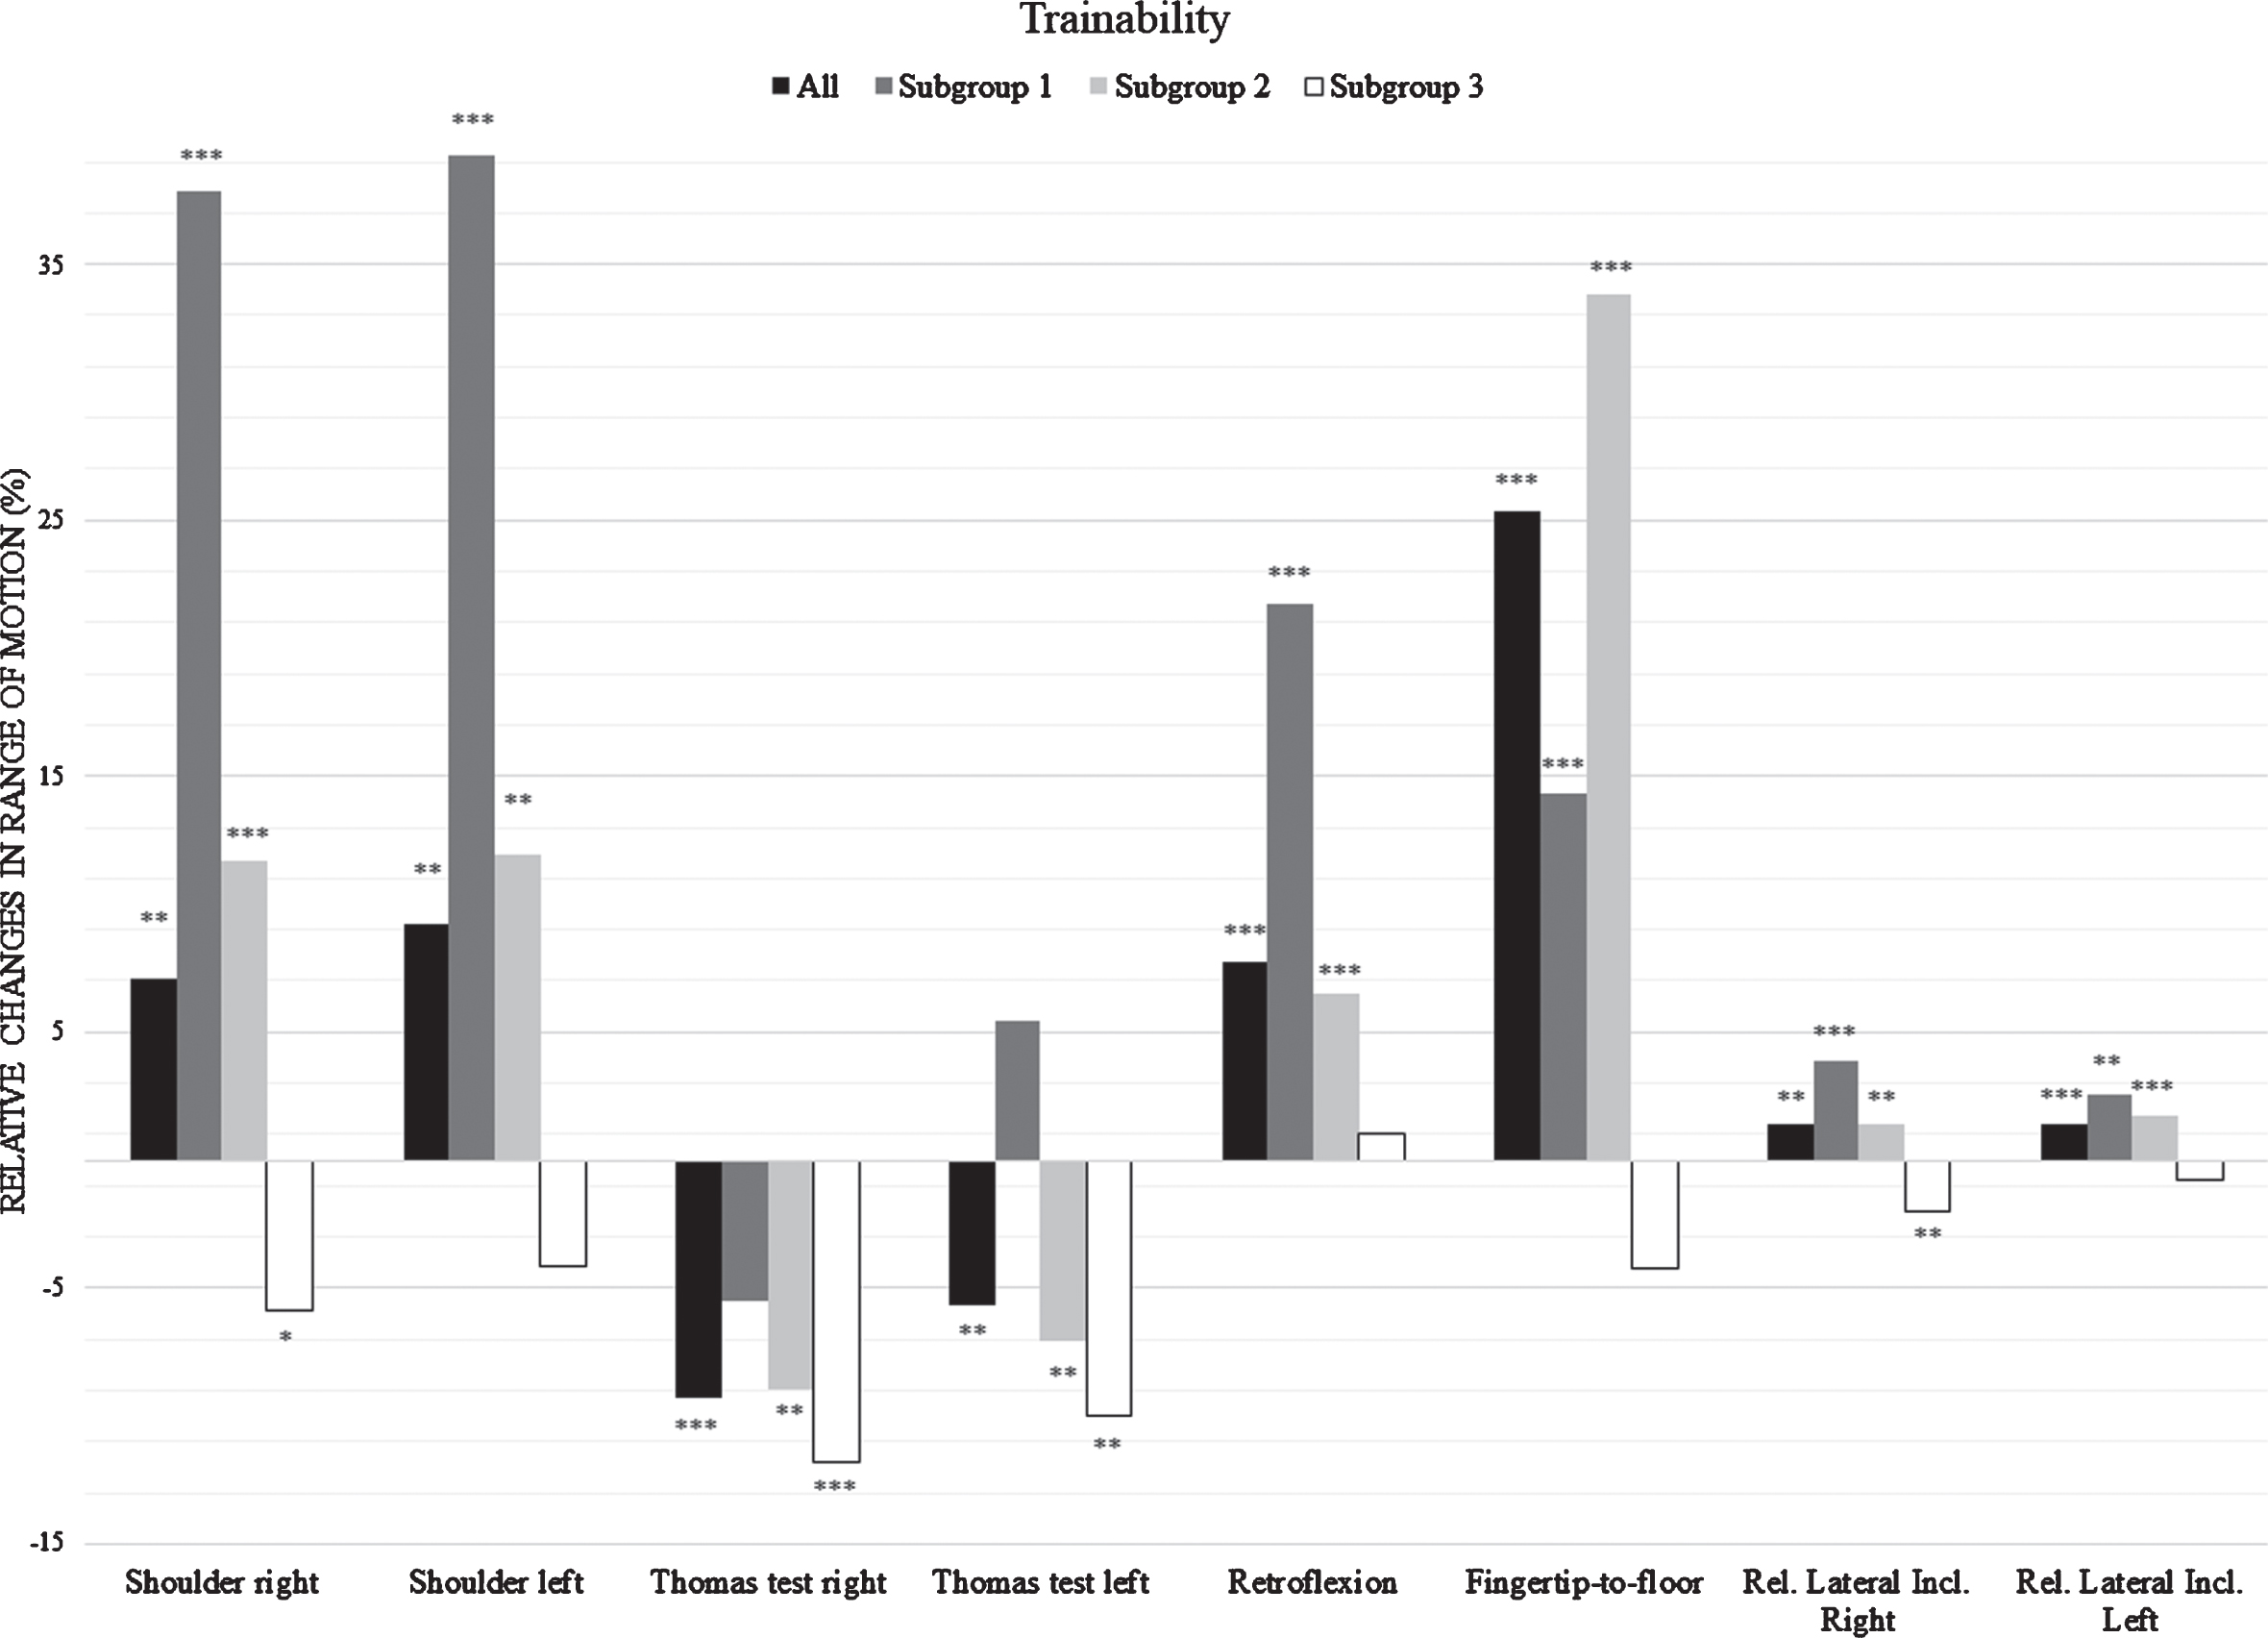
Relative changes of ROM: Changes in ROM from baseline to post measurement for all tests are presented in percentages. The whole intervention group (all) and all subgroups are displayed in the column diagram. Stars above the columns indicate significance of the changes derived from t-testing between baseline and post data. *p < 0.05 (2-tailed); **p < 0.01 (2-tailed); ***p < 0.005 (2-tailed).
Relative changes in ROM. For each subgroup of each test the changes in range of motion from baseline to post-test are presented
Tamhane correction of the performed ANOVA revealed that baseline-post differences (p < 0.001–0.007) were significantly different between subgroup “limited” and subgroup “advanced” in all tests, supporting the dependence of trainability on the initial range of motion. Magnitudes of differences across subgroups showed that in all tests the differences in trainability are the largest between subgroup “limited” and subgroup “advanced”. This as well as statistics on socio-demographic factors, in addition to t-tests for all subgroups in each test, is shown in Table 5.
Descriptive data for subgroups in ROM tests.
The results of this study demonstrate that the standardized stretch training “five-Business” significantly improved the ROM in four out of five tests in the setting of work health promotion within three months. An average training frequency of twice per week was sufficient to achieve low to moderate effects (d = 0.24–0.62) in the intervention group. Precisely, in the shoulder test (right: 7.1%; left: 9.2%), the retroflexion of the trunk (7.7%), the finger-tip-to-floor test (25.3%) and the relative lateral inclination (right: 1.4%; left: 1.4%) improvements were shown, while only in the Thomas test decreases occurred (right: –9.3%; left: –5.7%).
Apart from the fingertip-to-floor test (25.3%), these increases in ROM are lower than the possible mean ROM gain of 20.9% described by Thomas et al. [11] when executing a long-term static stretching program five times per week with at least five minutes of total stretching time per muscle in a week. In the present study, the training frequency was consciously chosen lower (twice per week, 80 seconds per muscle group) considering the feasibility of the training as WHPP and to save actual working time [19].
Only in the Thomas test, negative results occurred. Although the Thomas test, like the other tests [28, 33–35], has been shown to be reliable [29], the present data should be handled with care. In this study, 41% of the participants were predisposed (BMI≥25 kg/m2). A higher body fat percentage makes it difficult for the rater to palpate the spina iliaca anterior superior when controlling for pelvic tilt in the Thomas test [29]. It is therefore uncertain whether the subjects in this test actually became less flexible or if the results were deteriorated by lumbar extension. However, this did not affect the other tests, as body composition did not impair the execution of the tests or the palpation of bony landmarks [28, 33–35].
This had no impact on the ROM gains, since there was only a low correlation between body weight and the baseline-post difference of the retroflexion of the trunk (rho = –0.177) but neither body height nor BMI showed any correlations, which would have been the case if body composition had an impact on the trainability. The stronger influencing factor was baseline flexibility, showing positive significant correlations (rho = 0.247–0.443) in all tests except for the Thomas test. This is comparable to the effectiveness of strength training, which is higher in subjects with low training status [36].
The subsequent subgroups clustering (percentiles) provided a clearer insight in the actual differences in trainability of office workers (Table 5). Especially in subjects with limited initial flexibility considerable gains in ROM were measured (shoulder test: 37.8–39.3%; retroflexion of the trunk: 21.7%; relative lateral inclination: 2.6–3.8%; subgroup with average initial flexibility: fingertip-to-floor test: 33.8%). The magnitude of their ROM gains were considerably larger than in subjects with advanced flexibility (d = 0.477–1.075). These findings indicate that the “five-Business” stretch training is most effective for subjects with limited or average flexibility.
Based on the division of subgroups presented here, occupational staff can recommend the stretch training especially to those employees who might achieve significant gains in ROM. For preventive reasons, a stretch training could nevertheless be useful for employees showing advanced flexibility. Considering that flexibility decreases with increasing age [37], stretch training could contribute to maintaining the ROM. In three out of five tests. this was also visible in the present study (Table 2b). Since the population and also the workforce in industrial countries is consistently aging [38], this could be a plausible approach. However, in the current data, no correlations between age and trainability were found (Table 2b), although there was a tendency in subgroup composition (Table 5); on average, in all ROM tests, the subjects were the oldest in the subgroups with limited flexibility. In these subgroups, the male proportion was also higher than the female. In two out of five tests, female subjects were significantly more flexible than male subjects at baseline (Table 2a), which is supported by the findings of Shariat et al. [6].
The present findings are best comparable to another study by Shariat et al. [14], who also evaluated a stretch training program as a WHPP using ROM tests. The authors as well showed improvements in ROM, with the largest gains occurring in the lateral bending of the neck. Similar to the present study, the intervention lasted eleven weeks, however, the program was more time consuming; 13 exercises had to be performed three times per day, summing up to 30–45 min of working time lost to training. In other studies, the frequency and duration of the stretch programs were also rather large [8, 18]. A high loss of actual working time could impair the feasibility of stretch trainings in WHPP, even though they may be effective.
A limitation of the present study is the lack of a control group. By measuring ROM at the same time interval in a comparable cohort, it could be clarified whether the flexibility is subject to natural variations. A follow-up testing would also provide information on the sustainability of the improvements. On this basis, the positive results obtained could be better interpreted.
The successful implementation of a WHPP also depends on the willingness of employees to participate, which has been reported to be mixed [19, 39]. This is also reflected in the participation rate of only 11% in this study. The communication strategy via email possibly did not generate enough attention in view of the increasing number of emails that office employees now have to process on a daily basis [40]. Another indicator for the acceptance of the training among the employees is the maintenance of the training over a longer period. While in the present study, 25% of the subjects were lost during the intervention, in the literature drop-out rates of 10–20% [8, 18] have been reported; however, in these studies the authors did not actively monitor whether subjects actually performed the exercises, but trusted their confirmation. In the present study, subjects were supervised during each training and when participants missed an appointment, they were reminded via email or phone call to rearrange a session. Despite the low frequency of 10 minutes twice per week, the most common reason for drop-outs was the lack of time due to part-time contracts or frequent business meetings. This emphasizes the necessity of highly efficient trainings with low time expenditure, which was also highlighted by Sargent et al. [19].
Since the primary goal of a stretch training in WHPP is to reduce MSD, future studies should combine standardized stretch training programs requiring low time expenditure with questionnaires on MSD and, preferably, with measurement of muscle tension using a myotonometer [41]. This would contribute to clarify the relationship of MSD, ROM and physiological muscle tension.
Conclusion
The standardized and individualized stretch training “five-Business” performed twice per week over a three month period increases ROM in the trunk. Participants with limited or average range of motion exhibited the highest gains in ROM while participants with advanced baseline flexibility experienced no changes, or even decreases. This program can therefore be regarded as effective. When implying a stretch training in a WHPP, occupational staff should consider assessing the baseline flexibility of the employees to estimate the training success.
Conflict of interest
All authors declare that they have no competing interests.
Funding
There was no funding.