
Abstract
BACKGROUND:
Students, as well as other professional drivers, must have focus to adequately perform their tasks. However, they are subjected to whole-body vibration (WBV) in their journey to school or work.
OBJECTIVE:
To investigate the influence of in-loco WBV exposure on focus, both instantaneously, as well as residually. Analysis is performed for both genders, as well as for the presence of Attention Deficit Hyperactivity Disorder (ADHD).
METHODS:
Using a tablet computer, 20 volunteers played a focus game available on an app for brain training while exposed or not exposed to WBV. The exposure was that of a car travelling on a stone paved route. The performance measure was the score provided at the end of each game. Subjective comfort and difficulty evaluations were also investigated.
RESULTS:
The results suggest that WBV had a negative effect on the focus performance. However, it proved positive three minutes after the exposure (residual effect). The mean scores of females were higher than for males for most of the tests, apart from the one under WBV although at the expense of getting more discomfort. The difficulty level was not different within the gender groups.
CONCLUSION:
It could be concluded that the group with ADHD had a small but positive influence on the results for most of the tests, indicating that they are less affected by the presence of WBV. Since many students and workers have ADHD, this may be considered an important finding. It was shown that objective results should not be the only measures to use, as the subjective evaluation may explain the results better.
Introduction
All means of transport generate enough levels of vibration deserving consideration. For the passengers, that is in the form of whole-body vibration (WBV). When subject to it, the effects may be positive or negative, depending on the characteristics of the exposure [1–3] and the activity being performed. For example, the consequences may be felt on comfort, health, cognition or accomplishment of tasks [1]. In addition, Alam et al. [4] observed that WBV intervention is a method used for neuromuscular improvement.
Despite being exposed daily to vibration from different sources and intensities, people search for optimizing the time spent during commuting in big cities either when using public or private means of transport. Then, reading or performing a task on tablets, smartphones, laptops or books is a growing demand. One way of optimizing the journey idle time is to use brain fitness games to improve focus, memory, speed, problem-solving, visual areas, among others. Rosetta Stone [5] has developed the Fit Brains app exactly to improve such areas. An iPad app was chosen due to the observed beneficial effects of its daily use. Jacobs et al. [6] for instance, observed that apps help undergraduate students with a traumatic brain injury perform in daily life and academic settings. Computerized cognitive tests have been used for quite a while [7], although its understanding under vibration may be considered new.
The influence of whole-body vibration on cognitive performance has been evaluated separately [8–10] or combined with other agents such as noise [11, 12] or lighting [13]. Studies in mice show that acute vibration may cause damage to the brain [14]. However, other studies are showing that short sessions of WBV improve attention for object recognition in mice but not spatial cues of the objects [15], opening a field to unravel the underlying brain mechanisms. Boerema et al. [16], for instance, have shown beneficial effects of WBV in the brain of mice and humans.
Costa et al. [17] investigated the influence of WBV on professional drivers under three different WBV exposures (van halted, van on asphalt and van on cobblestone). They found statistical differences under the two strict WBV profiles. However, these were not related to gender. They have used 10 Km/h speed and the evaluation was performed using the omega test designed to examine precision in the handling of mechanisms and careful attention.
Thinking about students and cognition, they must have a good focus to get most of the content understood when they go to classes. In the case of the UFMG students, a great part of them come to the university by bus or private vehicle and the routes inside the campus exposes them to a lot of vibration [18]. However, the influence of the WBV on such area during and just after the exposure is not known precisely. Understanding this influence is also important for other populations, such as commercial drivers, among others. Consequently, that is one of the main objectives of the current study. It aims to investigate the influence of WBV on a focus related task through a tablet cognitive game developed with that objective. The volunteers traveled on a stone-paved track using a passenger vehicle. The WBV evaluation followed the recommendation of ISO2631-1 [19, 20]. The results are evaluated for both genders. Correlating focus on in-loco exposure is the main contribution of this paper.
The effects of vehicle vibration in task performance have been closely investigated by Narayanamoorthy and Saran [21] and the difficulty and discomfort caused by such exposure are stressed. In addition, another study shows that around vehicle frequencies, there is an increased demand for oxygen, so, contributing to the development of fatigue in occupations exposed to WBV [22]. Consequently, a deep understanding of the effects of such exposure on the quality of life of people is of paramount importance, mainly when the aim is cognition.
Regterschot et al. [8] showed that WBV improved cognition on healthy young adults. On the other hand, references [9, 10] investigated the influence on subjects with Attention Deficit Hyperactivity Disorder (ADHD). However, such studies used a laboratory simulation for the investigation, applying a 30 Hz frequency with a 4mm amplitude in a battery of days to get the results. It was shown that a short period of WBV treatment (considered as 2 min), resulted in increased attention performance of both healthy as well as ADHD population. No in-loco exposure studies have been found.
The difficulty of focusing on certain stimuli and focusing on important information when performing an activity may be related to Attention Deficit Hyperactivity Disorder (ADHD) [23–25]. Thus, it affects the quality of life of adults [26]. According to the American Psychiatric Association [25], ADHD is one of the most common mental disorders affecting children, but it can also affect many adults [27]. It is a neurobiological disorder characterized by symptoms of inattention, hyperactivity and impulsivity and, as a result, the focus is of paramount importance for people with such disorder. When talking about students with such disorder, understanding the influences may be even more important. Studies are stating that the continuous use of digital media may contribute to ADHD [28, 29]. However, to the best of our knowledge, there is no study investigating such a statement under WBV.
For that reason, the influence of this disorder while subjected to ambient vibration remains unclear, and is thus the objective of the current work. This study aimed to investigate the influence of gender and ADHD on a focus-related task employing a tablet cognitive game developed for that objective.
Methodology
Sample
In total 20 volunteers took part in the research. Ten men and 10 women were recruited to investigate the influence of ADHD and gender on the focus performance under WBV instantaneously and residual. Before the tests, the volunteers filled in a questionnaire called ASRS-18 developed by researchers in conjunction with the World Health Organization (WHO) so to detect the primary symptoms of ADHD [30] and validated to be used in Brazil. However, it is said that “the correct and precise diagnosis of ADHD can only be obtained after a long anamnesis with a medical professional (psychiatrist, neurologist, neuropediatrician)” [31]. Nevertheless, for research purposes, this questionnaire can be used as a first diagnosis. Based on this criterium, 4 out of 10 males could be considered to have the disorder, whereas only two females had it in the sample used. The higher incidence of the disorder among males was mentioned by [27], claiming additional research is needed to investigate why that happens. The sample size for each analyzed group can be seen in Table 1.
Sample size for each condition
Sample size for each condition
It was established that they should be between the ages of 18 and 30 and have completed or are pursuing higher education to guarantee a similar level of educational qualification. That is because Tun and Lachman [32] have shown that education has a similar importance to age on cognitive performance.
The volunteers also filled out a form about their general health condition (anamnesis), according to the recommendations of [1] and [33]. For those without restrictions, they also signed a free form of consent to participate in the research. The project was approved by the Ethics Committee of the university under the number CAAE 55602816.4.0000.5149.
Apart from filling in the ASRS-18, the anamnesis and the free consent forms before the tests, the volunteers also completed the first part of the “Form to take part into WBV tests in Vehicle” developed by Martinelli [34], which aimed to collect personal data from the volunteers, notions of their manual skills and familiarity of the volunteer with games, besides requesting a self-evaluation of the participant’s fatigue. The mean personal information of the volunteers used in the sample is presented in Table 2.
Mean personal information of the sample, stratified by gender
*BMI (Body Mass Index).
As mentioned before, the choice for a focus game was based on a cognitive task that would have a direct impact on the daily life of students and other professionals. As the study was conducted inside a university, the objective was to verify if the WBV exposure would decrease or improve the students’ focus and at what moment (investigation about the residual effect) that would affect.
A brain fitness game was used to investigate the influence of WBV on focus. It was available on the App Store [5] during the time the research was conducted. There were several free apps available on the market clamming to train memory, focus, emotional intelligence, speed, among others, but the choice of the Fit Brains app was based on the research background of the company, besides releasing the full game’s contents for the research.
The focus game used is called Matching Pairs. The app claims with this game “to enhance reaction speed and concentration capability, essentials to process the daily complex information”. It consists of several cards with different forms and colors where the user must find matching pairs. The higher the level played, the greater the number of pairs must be found at each instant of time. Accordingly, it is necessary to click on top of the matching pairs to get it right. Each game lasts 1 minute and the volunteer must get as many pairs as possible within that time. It was defined as the most appropriate game to be performed under WBV since it does not have small details to be seen, does not require mathematical reasoning and presents an appropriate level for the analyzed age group.
In the beginning, it was intended to use a smartphone as the engine to run the app installed to evaluate the task performance, since it is the most common engine on the daily life of people inside means of transport. However, on preliminary tests, it was observed that its display was small for the performance of the game under WBV, as vision may get blurred [1]. Therefore, it was opted out to use a tablet instead. As the app used was optimized for the IOS system, the iPad Mini was selected since it was the most commercialized among the models [35].
The score given at the end of the game is calculated by the app taking into consideration the reaction time, the number of correct answers (as a bonus score is given when correct answers are obtained in sequence) and the accuracy while playing. Since it provides an overall evaluation of the game performance it was considered as the measure for the focus performance for the current study.
All volunteers had to achieve the advanced level of the game to standardize the procedure. At that level, they were required to play twice. That decision was taken during preliminary tests with seven volunteers, where the non-observation of such level requirements resulted in very distinct performances [34]. Moreover, it had the objective of making the volunteers familiar with the game. Consequently, they had to play at the beginners and intermediate levels, to achieve the advanced level. As a result, the number of played games varied within the volunteers, depending on the ability.
Track, velocity, and vehicle used
A stone-paved section representing the type of pavement that mostly characterizes the tracks inside UFMG was used (see Fig. 1). As seem, the stone-paved tracks available in Brazil are different from the ones available abroad (cobblestone), since the stones are not uniform in size, nor shape [18]. The total distance of the track used during the WBV tests was approximately 0.9 km, in a way that no traffic would interfere with the measurements.

Section of the stone-paved track.
The speed was fixed around 40 km/h since it is the speed limit inside the campus and it is common internal traffic speed. Thus, the meantime to go through the entire track was approximately 00:01:20 s, time enough to perform the game, as described in section 2.2.
A Fiat Punto, year 2013, was the vehicle used [34]. The angle of the passenger seatback, where the seat accelerometer was mounted, was equal to 140, below ISO2631-1 [19] recommendation and to that end acceptable for data collection.
The vibration data was obtained both for WBV and HAV (Hand Arm Vibration) over time. For that, a seat tri-axial accelerometer (model AP2083, from APTechnology) and a hand tri-axial accelerometer (model Delta Tron 4524-B-001, from Brüel & Kjaer), connected to a PHOTON Dynamic Signal Analyzer (from LDS) were used. The analyzer has 4 channels. Wherefore, data were collected from the three orthogonal directions (x, y, and z) of the seat and the x-direction (mounted on the vertical direction) from the hand, so to allow the calculation of the transmissibility between the seat and the hand afterward. The acquisition software was the RT Pro Photon, installed in a laptop. The app used for the game was installed on an iPad Mini, model 2 GSM, from Apple, weighing 850 g and with dimensions of 24× 19× 1 centimeters.
The seat accelerometer was positioned at the rear right seat, at the first point of contact with the passenger, following the recommendations and orthogonal system of ISO2631-1 [19, 20]. The hand triaxial accelerometer was installed over an adaptor used to minimize its influence on the hand. It was positioned as a ring on the middle finger, as close as possible to the third metacarpal bone, in the hand preferably used to perform the task on the iPad, following the recommendations of the ISO5349-1 [36]. Figure 2 and Fig. 3 show the details of each positioning.
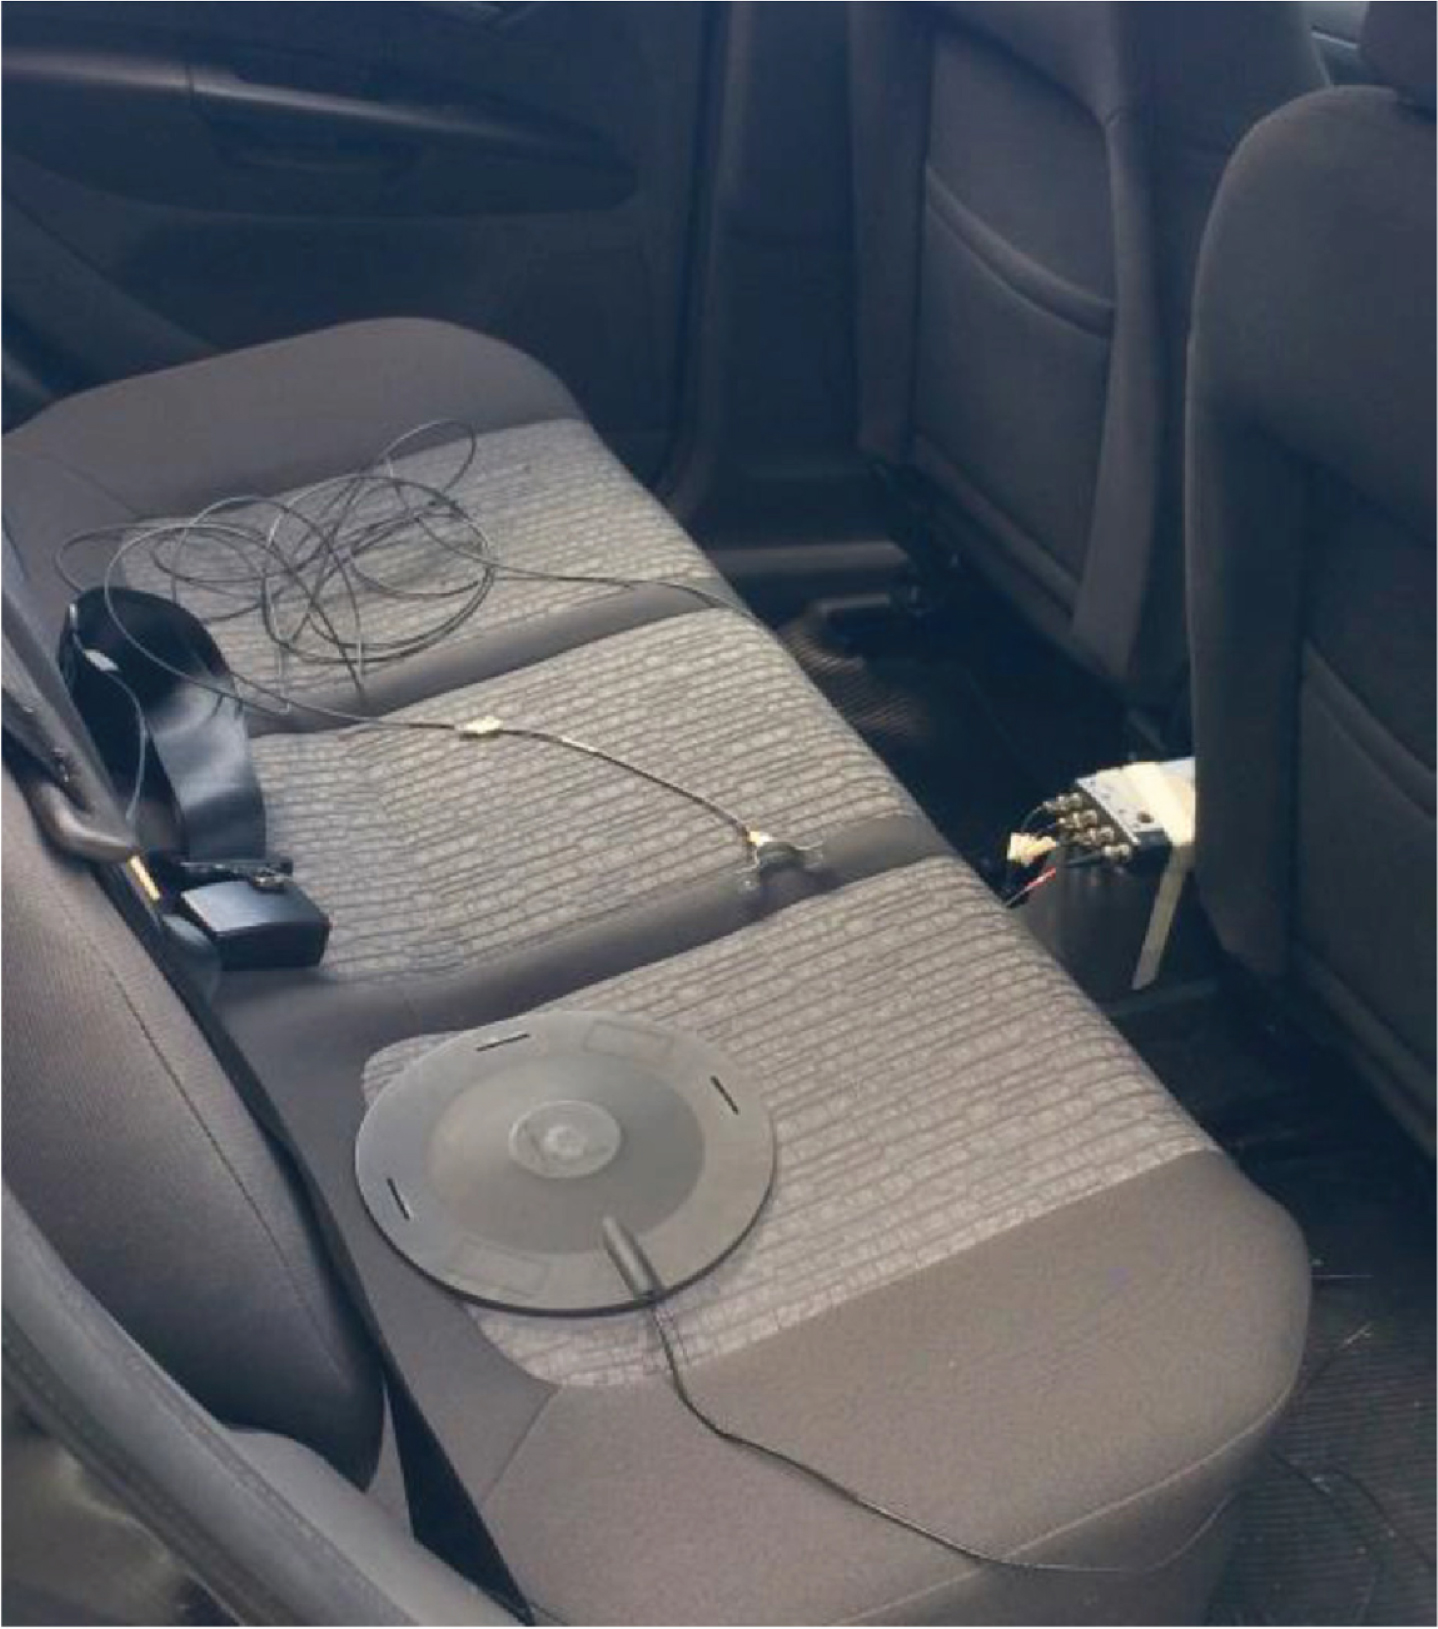
Positioning of the seat accelerometer at the rear seat.

Details of the support and the positioning of the hand accelerometer.
The PHOTON acquisition system was positioned between the front seats, to allow the connection with the accelerometers and the laptop. The later was positioned on the front passenger seat and was handled by a researcher sitting on the same seat. This researcher was responsible to start and stop the data collection and to ask volunteers questions about their subjective comfort and difficulty (as explained in section 3.4).
After being familiarized with the game (as explained in section 2.2), each volunteer played the same focus game once for each one of the four test conditions (according to Table 3), following a standardized procedure. The volunteer was positioned on the right rear seat of the vehicle. They were instructed to seat over the seat accelerometer and to put the hand’s accelerometer as mentioned in section 2.4. The same instruction was given on how to hold the tablet during the games, that is, in the most comfortable manner. Then, Test 1 was performed, with the car stopped, being that the base of comparison with the other situations (control). Right after starting the track and reaching the desired velocity (Test 2), the researcher was informed to start the data monitoring for the WBV and HAV and the volunteer was required to start playing the game again. At the end of the track, the data monitoring was stopped, the car parked with the motor on, and the volunteer played immediately again (Test 3). Three minutes after that, the last game was played (Test 4). Therefore, the track was chosen to allow parking the car immediately after stopping. Talks and noises were avoided during the games, as they proved to interfere with the volunteer’s concentration and consequently, with the performance on the game [34]. Test 1 was the only one strictly free of WBV, as Tests 3 and 4, aimed to investigate the WBV residual effect.
Tests sequence
Tests sequence
The great majority of the volunteers performed Test 1 with the car motor off. However, some volunteers played with the motor on, due to the air conditioning of the car. Tests 3 and 4 were performed mainly with the car on for that same reason. Nevertheless, the vibration coming from the motor could be considered as noise on the measurements, as its WBV was much lower than the levels obtained when the car was moving.
The score provided after each played game was recorded for later analysis, as a print screen image of the game results. Then, the volunteer was questioned about the comfort and difficulty felt at each situation. For that, the comfort and difficulty scales as applied by Belo [37] in task tests using smartphones over a vibration platform were used. The scales are presented in Table 4 and Table 5 for comfort and difficulty scales respectively.
Comfort scales used for the subjective evaluation of vibration
Source: Modified from [37].
Difficulty scales used for the subjective evaluation of vibration
Source: Modified from [37].
The second part of the “Form to take part into WBV tests in Vehicle” developed by Martinelli [34] was completed and had as objective this time to get information about how the tablet was supported during the tests, which hand was used to click on the screen, whether the vibration caused fatigue and whether there was any factor interfering with the test, such as difficulty in clicking, fatigue, support of the hand accelerometer interference, among others. Such information was self-reported since it was not possible for the researchers during the tests to verify such information.
There are some limitations of the current study which should be taken into consideration while reaching the conclusions. The first limitation is the small sample used (20 volunteers), mainly considering the number of volunteers with ADHD. A larger number of volunteers will improve the statistical analysis and the conclusions from the possible ADHD effects. Another limitation is the analysis of only one type of pavement, although the pavement used was chosen among the ones that transmit the highest level of vibration to the passengers. Other types of pavement can lead to different results of comfort and difficulty, generalizing a bit more the conclusions. Various types of vehicles can be tested which can also lead to other behaviors of comfort and difficulty levels and different correlations with each other. Although standardized to the most comfortable manner to the volunteers, the way the tablet was held (as it will be mentioned in section 3.3) also deserves a further investigation as this may have influenced posture, head angle and the transmissibility of vibration to the eyes.
Results
Vibration levels
Vibration data was measured (x, y, z at the seat, and x at the hand) and the weighted rms acceleration at each axis was obtained according to ISO2631-1 [19]. The weighted rms values for each volunteer (called measurements) are presented in Fig. 4. The vertical vibration (z-axis, according to ISO2631-1 [19, 20]) was the main excitation, reaching levels around 1.25 m/s2 [34] much higher than the values found by Duarte and de Melo [18] at that same speed and similar track. The difference, however, may be attributed to the place where the vibration was measured (at the rear seat for the former and the co-pilot seat for the latter) since cars are normally optimized for the driver’s axes.

Weighted acceleration values at each measured axis for each volunteer (measurement).
The seat-to-hand transmissibility was calculated, and the results are presented in Table 6. Both input and output were considered without weighting. The output was considered the hand (x-axis), whereas the input was considered the seat (x, y, and z-axis). The total acceleration between the hand and the seat is also presented. The maximum value was 8% for the x/x direction. Consequently, one can say that vibration at the hand was attenuated.
Mean transmissibility between seat and hand
When observing the results in frequency [34], for the x-axis vibration, the main peaks measured are close to 0.5 Hz and between 1 and 2 Hz. The y-axis exhibits similar behavior, with most peaks between 0.5 and 1 Hz. For the z-axis, it was observed that most peaks are between 1 and 10 Hz, mainly close to 1.5 Hz, between 4 and 5 Hz, and between 7 and 10 Hz. Frequency values close to or slightly above 1 Hz, as observed on all axes, may be related to the body resonance frequency [2]. Values close to 2 Hz, also present on all axes, may represent the resonance frequency of the vehicle suspension [38]. Frequencies close to 3 Hz are mainly observed on the z-axis and may represent a prone condition for passenger fatigue and drowsiness [39]. Besides, frequencies near 4 and 5 Hz, mainly present on the z-axis, may be related to the traditional seating structure, which amplifies vibrations near this range, while minimizing frequencies below 2 Hz and above 10 Hz [1], [40]. Values close to 10 Hz, observed on the z-axis, may be associated with the frequency of the tire-wheel assembly [38].
The first collection of results can be seen in Fig. 5, stratified by test (Test 1 to Test 4 and total = Test 5), gender (Total, Male or Female), and the presence or not of ADHA (with, without or total), where N represents the sample size considered, following Table 1. As mentioned, Test 5 is, in fact, the collection of all test results for the population considered, then, regardless of the test. Therefore, N is multiplied by 4 on those columns, the reason why they are presented in different colors. The results are given as mean score values obtained for each population considered, together with the standard errors. A discussion about those results is presented in the following sections.
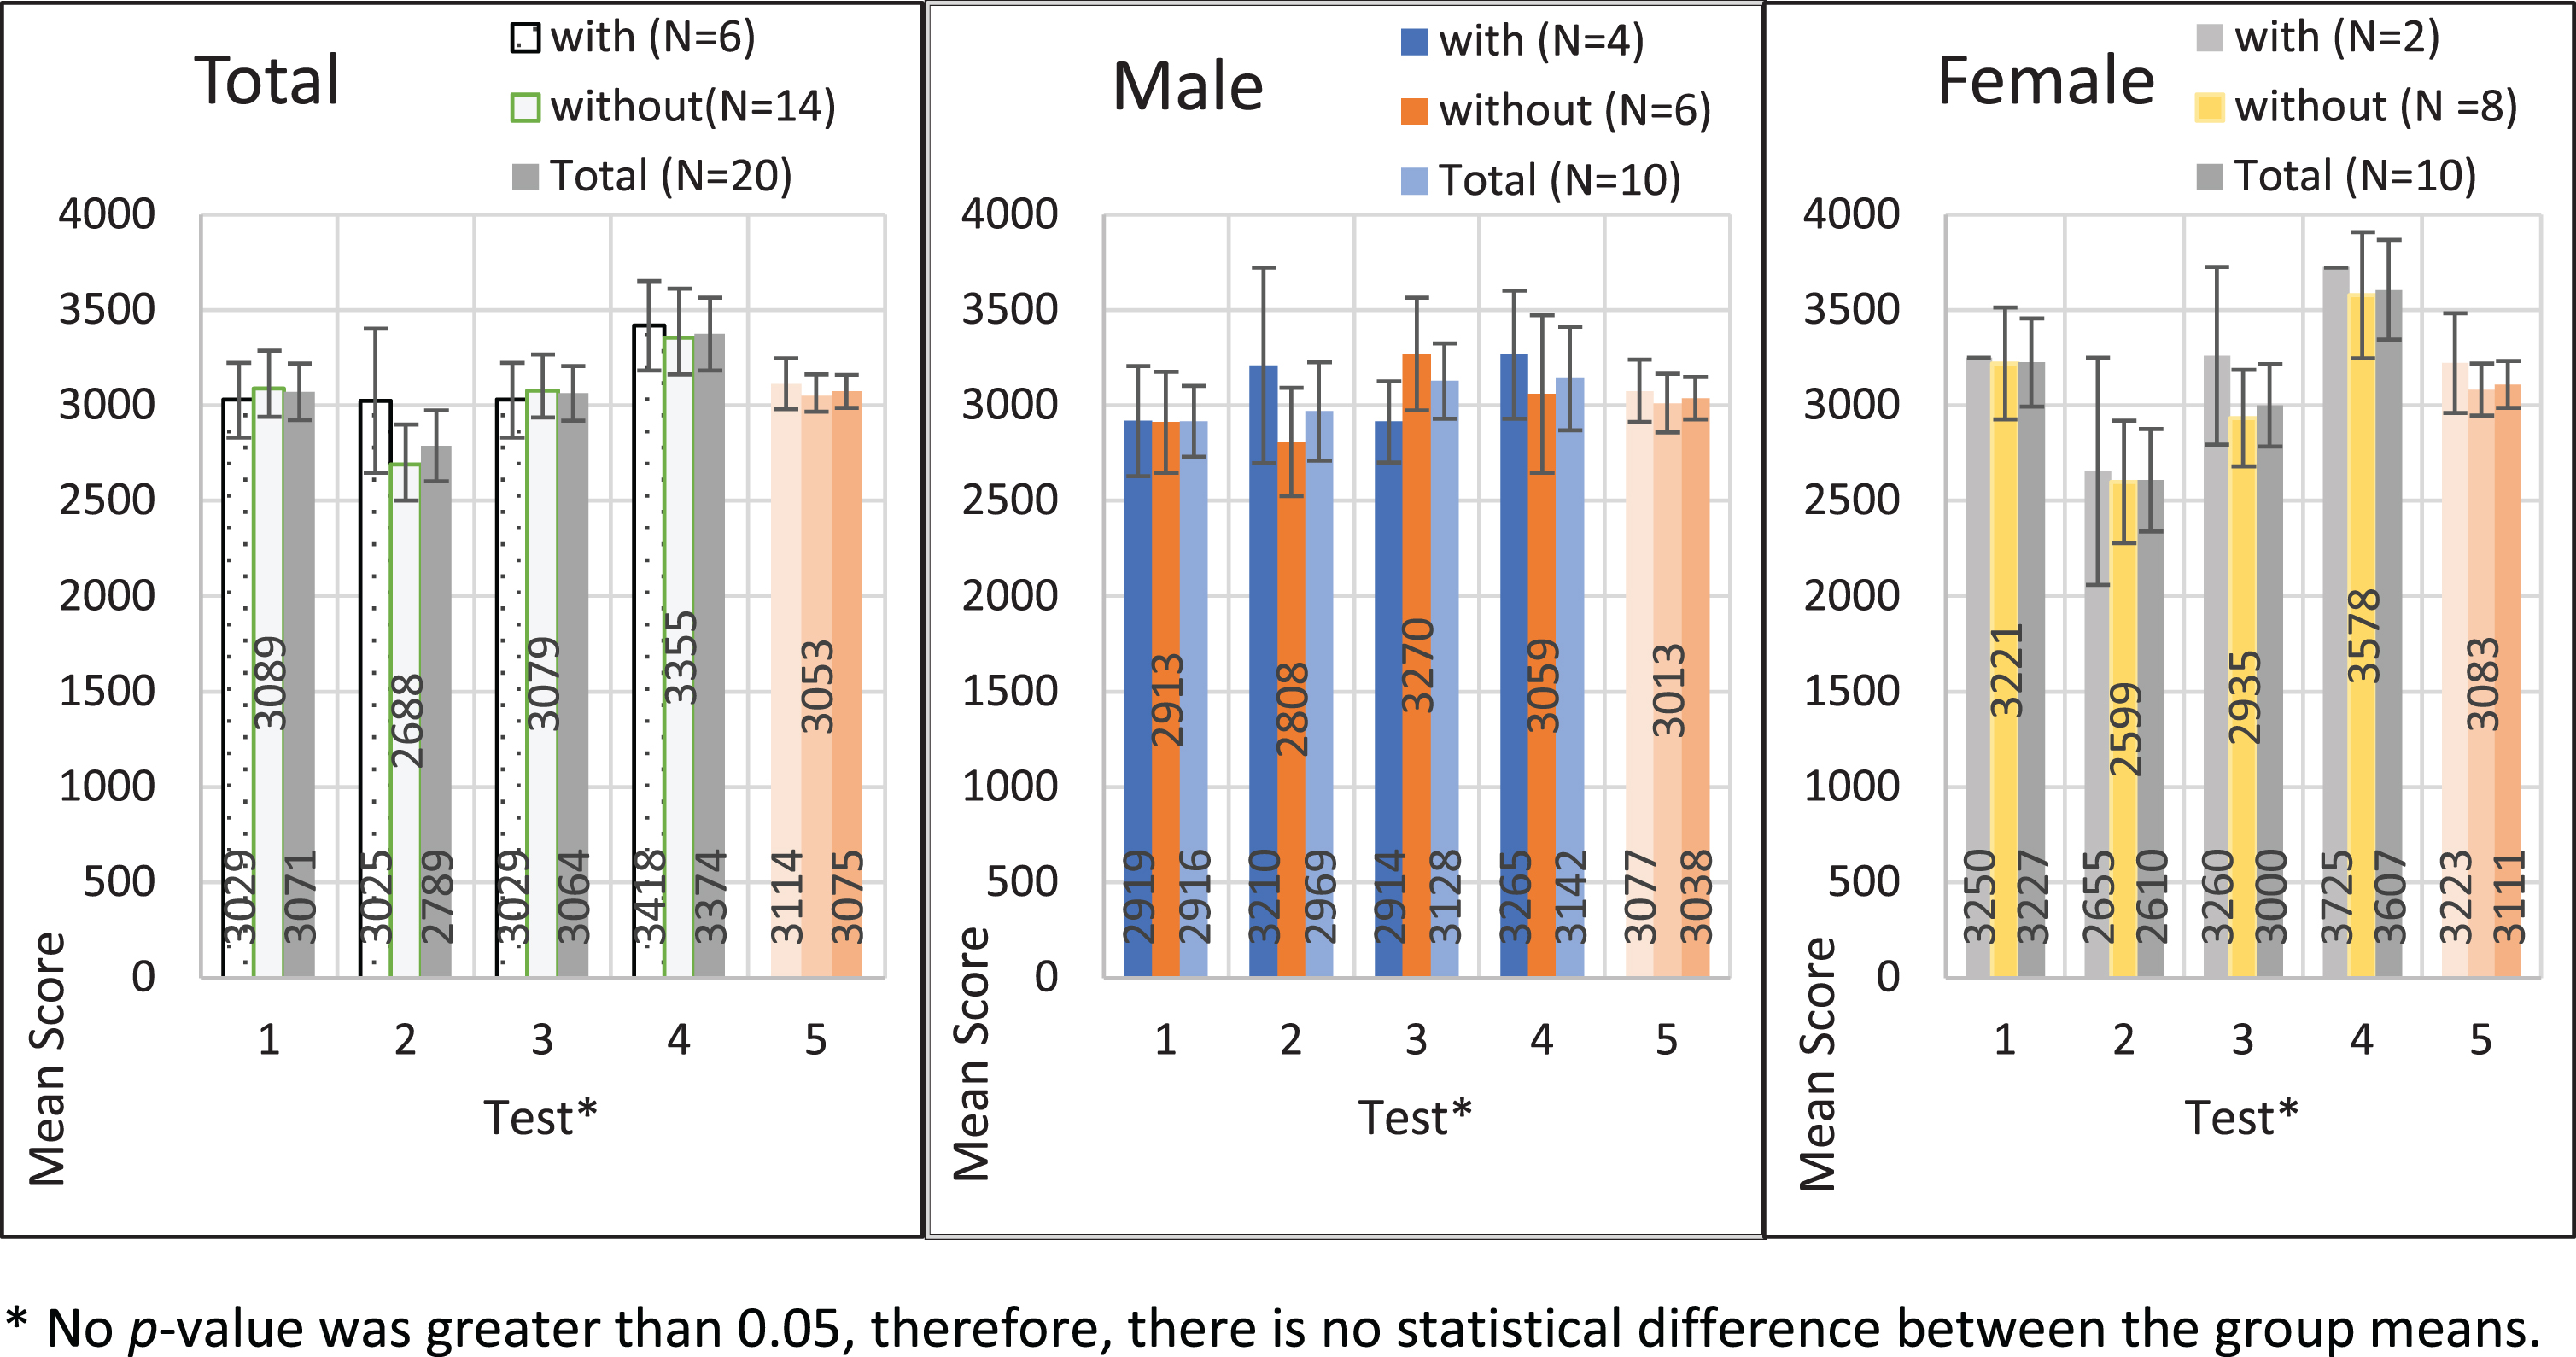
Mean values with standard errors for the score performance within gender and ADHD groups.
First, the performance data given by the app as scores were grouped by test and compared using the analysis of variance test (ANOVA), checking if the difference between the means of the groups (Test 1, 2, 3 and 4) were significant. A confidence level of 95% was considered, that is, for p-value<0.05 the results are statistically different. So, the first objective was to verify the influence of WBV both instantaneously as well as residual on focus, for each test. As a second objective, the influence of gender and the presence of the first diagnosis criterium of ADHD when playing a focus game under the presence or not of WBV was considered and that was analyzed using multiple analysis of variance (MANOVA) [41]. The significance level was also set as p = 0.05.
In the end, the data collected by the “Form to participate in WBV tests in Vehicles” developed by Martinelli [34] such as familiarity with games, fatigue after the test, the form of supporting the tablet, among other characteristics, were analyzed quantitatively concerning the frequency of occurrence. The last results are presented in section 3.4.
This analysis aimed to verify the focus performance within the conditions, from the comparison of the score of each test. The Bonferroni post hoc test was applied [42]. At all tests, the significance level of p = 0.05. The SPSS Statistics (version 24) was used to calculate the ANOVA test.
The score values for each test are presented in Fig. 5, with the corresponding standard error, grouping both genders. Hence, the analysis here are for the first plot (Total) for the columns Total (T1 = 3071, T2 = 2789, T3 = 3064 e T4 = 3374). The mean score value for Test 4 is higher than all tests, followed by Test 1, Test 3 and Test 2. Thus, WBV was positive for the focus performance, not during the exposure, but residually. The performance under WBV (Test 2) presented the lowest score. Moreover, Test 2 and Test 4 presented higher standard deviation, showing that at these conditions (under WBV and 3 minutes after the exposure), the scores varied more within the volunteers. The score for Test 1 (control) and Test 3 (immediately after the exposure) are close (<1% difference), showing that WBV had no immediate influence on the scores. However, considering the standard error between the tests, one cannot say the overall results are different. Nevertheless, when analyzing the subjective responses (as it will be presented in section 3.4), the results show more the difference between the tests, stressing that objective measures should not be the only parameter analyzed.
No comparison had significance (or p-value) lower than 0.05. Therefore, there was no difference for the means within the groups, stressing the observation made above.
Gender versus test analysis
The influence of gender at each test can also be seen in Fig. 5. However, now one needs to consider the Total columns on the Male and Female plots (Males: T1 = 2916, T2 = 2969, T3 = 3128, T4 = 3142; Females: T1 = 3227, T2 = 2610, T3 = 3000, T4 = 3607). The overall performance of the female group is higher at all tests, apart from the one under the strict WBV (Test 2). As a result, females are more affected by the presence of WBV than males. The differences within the groups were more significant at Test 4 and Test 2, with 15% and 13% difference, respectively. Gender had no influence on the test immediately after the WBV exposure, where the score performance was almost the same (<5% difference). Again, as all p-values are greater than 0.05, that means there is no statistical difference within the groups.
Gender and ADHD influence at each test
The influence of gender, ADHD and both were analyzed using a multivariate analysis of variance (MANOVA) in each test condition. A Turkey post hoc test was applied [42].
The score for each group (male x female), (with x without ADHD x total) during each test are also presented in Fig. 5. It is observed analyzing this figure that for Test 1 (that is, without WBV), the mean values for people with and without ADHD were very close (<1% difference). Considering the standard error, one cannot say that one group performed better than the other. However, considering gender, females had better performance than males, with the former group means values being approximately 11% higher than the latter.
For Test 2 (that is, in the presence of WBV), males had better performance than females with the mean results approximately 12% higher. One possible explanation for that is the fact that males usually play games more than females, as it will be demonstrated in section 3.3. Males with ADHD performed approximately 13% better than those without the disorder, whereas for the female group that difference was only 2%. This small difference within the female group may be attributed to the small sample with the disorder. Males with ADHD performed better under WBV than at the control test, indicating that the presence of WBV may be positive for the focus performance of such population.
The score for Test 3 shows that males with ADHD had performance 12% worse than those without the disorder. For the female group, the opposite happened where the ADHD group performed 10% higher than those without the disorder. The difference between the mean scores for the female and male groups is small, with the latter 5% only superior to the former. Males without the disorder played better under the residual vibration, being the results the best within all situations.
Analyzing the scores for each group at Test 4, females had 15% higher performance than males. Besides, at both groups, volunteers with ADHD had higher scores (7% for males and 4% for females) than the group without the disorder. The mean difference within the ADHD group against the group without the disorder was only 2%.
The main conclusion possible from this figure is that males with ADHD were benefitted from the WBV influence, mainly during the exposure (Test 2), but also residually (Test 4). The female group was more affected by the presence of WBV (Test 2), however, residually (Test 3 and 4), they were benefited. Both males, as well as females with the disorder, played better than the group without the disorder, leading to a conclusion different from the expected, that is, the focus of the former group is apparently better than for the latter. However, the differences are marginal, as the standard errors overlap the results. That may have been due to the number of games played. Making a bigger battery of games may lead to a more concise conclusion.
Analyzing the influence of gender and ADHD individually and combined (Table 7) suggests that there is no significance in the results (p > 0.05). Therefore, gender, ADHD and both did not affect the performance score. The results are obtained for the effects between the groups for Test 1, Test 2, Test 3 and Test 4. MANOVA tests whether there are differences in the response variable between groups of the explanatory variables. The results show that those differences are not statistically significant, i.e., the explanatory variables show no effect on the response variable.
Effects within groups for Tests 1, 2, 3 and 4 (MANOVA analysis)
Effects within groups for Tests 1, 2, 3 and 4 (MANOVA analysis)
A general analysis of the influence of ADHD regardless of test on gender for the performance scores is given in Fig. 6. No p-value was greater than 0.05, showing there is no statistical difference within the groups. However, it can be noted that volunteers with ADHD performed better irrespective of gender. The results for the female group, in general, were better than for the male. However, the results are within the standard error of the analysis. One observation for the female group is that they got better results at the expense of getting more tired, as shown in section 3.4.

Mean values with standard errors for the score performance within ADHD groups stratified by gender.
The influence of ADHD on each test is presented in Fig. 7. No statistical difference was observed within the tests, as all p-values were less than 0.05. Nevertheless, ADHD presence was more significant in Test 2, representing a score increase of 12%. For that reason, one can say that under WBV, the presence of ADHD is an important factor. For Test 1 (control), immediately after stopping the car (Test 3) and three minutes after that (Test 4), there was hardly any difference within the groups, with differences around 2%. The performance within the tests for both groups (with and without ADHD) was the same, with better performance being from Test 4, 3, 1 and 2, respectively.

Mean values with standard errors for the score performance within tests stratified by ADHD.
The main results obtained from the “Form to take part in WBV tests in Vehicle” [34] are summarized below: 40% of the male group had ADHD, while the female percentage was only 20%. 30% only of females are familiar to play games, whereas in the male group that percentage was 70%. Males generally use computers to play (50%) instead of smartphones (20%). For females, 20% play on smartphones, and only 10% on computers. No volunteers play on the tablet. 67% of females play games for about 1h and 33% for about 30 minutes. For the male group, there were discrepancies relative to the time dedicated to playing, varying from 10 min to 6 h. 30% of females were tired before the tests and this number reached 90% after the tests (10% being indifferent). 40% of males were tired before the tests and this number reached 50% after the tests (20% being indifferent). 60% of females reported having the performance impaired by fatigue, whereas 40% were indifferent or not impaired at all. Seventy percent (70%) of males were not disturbed by fatigue at all. All the volunteers were right-handed and used those hands to click on the screen, apart from one volunteer that used both hands. 90% of the females held the tablet on the lap, whereas 30% of males adopted such position. 50% of the males held the tablet by hand. Most of the volunteers did not find that any other factors disturbed the performance during the test. However, for those who felt something, it can be cited the following factors: 1) Hands sensor, 2) clicking difficulty, 3) difficulty to hold or handle the tablet.
Evaluation of comfort and difficulty
As mentioned before, data about comfort and difficulty to perform the focus task were collected after each game. The frequency of occurrence of each subjective response at each test was obtained so to generate a subjective evaluation of the test conditions. Also, to allow the evaluation of the differences between the genders. Figure 8 shows the comfort evaluations for both genders by test.
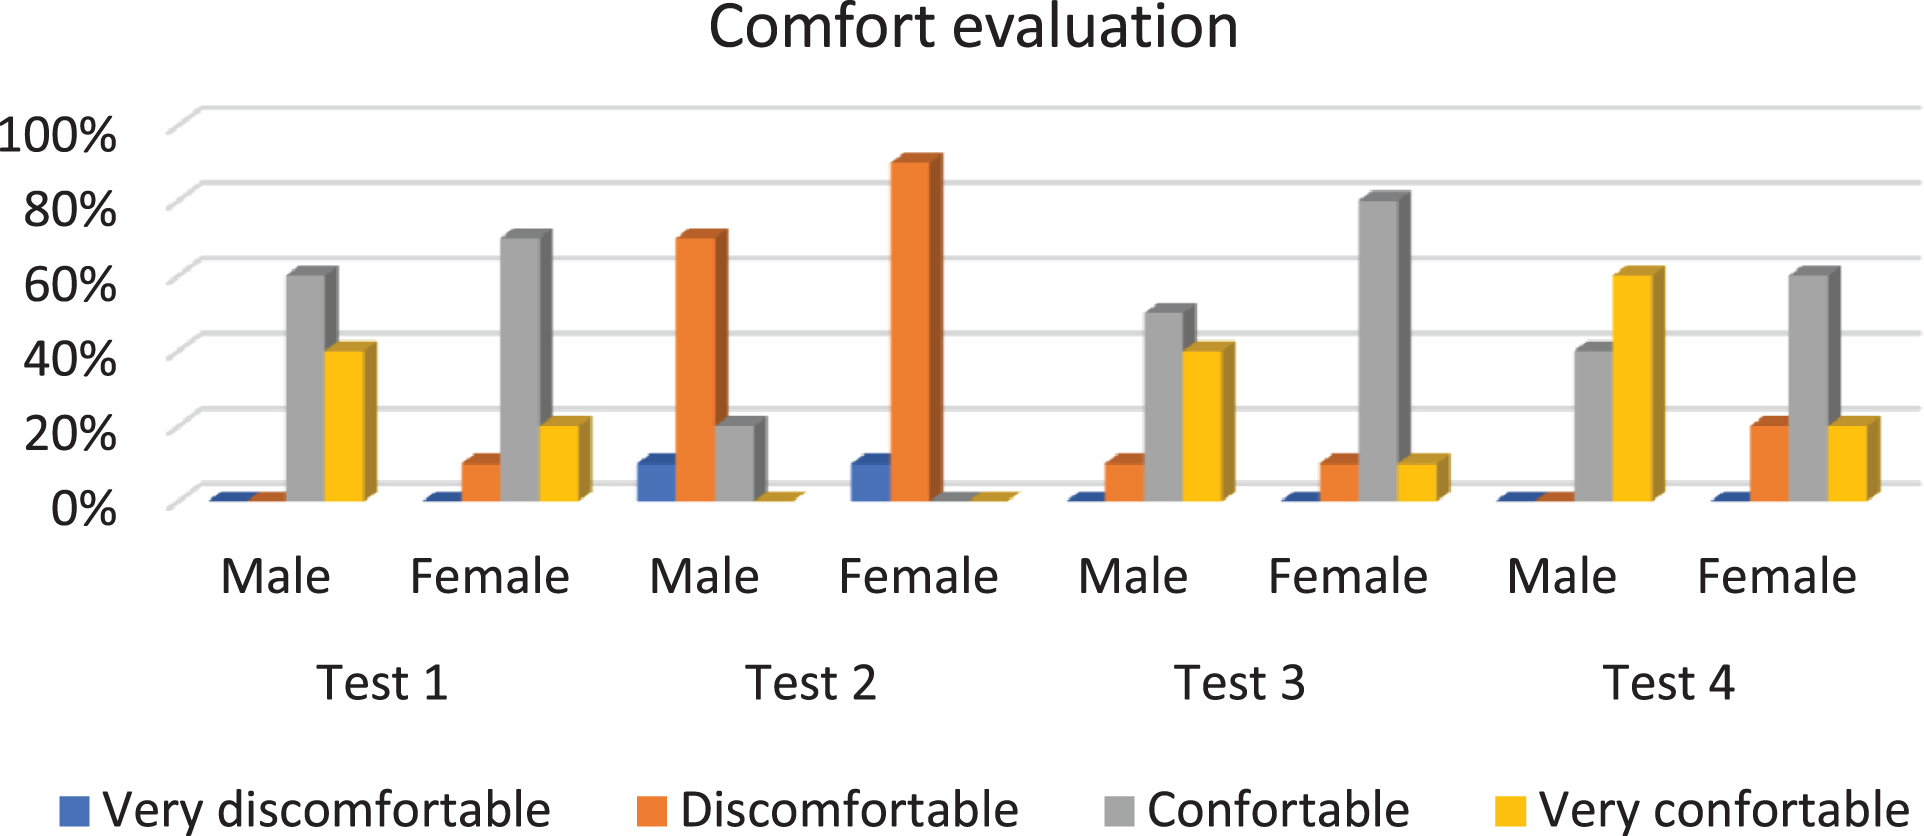
Comfort evaluation by gender after each test.
Looking at the results, one can observe that both groups had similar behavior relative to a higher discomfort during the test under WBV (Test 2) than at the tests under no vibration. In general, females felt more discomfort than males at all tested conditions. For the male group, discomfort rises within Test 2, decreases at Test 3 (immediately after WBV exposure) and reaches better comfort levels at Test 4 (residual vibration) than at the control situation (Test 1). For the female group, discomfort rises at Test 2 (under WBV), decreases at Test 3, but at Test 4, it presents levels of discomfort higher than at the control situation. Therefore, it is possible to conclude that WBV had a residual effect on the female group, increasing her discomfort, which did not happen for the male group.
Figure 9 presents the difficulty levels at each test condition stratified by gender. As observed in the comfort evaluation, both genders felt more difficult to perform the task under WBV (Test 2). For males, difficulty raised at Test 2. At both two tests after the WBV exposure (Test 3 and Test 4), the difficulty levels turned easy again, although slightly more difficult than control. No difference can be seen for the residual evaluation. For females, performing the task was easy at Test 1 (control) and became difficult at Test 2 (under WBV). Test 3 was easier than Test 2, however, more difficult than the control test (Test 1). For the residual test (Test 4), although some women felt the task more difficult than Test 1, compared with Test 3, there was a tendency to find the performance easier.

Difficulty evaluation by gender after each test.
Generally, as expected, Test 2 under WBV presented the worst overall performance. The second worse score was obtained for Test 3, indicating that residual WBV (immediately after) continued to disturb the performance of the focus game. However, the scores increased at Test 4, indicating a better cognitive focus performance under residual vibration. One can claim it is due to the familiarization process; however, the procedure adopted for playing the game decreases the chance of such interpretation.
Comparing the obtained results within genders, on Test 1 and 4, the female performance was superior to the male performance. On Test 3, the scores were similar, and on Test 2, male results were superior to female ones. It was observed that the mean score values for males varied less within the test under WBV, whereas the female results had a greater variability.
Moreover, at the end of the tests, 90% of the female group complained about fatigue under WBV, while only 50% of the male group felt that. At the end of the tests, 60% of females found one factor or another disturbed the test, compared with 40% of males. The decrease in performance was attributed to fatigue (60% for female x 30% for males). Then, although the scores were not very different within the tests, that was at the expense of getting more tired. The same observation was obtained on a cognitive study developed by de Araújo [43].
Although males reported playing more games than females, mainly on computers, their performance was lower for most of the tests (apart from the one under WBV). Accordingly, it can be concluded that for the focus game used, the familiarization with games was not an influential factor. An investigation is valid to understand if the media used influences this conclusion.
Considering the evaluation of comfort levels, for both genders, Test 1 and 4 were the most comfortable ones. Test 2 was evaluated mainly as uncomfortable. Test 3 presented discomfort levels higher than Test 1, suggesting that the WBV residual effect was responsible for that. All test conditions were more uncomfortable for the female group when compared with the male group tests. That was different from the finds of Costa et al. [17], which found no gender influence on the results.
For the general evaluation of difficulty, both genders presented similar results with a difficulty increase at Test 2 (under WBV). For males, the difficulty increased at Test 2 and the last two tests returned to difficulty levels similar to Test 1. For females, Test 2 was the most difficult, whereas the levels for Test 3 and 4 were superior to those obtained at Test 1, suggesting a residual effect of vibration, as the fatigue reported by the majority of the women after the test.
Conclusions
This work evaluated the influence of ADHD and gender on the performance of a focus game played on a tablet, when subjected or not to whole-body vibration (WBV). An in-loco car excitation was used which ranged about 1.25 m/s2 on the passenger back seat. Four tests were realized, the first one (control) with the car parked (Test 1), the second test with the car under WBV (Test 2), Test 3 immediately after stopping the WBV, and Test 4, three minutes after stopping the exposure.
The results show that females are more affected than males by the presence of WBV, experiencing more residual effects. Nevertheless, as the mean performance within genders was similar for Test 3, but females were superior to males at Test 4, it is concluded that the WBV had no residual influence on results. However, the best performance was achieved at the expense of greater fatigue.
In general, volunteers with ADHD had better performance on most of the focus test. The better performance was obtained for Test 1, Test 2 and Test 4 for both genders (in that order), and at Test 3 for the female group. ADHD was more influential for females, which can be associated with the smaller number of women on the sample used. Bigger differences were obtained at Test 2 under WBV, followed by Test 4, whereas the results of Test 1 and 3 were very little affected.
Despite the small differences, the positive results for the ADHD group may indicate that people with such disorder are less affected by the influence of WBV on focus. That is true mainly for males (as observed for Test 2). The results are promising as a treatment for people with ADHD. However, increasing the sample used is important and studying how the battery of tests influences the results may be a continuation for the current study.
As collected after the tests, the way the tablet was held may have interfered in the results as 90% of females supported the tablet on her lap, while only 30% of males did de same. In general, the later hold the tablet on the hands. Therefore, that is another point that deserves an investigation as this may have influenced posture, head angle and the transmissibility of vibration to the eyes.
Conflict of interest
None to report.
Footnotes
Acknowledgment
The authors would like to thank Dr. Conny Lin (from Rosetta Stone) for allowing the use of the full version of the app adopted.